
Travelers (TRV)
Travelers piques our interest. Its annual EPS growth of 21.5% over the last five years has topped its peer group.― StockStory Analyst Team
1. News
2. Summary
Why Travelers Is Interesting
Tracing its roots back to 1853 when it insured travelers against accidents on steamboats and railroads, Travelers (NYSE:TRV) provides a wide range of commercial and personal property and casualty insurance products to businesses, government units, associations, and individuals.
- Capital generation for the next 12 months is expected to accelerate above its two-year trend as Wall Street forecasts robust book value per share growth of 19.3%
- Incremental sales over the last five years have been more profitable as its earnings per share increased by 21.5% annually, topping its revenue gains
- A drawback is its estimated sales growth of 1.8% for the next 12 months implies demand will slow from its two-year trend


Travelers shows some potential. If you’ve been itching to buy the stock, the price looks reasonable.
Why Is Now The Time To Buy Travelers?


Travelers is trading at $277.91 per share, or 1.6x forward P/B. Travelers’s current valuation is below that of most insurance companies, but this doesn’t make it a bargain. Instead, the price is warranted for the quality you get.
It could be a good time to invest if you see something the market doesn’t.
3. Travelers (TRV) Research Report: Q4 CY2025 Update
Property and casualty insurer Travelers (NYSE:TRV) met Wall Streets revenue expectations in Q4 CY2025, with sales up 3.1% year on year to $12.43 billion. Its non-GAAP profit of $11.13 per share was 26.8% above analysts’ consensus estimates.
Travelers (TRV) Q4 CY2025 Highlights:
- Net Premiums Earned: $11.15 billion vs analyst estimates of $11.15 billion (2.6% year-on-year growth, in line)
- Revenue: $12.43 billion vs analyst estimates of $12.39 billion (3.1% year-on-year growth, in line)
- Combined Ratio: 80.2% vs analyst estimates of 86.4% (617.3 basis point beat)
- Adjusted EPS: $11.13 vs analyst estimates of $8.78 (26.8% beat)
- Book Value per Share: $151.21 vs analyst estimates of $161.40 (23% year-on-year growth, 6.3% miss)
- Market Capitalization: $60.14 billion
Company Overview
Tracing its roots back to 1853 when it insured travelers against accidents on steamboats and railroads, Travelers (NYSE:TRV) provides a wide range of commercial and personal property and casualty insurance products to businesses, government units, associations, and individuals.
Travelers operates through three primary business segments: Business Insurance, Bond & Specialty Insurance, and Personal Insurance. The Business Insurance segment offers a broad array of coverage options for companies of all sizes, including workers' compensation, commercial automobile, general liability, commercial property, and commercial multi-peril policies. These products are distributed primarily through thousands of independent agencies and brokers across the United States and internationally.
The Bond & Specialty Insurance segment provides surety bonds, which are three-party agreements where Travelers guarantees the performance of a bonded party to a third party. This segment also offers fidelity insurance, which protects businesses against employee theft, as well as management liability, professional liability, and cyber risk coverage.
In the Personal Insurance segment, Travelers markets automobile, homeowners, and other personal coverage products to individuals. With approximately 8.8 million active policies in the United States and 425,000 in Canada, this segment reaches customers through independent agents, direct marketing, and affinity partnerships with employers and consumer associations.
Travelers employs sophisticated risk management strategies, including the use of data analytics and catastrophe modeling to assess and price risk appropriately. The company maintains a conservative investment approach, deploying most of its funds in a diversified portfolio of high-quality, liquid fixed-income securities to ensure it can meet insurance obligations. To manage exposure to large losses, Travelers utilizes various reinsurance arrangements, effectively sharing portions of risk with other insurers.
4. Property & Casualty Insurance
Property & Casualty (P&C) insurers protect individuals and businesses against financial loss from damage to property or from legal liability. This is a cyclical industry, and the sector benefits when there is 'hard market', characterized by strong premium rate increases that outpace loss and cost inflation, resulting in robust underwriting margins. The opposite is true in a 'soft market'. Interest rates also matter, as they determine the yields earned on fixed-income portfolios. On the other hand, P&C insurers face a major secular headwind from the increasing frequency and severity of catastrophe losses due to climate change. Furthermore, the liability side of the business is pressured by 'social inflation'—the trend of rising litigation costs and larger jury awards.
Travelers competes with other major property and casualty insurers including Chubb (NYSE:CB), The Hartford (NYSE:HIG), Progressive (NYSE:PGR), Allstate (NYSE:ALL), and American International Group (NYSE:AIG).
5. Revenue Growth
Insurance companies earn revenue from three primary sources: 1) The core insurance business itself, often called underwriting and represented in the income statement as premiums 2) Income from investing the “float” (premiums collected upfront not yet paid out as claims) in assets such as fixed-income assets and equities 3) Fees from various sources such as policy administration, annuities, or other value-added services. Luckily, Travelers’s revenue grew at a decent 8.8% compounded annual growth rate over the last five years. Its growth was slightly above the average insurance company and shows its offerings resonate with customers.
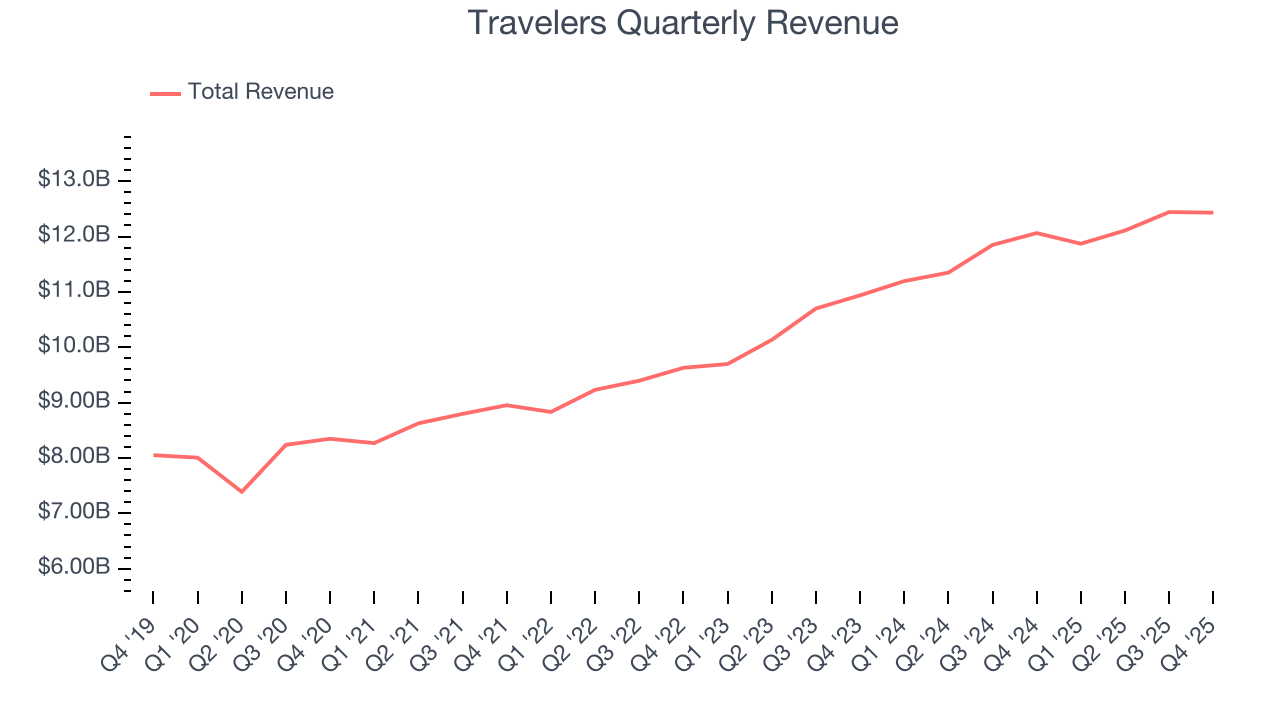
We at StockStory place the most emphasis on long-term growth, but within financials, a half-decade historical view may miss recent interest rate changes, market returns, and industry trends. Travelers’s annualized revenue growth of 8.5% over the last two years aligns with its five-year trend, suggesting its demand was stable. 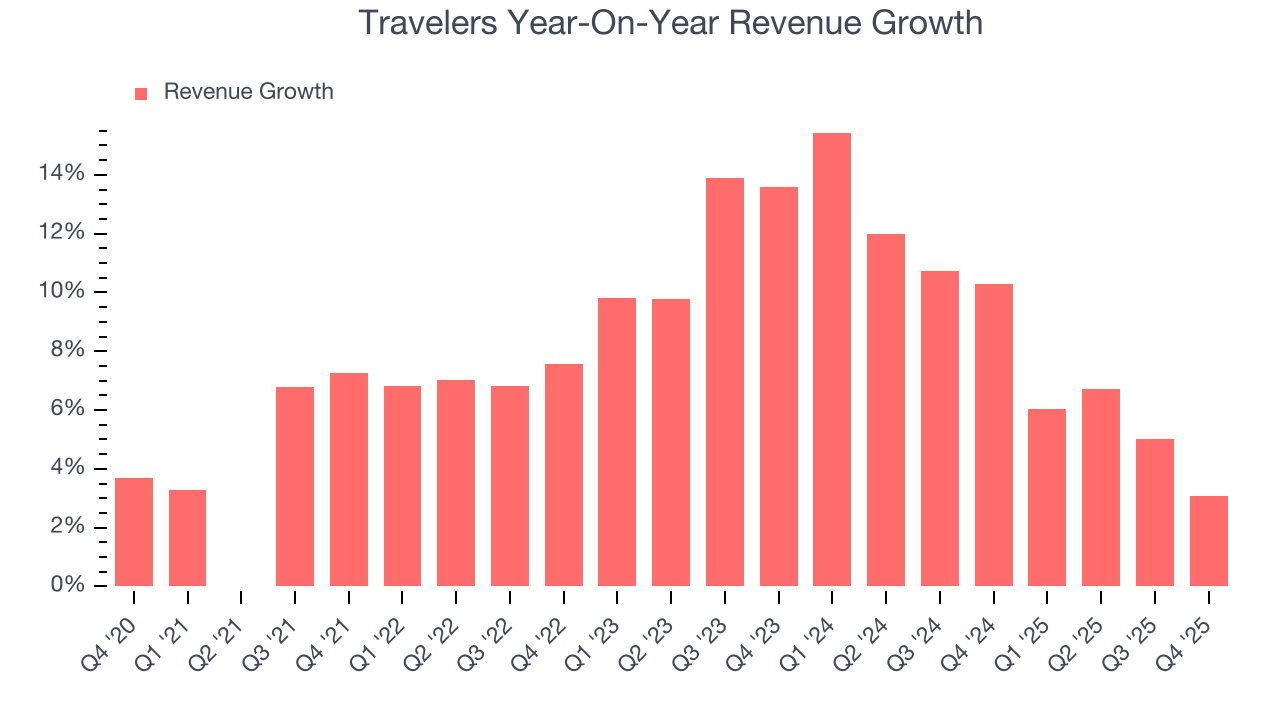 Note: Quarters not shown were determined to be outliers, impacted by outsized investment gains/losses that are not indicative of the recurring fundamentals of the business.
This quarter, Travelers grew its revenue by 3.1% year on year, and its $12.43 billion of revenue was in line with Wall Street’s estimates.
Net premiums earned made up 90.3% of the company’s total revenue during the last five years, meaning Travelers lives and dies by its underwriting activities because non-insurance operations barely move the needle.
Markets consistently prioritize net premiums earned growth over investment and fee income, recognizing its superior quality as a core indicator of the company’s underwriting success and market penetration.
6. Net Premiums Earned
When insurers sell policies, they protect themselves from extremely large losses or an outsized accumulation of losses with reinsurance (insurance for insurance companies). Net premiums earned are:
- Gross premiums - what’s ceded to reinsurers as a risk mitigation and transfer strategy
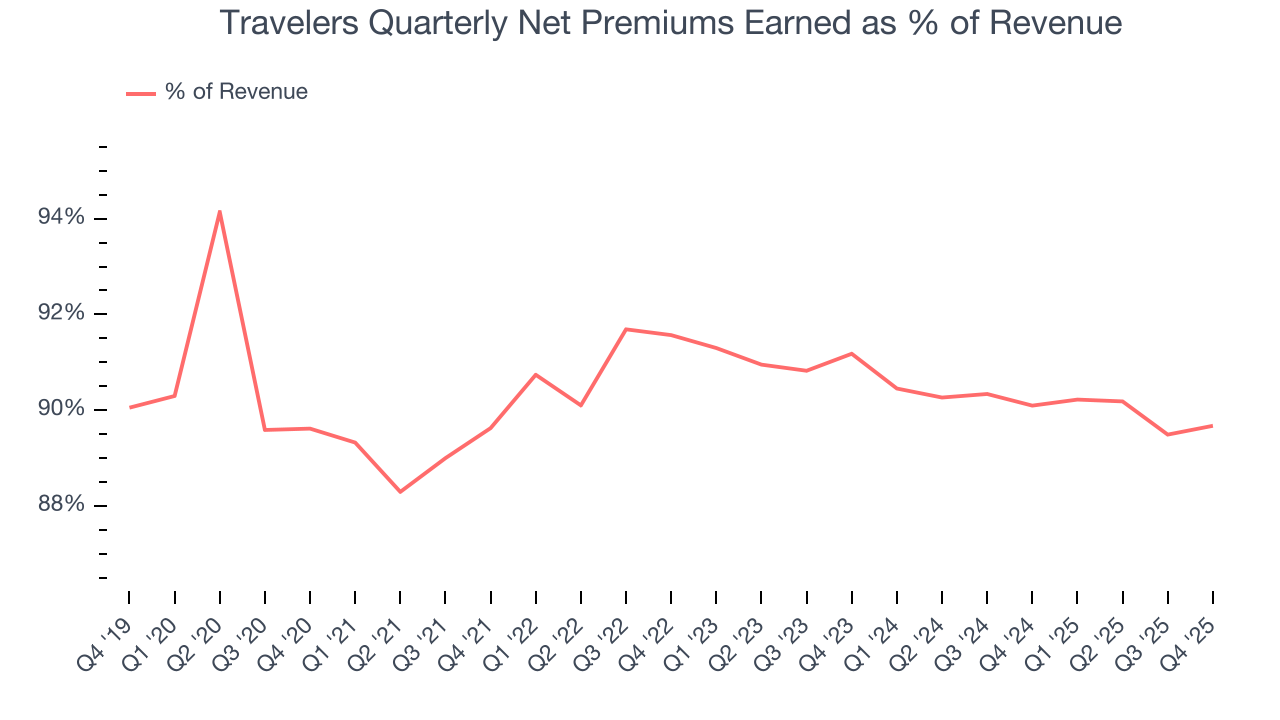
Travelers’s net premiums earned has grown at a 8.6% annualized rate over the last five years, slightly better than the broader insurance industry and in line with its total revenue.
When analyzing Travelers’s net premiums earned over the last two years, we can paint a similar picture as it recorded an annual growth rate of 7.8%. This performance was similar to its total revenue.
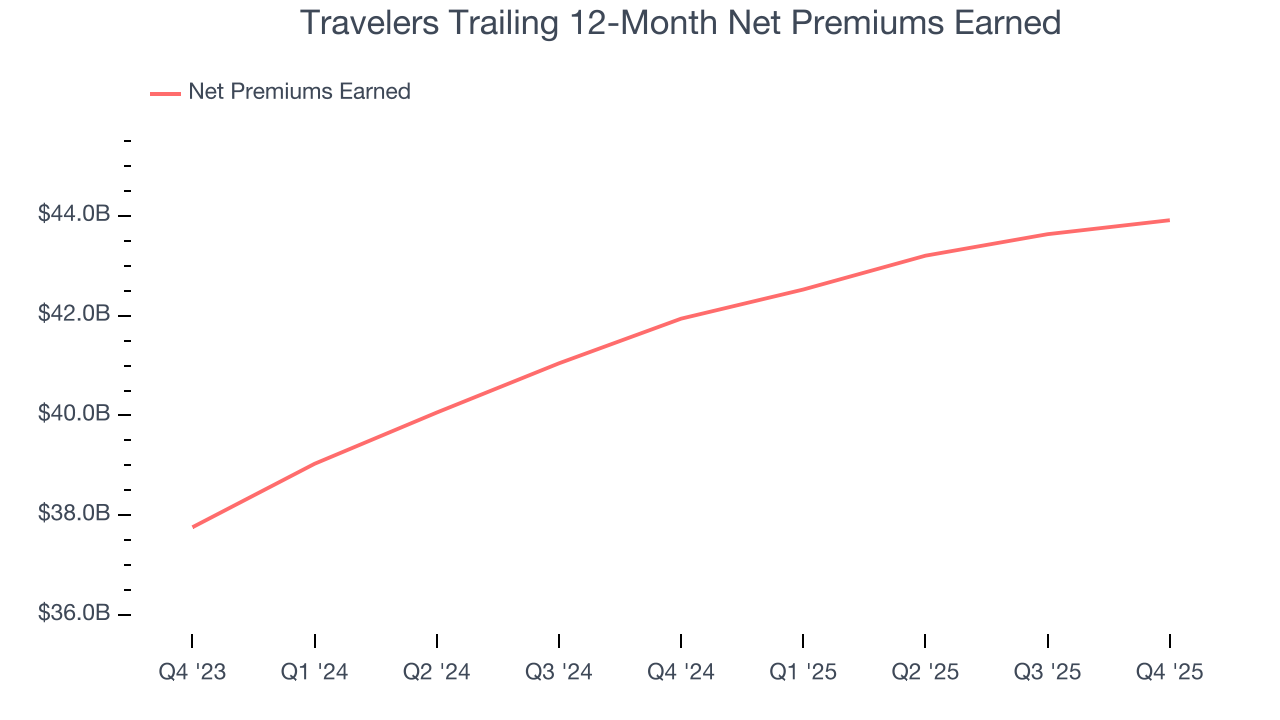
Travelers’s net premiums earned came in at $11.15 billion this quarter, up 2.6% year on year and in line with Wall Street Consensus estimates.
7. Combined Ratio
Revenue growth is one major determinant of business quality, and the efficiency of operations is another. For insurance companies, we look at the combined ratio rather than the operating expenses and margins that define sectors such as consumer, tech, and industrials.
Combined ratio = (costs of underwriting + what an insurer pays out in claims) / net premiums earned. If a company boasts a combined ratio under 100%, it is underwriting profitably. If above 100%, it is losing money on its core operations.
Given the calculation, a lower expense ratio is better. Over the last four years, Travelers’s combined ratio has swelled by 4.5 percentage points, going from 94.6% to 90.1%. It has also improved by 7.1 percentage points on a two-year basis, showing its expenses have consistently grown at a slower rate than revenue. This typically signals prudent management.
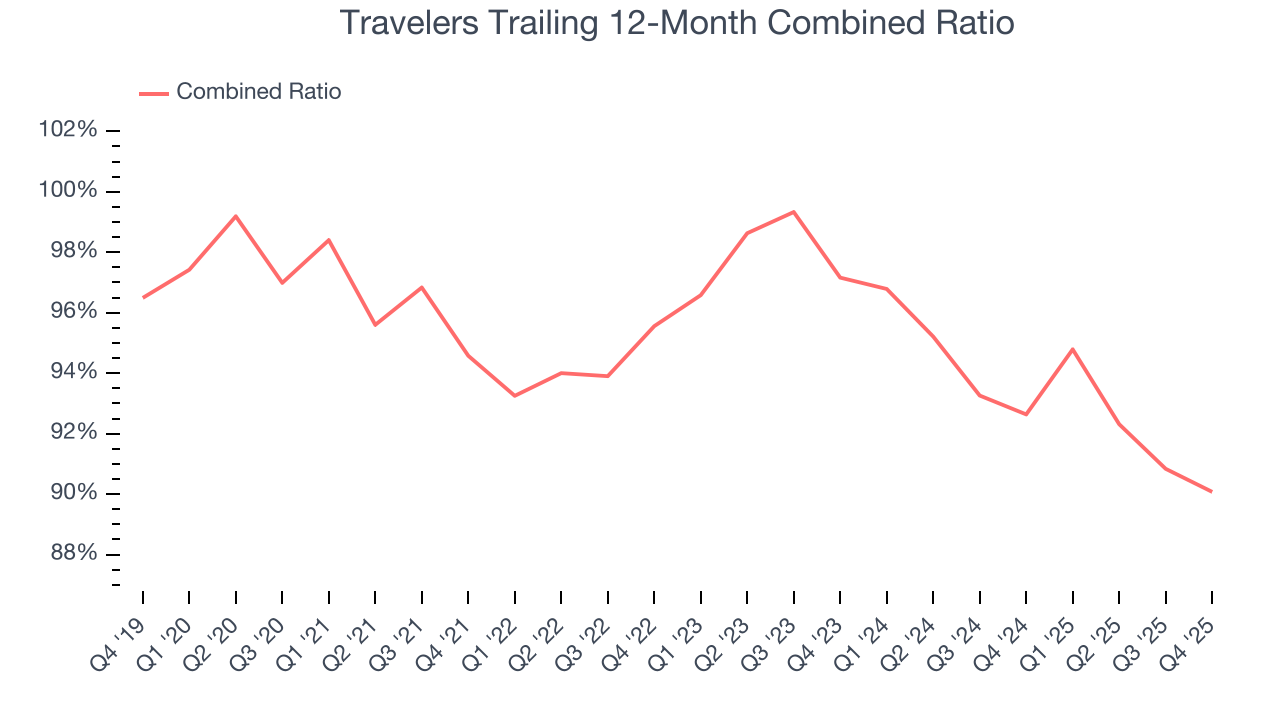
In Q4, Travelers’s combined ratio was 80.2%, beating analysts’ expectations by 602.7 basis points (100 basis points = 1 percentage point). This result was 3 percentage points better than the same quarter last year.
8. Earnings Per Share
We track the long-term change in earnings per share (EPS) for the same reason as long-term revenue growth. Compared to revenue, however, EPS highlights whether a company’s growth is profitable.
Travelers’s EPS grew at a spectacular 21.5% compounded annual growth rate over the last five years, higher than its 8.8% annualized revenue growth. However, this alone doesn’t tell us much about its business quality because its combined ratio didn’t improve.
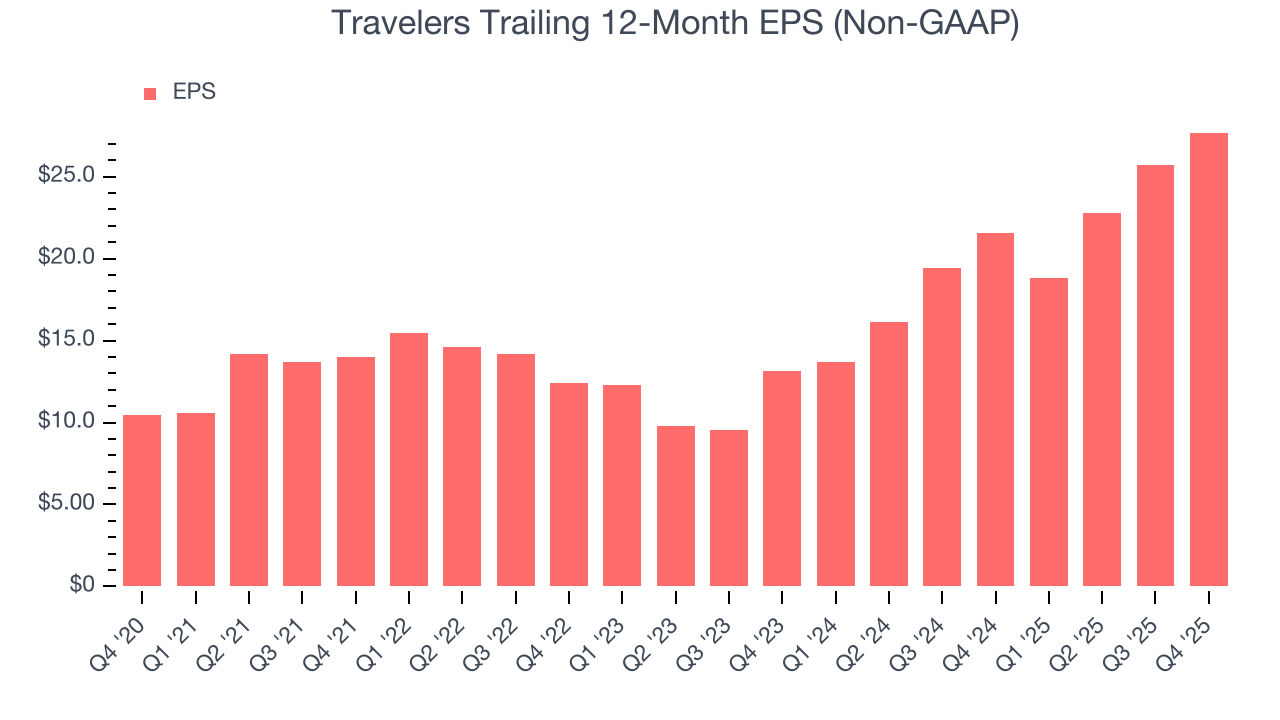
Like with revenue, we analyze EPS over a more recent period because it can provide insight into an emerging theme or development for the business.
For Travelers, its two-year annual EPS growth of 45.2% was higher than its five-year trend. We love it when earnings growth accelerates, especially when it accelerates off an already high base.
In Q4, Travelers reported adjusted EPS of $11.13, up from $9.15 in the same quarter last year. This print easily cleared analysts’ estimates, and shareholders should be content with the results. Over the next 12 months, Wall Street expects Travelers’s full-year EPS of $27.69 to shrink by 2.8%.
9. Book Value Per Share (BVPS)
Insurance companies are balance sheet businesses, collecting premiums upfront and paying out claims over time. The float–premiums collected but not yet paid out–are invested, creating an asset base supported by a liability structure. Book value per share (BVPS) captures this dynamic by measuring these assets (investment portfolio, cash, reinsurance recoverables) less liabilities (claim reserves, debt, future policy benefits). BVPS is essentially the residual value for shareholders.
We therefore consider BVPS very important to track for insurers and a metric that sheds light on business quality. While other (and more commonly known) per-share metrics like EPS can sometimes be lumpy due to reserve releases or one-time items and can be managed or skewed while still following accounting rules, BVPS reflects long-term capital growth and is harder to manipulate.
Travelers’s BVPS grew at a tepid 5.5% annual clip over the last five years. However, BVPS growth has accelerated recently, growing by 17.7% annually over the last two years from $109.21 to $151.21 per share.
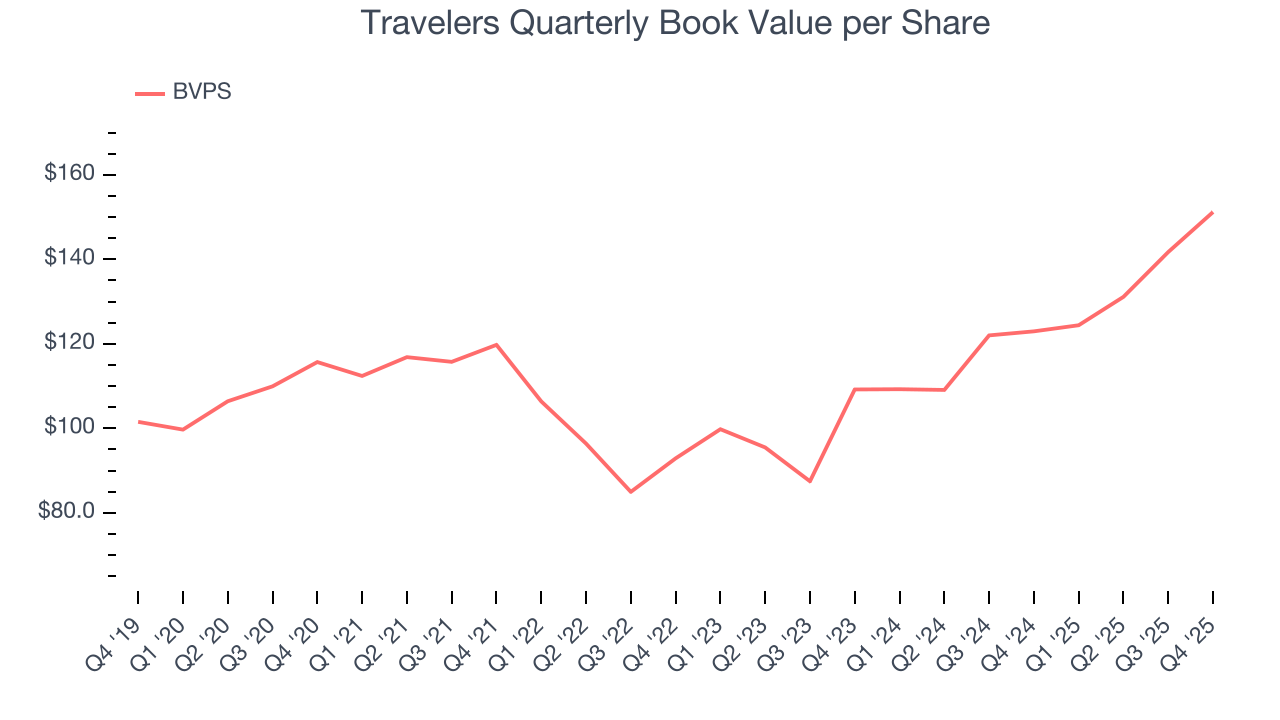
Over the next 12 months, Consensus estimates call for Travelers’s BVPS to grow by 20.7% to $161.48, elite growth rate.
10. Balance Sheet Assessment
The debt-to-equity ratio is a widely used measure to assess a company's balance sheet health. A higher ratio means that a business aggressively financed its growth with debt. This can result in higher earnings (if the borrowed funds are invested profitably) but also increases risk.
If debt levels are too high, there could be difficulties in meeting obligations, especially during economic downturns or periods of rising interest rates if the debt has variable-rate payments.
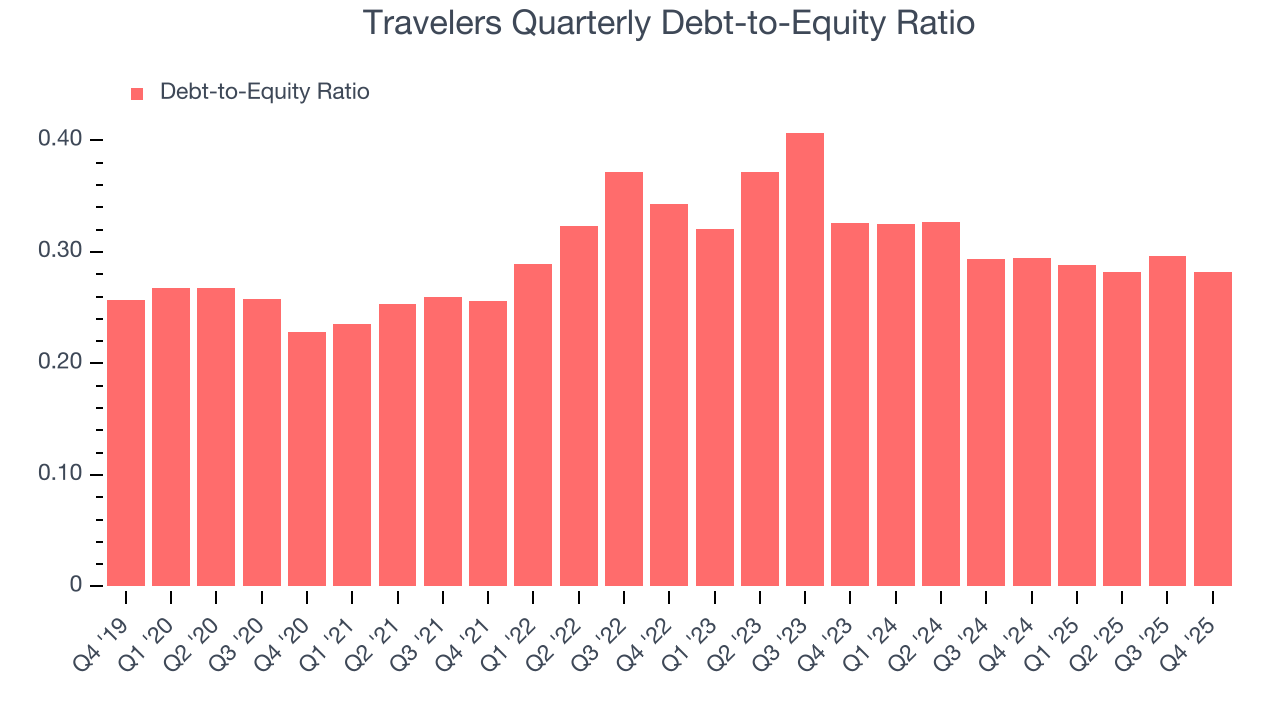
Travelers currently has $9.27 billion of debt and $32.89 billion of shareholder's equity on its balance sheet, and over the past four quarters, has averaged a debt-to-equity ratio of 0.3×. We think this is safe and raises no red flags. In general, we’re comfortable with any ratio below 1.0× for an insurance business. Anything below 0.5× is a bonus.
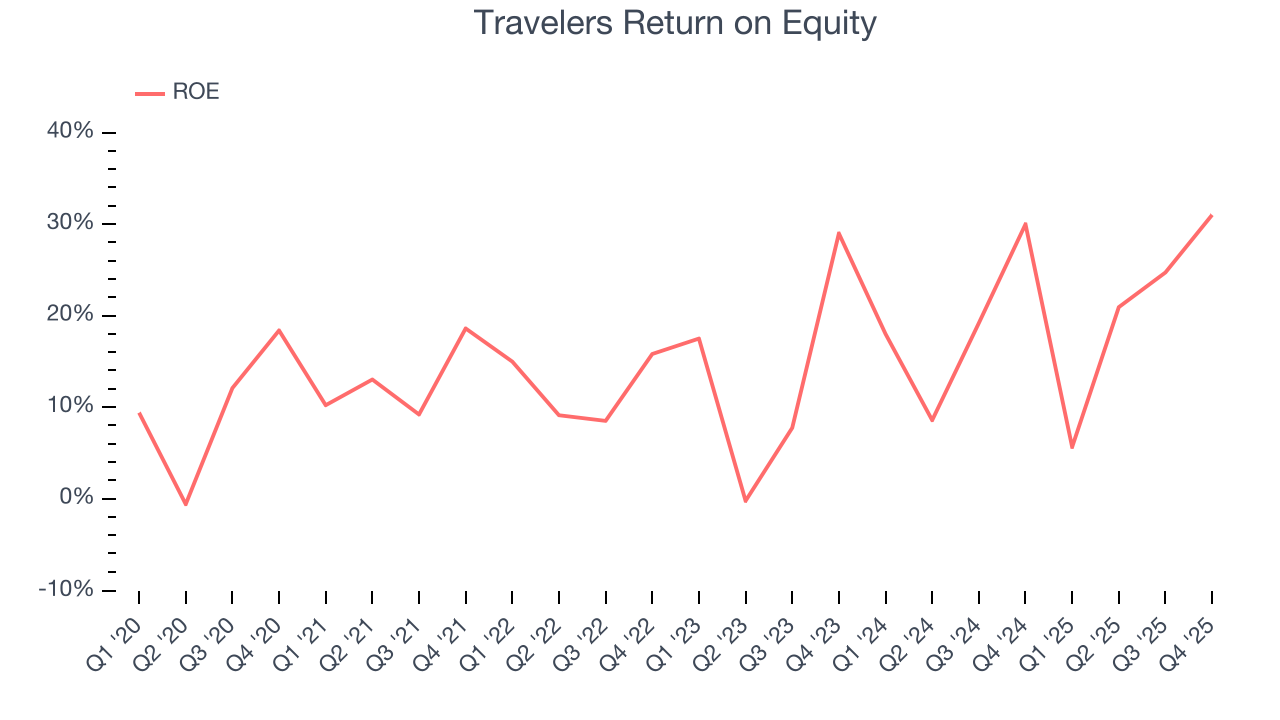
11. Return on Equity
Return on equity (ROE) is a crucial yardstick for insurance companies, measuring their ability to generate returns on the capital provided by shareholders. Insurers that consistently deliver superior ROE tend to create more value for their investors over time through strategic capital allocation and shareholder-friendly policies.
Over the last five years, Travelers has averaged an ROE of 15.6%, impressive for a company operating in a sector where the average shakes out around 12.5% and those putting up 20%+ are greatly admired. This shows Travelers has a strong competitive moat.
12. Key Takeaways from Travelers’s Q4 Results
It was good to see Travelers beat analysts’ EPS expectations this quarter. We were also happy its revenue was in line with Wall Street’s estimates. On the other hand, its book value per share missed. Overall, this print had some key positives. The stock traded up 1.8% to $274.40 immediately following the results.
13. Is Now The Time To Buy Travelers?
Updated: January 25, 2026 at 11:40 PM EST
When considering an investment in Travelers, investors should account for its valuation and business qualities as well as what’s happened in the latest quarter.
In our opinion, Travelers is a good company. To kick things off, its revenue growth was good over the last five years. And while its projected EPS for the next year is lacking, its estimated BVPS growth for the next 12 months is great. On top of that, its spectacular EPS growth over the last five years shows its profits are trickling down to shareholders.
Travelers’s P/B ratio based on the next 12 months is 1.6x. Looking at the insurance landscape right now, Travelers trades at a pretty interesting price. If you believe in the company and its growth potential, now is an opportune time to buy shares.
Wall Street analysts have a consensus one-year price target of $298.45 on the company (compared to the current share price of $277.91), implying they see 7.4% upside in buying Travelers in the short term.