
Uber (UBER)
Uber is intriguing. It’s not only a cash cow but also has increased its profitability, showing its fundamentals are improving.― StockStory Analyst Team
1. News


2. Summary
Why Uber Is Interesting
Notoriously funded with $7.7 billion from the Softbank Vision Fund, Uber (NYSE:UBER) operates a platform of on-demand services such as ride-hailing, food delivery, and freight.
- Monthly Active Platform Consumers have grown by 15.1% annually, allowing for more profitable cross-selling opportunities if it can build complementary products and features
- Incremental sales over the last three years have been highly profitable as its earnings per share increased by 130% annually, topping its revenue gains
- A downside is its high servicing costs result in an inferior gross margin of 38% that must be offset through higher volumes


Uber has the potential to be a high-quality business. This is a good stock to keep your eye on.
Why Should You Watch Uber


Uber’s stock price of $73 implies a valuation ratio of 14.3x forward EV/EBITDA. Uber’s valuation is around the peer average across the sector.
For now, this is a stock we’ll keep an eye on rather than one we’ll recommend you buy. We prefer owning businesses with better fundamentals that trade at similar multiples.
3. Uber (UBER) Research Report: Q4 CY2025 Update
Ride sharing and on-demand delivery platform Uber (NYSE:UBER) met Wall Streets revenue expectations in Q4 CY2025, with sales up 20.1% year on year to $14.37 billion. Its non-GAAP profit of $0.71 per share was 11% below analysts’ consensus estimates.
Uber (UBER) Q4 CY2025 Highlights:
- Revenue: $14.37 billion vs analyst estimates of $14.34 billion (20.1% year-on-year growth, in line)
- Adjusted EPS: $0.71 vs analyst expectations of $0.80 (11% miss)
- Adjusted EBITDA: $2.49 billion vs analyst estimates of $2.47 billion (17.3% margin, 0.5% beat)
- Operating Margin: 12.3%, up from 6.4% in the same quarter last year
- Free Cash Flow Margin: 19.5%, up from 16.6% in the previous quarter
- Monthly Active Platform Consumers: 202 million, up 31 million year on year
- Market Capitalization: $161.9 billion
Company Overview
Notoriously funded with $7.7 billion from the Softbank Vision Fund, Uber (NYSE:UBER) operates a platform of on-demand services such as ride-hailing, food delivery, and freight.
Uber pioneered the online ride hailing model, allowing users to summon taxi’s via their mobile devices, an innovation that disrupted modern transportation. The company next expanded into food delivery with UberEats, and has grown a trucking brokerage business, Uber Freight. It is the largest global ride sharing network, with majority market share in the most countries it operates in.
The company’s value propositions are multiple. For individuals, Uber effectively lowered the cost per mile for taxi transportation vs. legacy cabs, while providing ease of use and convenience. For drivers, it has provided flexible earning opportunities. While for restaurants and merchants, Uber’s platform has allowed them to expand their consumer reach, and provided an online presence.
4. Gig Economy
The iPhone changed the world, ushering in the era of the “always-on” internet and “on-demand” services - anything someone could want is just a few taps away. Likewise, the gig economy sprang up in a similar fashion, with a proliferation of tech-enabled freelance labor marketplaces, which work hand and hand with many on demand services. Individuals can now work on demand too. What began with tech-enabled platforms that aggregated riders and drivers has expanded over the past decade to include food delivery, groceries, and now even a plumber or graphic designer are all just a few taps away.
Uber competes with rival Lyft (NASDAQ:LYFT) in ride-hailing. In other verticals, rivals include DoorDash (NYSE:DASH), Delivery Hero (XTRA:DHER), and Deliveroo (LSE:ROO).
5. Revenue Growth
A company’s long-term sales performance is one signal of its overall quality. Any business can put up a good quarter or two, but the best consistently grow over the long haul. Luckily, Uber’s sales grew at a solid 17.7% compounded annual growth rate over the last three years. Its growth beat the average consumer internet company and shows its offerings resonate with customers, a helpful starting point for our analysis.
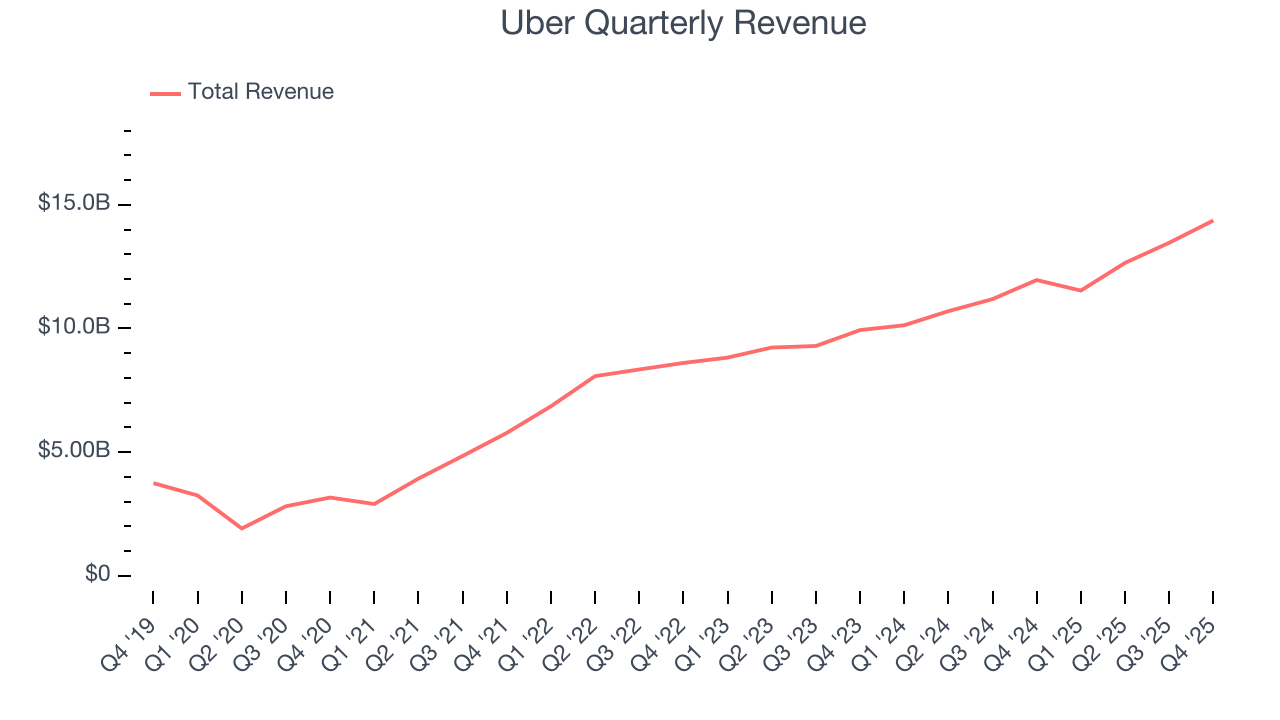
This quarter, Uber’s year-on-year revenue growth of 20.1% was excellent, and its $14.37 billion of revenue was in line with Wall Street’s estimates.
Looking ahead, sell-side analysts expect revenue to grow 16.7% over the next 12 months, similar to its three-year rate. We still think its growth trajectory is attractive given its scale and suggests the market is forecasting success for its products and services.
6. Monthly Active Platform Consumers
User Growth
As a gig economy marketplace, Uber generates revenue growth by expanding the number of services on its platform (e.g. rides, deliveries, freelance jobs) and raising the commission fee from each service provided.
Over the last two years, Uber’s monthly active platform consumers, a key performance metric for the company, increased by 15.1% annually to 202 million in the latest quarter. This growth rate is among the fastest of any consumer internet business and indicates its offerings have significant traction. 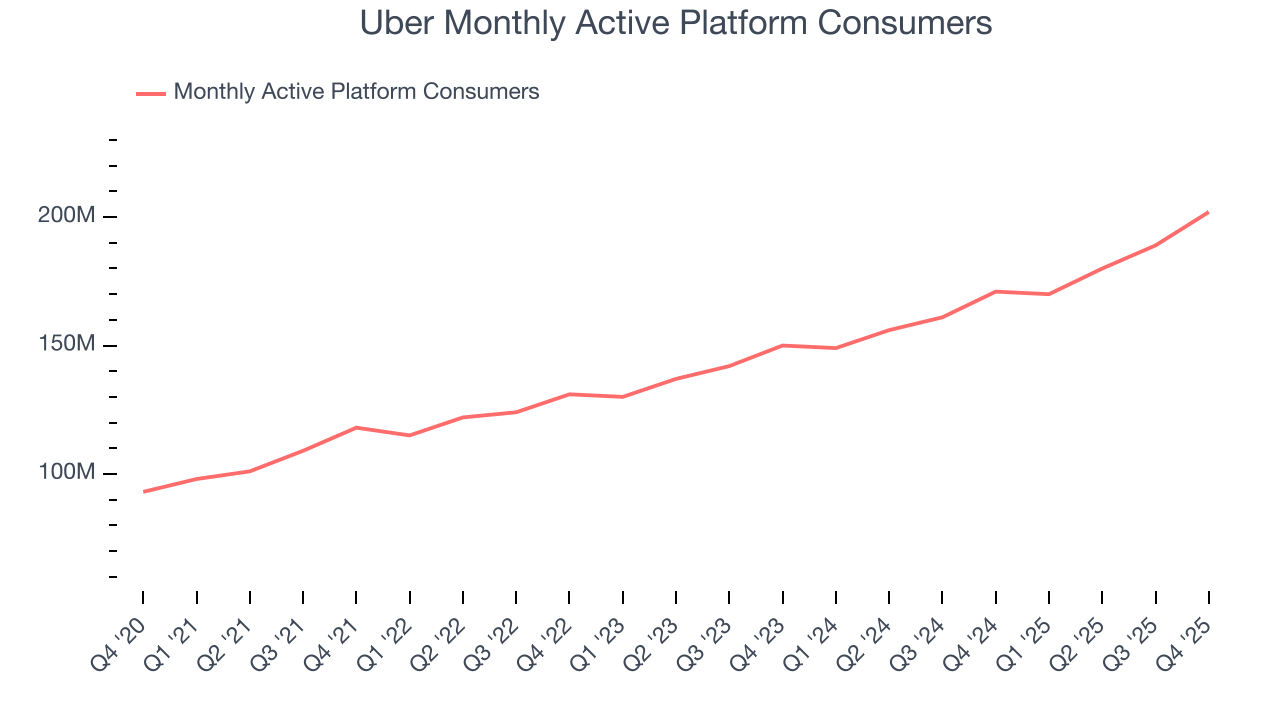
In Q4, Uber added 31 million monthly active platform consumers, leading to 18.1% year-on-year growth. The quarterly print was higher than its two-year result, suggesting its new initiatives are accelerating user growth.
Revenue Per User
Average revenue per user (ARPU) is a critical metric to track because it measures how much the company earns in transaction fees from each user. This number also informs us about Uber’s take rate, which represents its pricing leverage over the ecosystem, or "cut" from each transaction.
Uber’s ARPU growth has been subpar over the last two years, averaging 2.5%. This isn’t great, but the increase in monthly active platform consumers is more relevant for assessing long-term business potential. We’ll monitor the situation closely; if Uber tries boosting ARPU by taking a more aggressive approach to monetization, it’s unclear whether users can continue growing at the current pace. 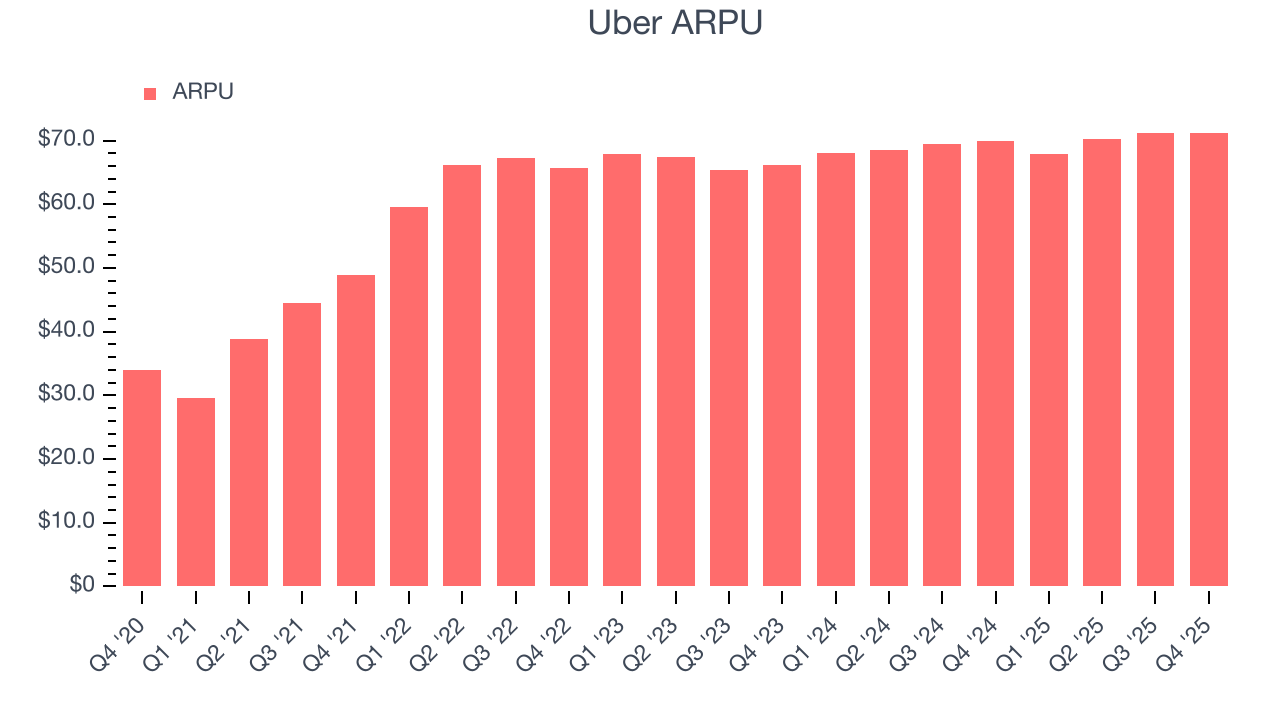
This quarter, Uber’s ARPU clocked in at $71.12. It grew by 1.7% year on year, slower than its user growth.
7. Gross Margin & Pricing Power
For gig economy businesses like Uber, gross profit tells us how much money the company gets to keep after covering the base cost of its products and services, which typically include server hosting, customer support, and payment processing fees. Another cost of revenue could also be insurance to protect against liabilities arising from providing transportation, housing, or freelance work services.
Uber’s unit economics are far below other consumer internet companies, signaling it operates in a competitive market and must pay many third parties a slice of its sales to distribute its products and services. As you can see below, it averaged a 34.6% gross margin over the last two years. Said differently, Uber had to pay a chunky $65.44 to its service providers for every $100 in revenue. 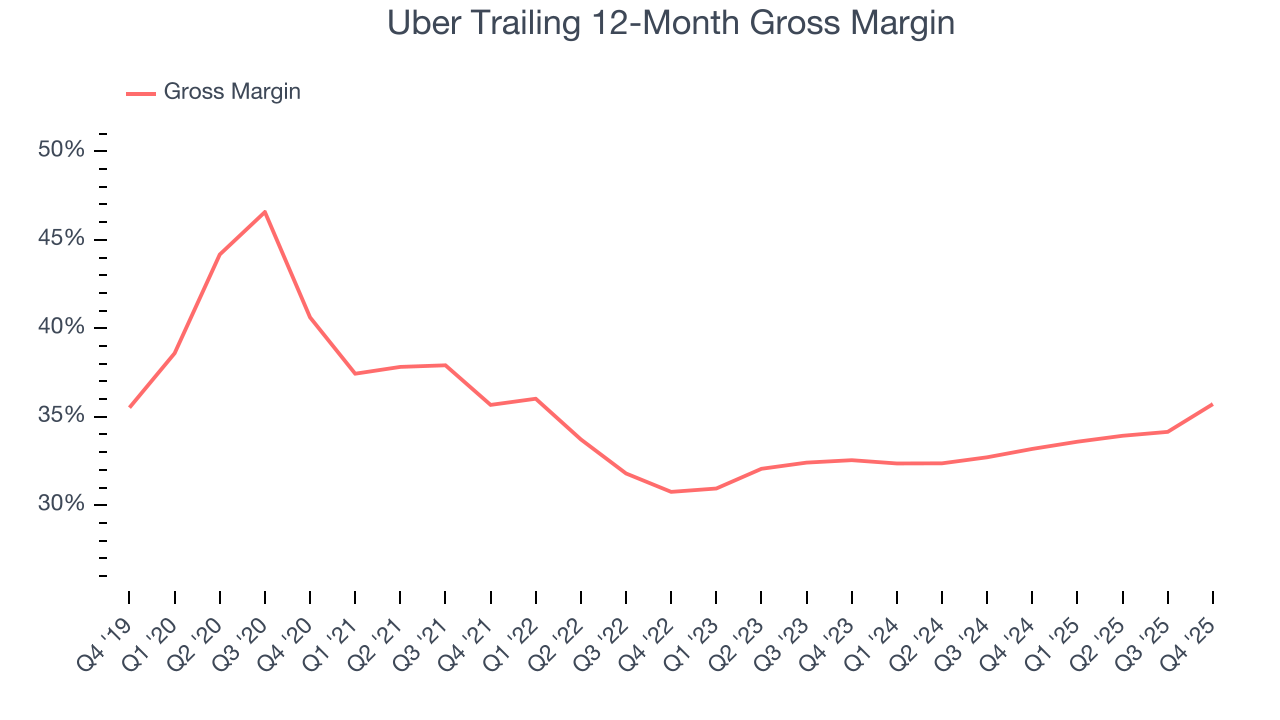
This quarter, Uber’s gross profit margin was 39.6%, marking a 5.7 percentage point increase from 33.8% in the same quarter last year. Uber’s full-year margin has also been trending up over the past 12 months, increasing by 2.5 percentage points. If this move continues, it could suggest better unit economics due to more leverage from its growing sales on the fixed portion of its cost of goods sold (such as servers).
8. User Acquisition Efficiency
Consumer internet businesses like Uber grow from a combination of product virality, paid advertisement, and incentives (unlike enterprise software products, which are often sold by dedicated sales teams).
Uber is very efficient at acquiring new users, spending only 26.6% of its gross profit on sales and marketing expenses over the last year. This efficiency indicates that it has a highly differentiated product offering and strong brand reputation from scale, giving Uber the freedom to invest its resources into new growth initiatives while maintaining optionality. 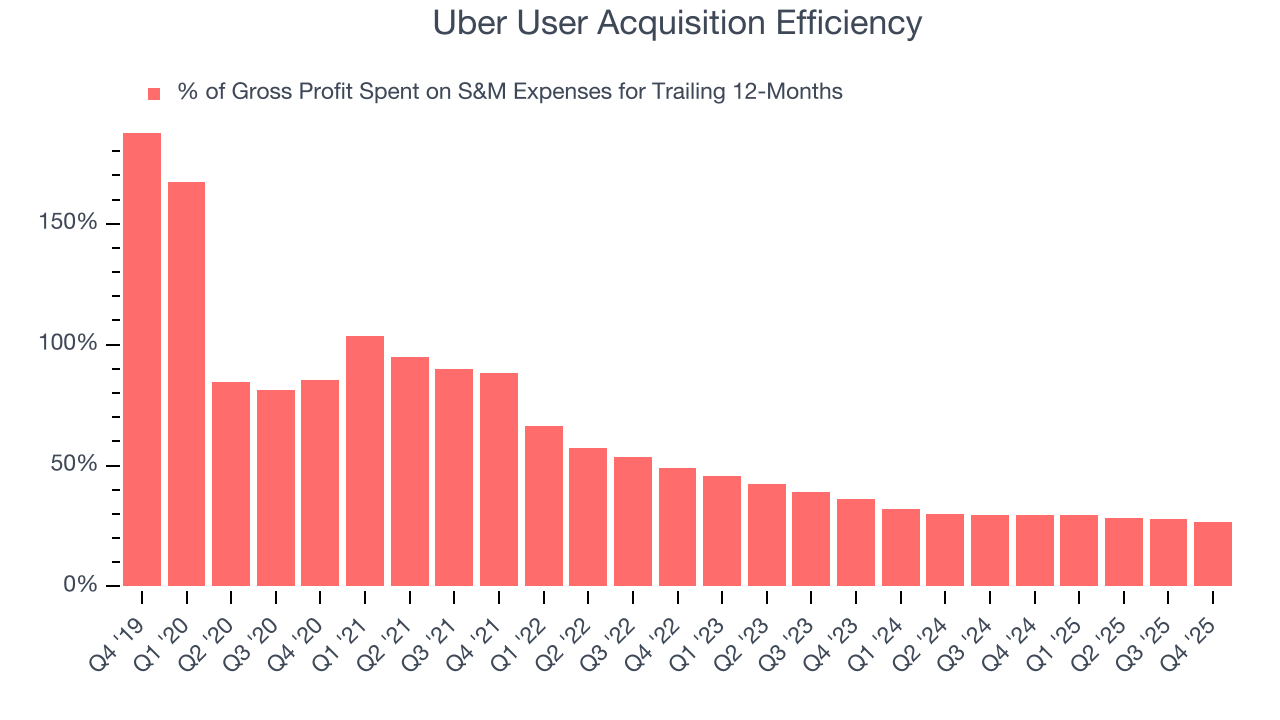
9. EBITDA
Operating income is often evaluated to assess a company’s underlying profitability. In a similar vein, EBITDA is used to analyze consumer internet companies because it excludes various one-time or non-cash expenses (depreciation), providing a clearer view of the business’s profit potential.
Uber has been an efficient company over the last two years. It was one of the more profitable businesses in the consumer internet sector, boasting an average EBITDA margin of 15.8%. This result was particularly impressive because of its low gross margin, which is mostly a factor of what it sells and takes huge shifts to move meaningfully. Companies have more control over their operating margins, and it’s a show of well-managed operations if they’re high when gross margins are low.
Looking at the trend in its profitability, Uber’s EBITDA margin rose by 11.4 percentage points over the last few years, as its sales growth gave it operating leverage.
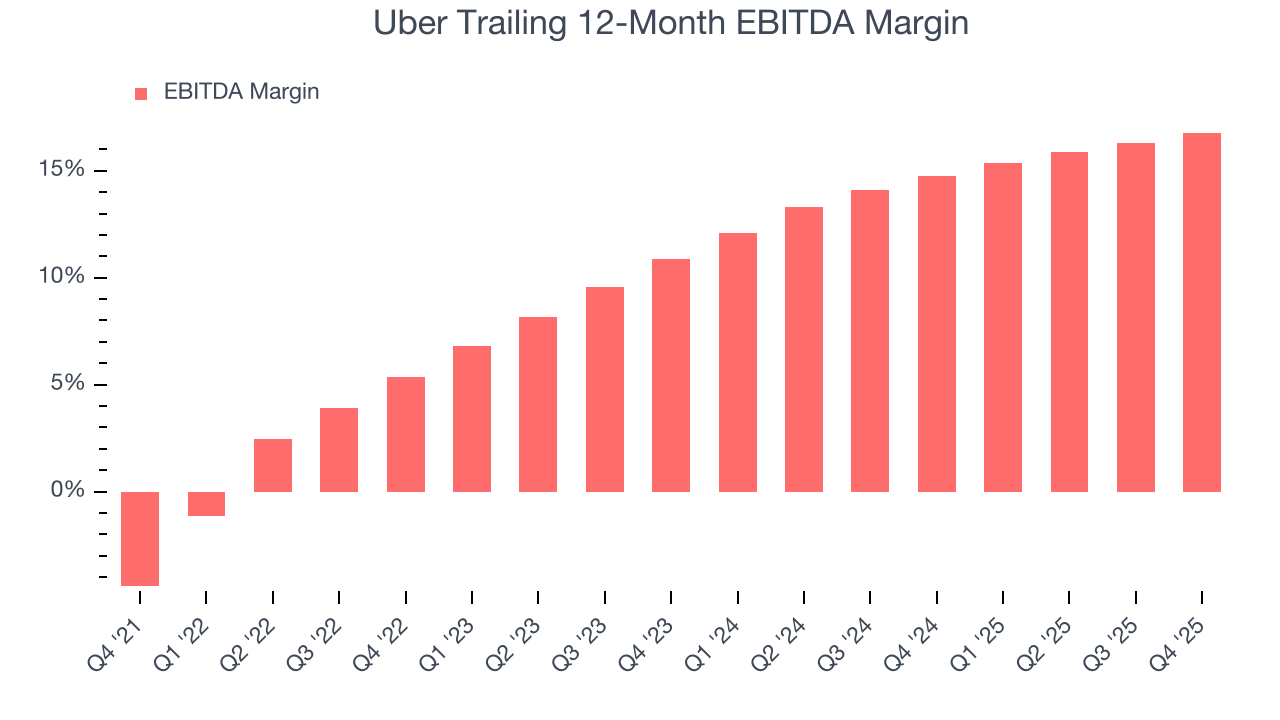
This quarter, Uber generated an EBITDA margin profit margin of 17.3%, up 1.9 percentage points year on year. Since its gross margin expanded more than its EBITDA margin, we can infer that leverage on its cost of sales was the primary driver behind the recently higher efficiency.
10. Earnings Per Share
Revenue trends explain a company’s historical growth, but the long-term change in earnings per share (EPS) points to the profitability of that growth – for example, a company could inflate its sales through excessive spending on advertising and promotions.
Uber’s EPS grew at an astounding 130% compounded annual growth rate over the last three years, higher than its 17.7% annualized revenue growth. This tells us the company became more profitable on a per-share basis as it expanded.
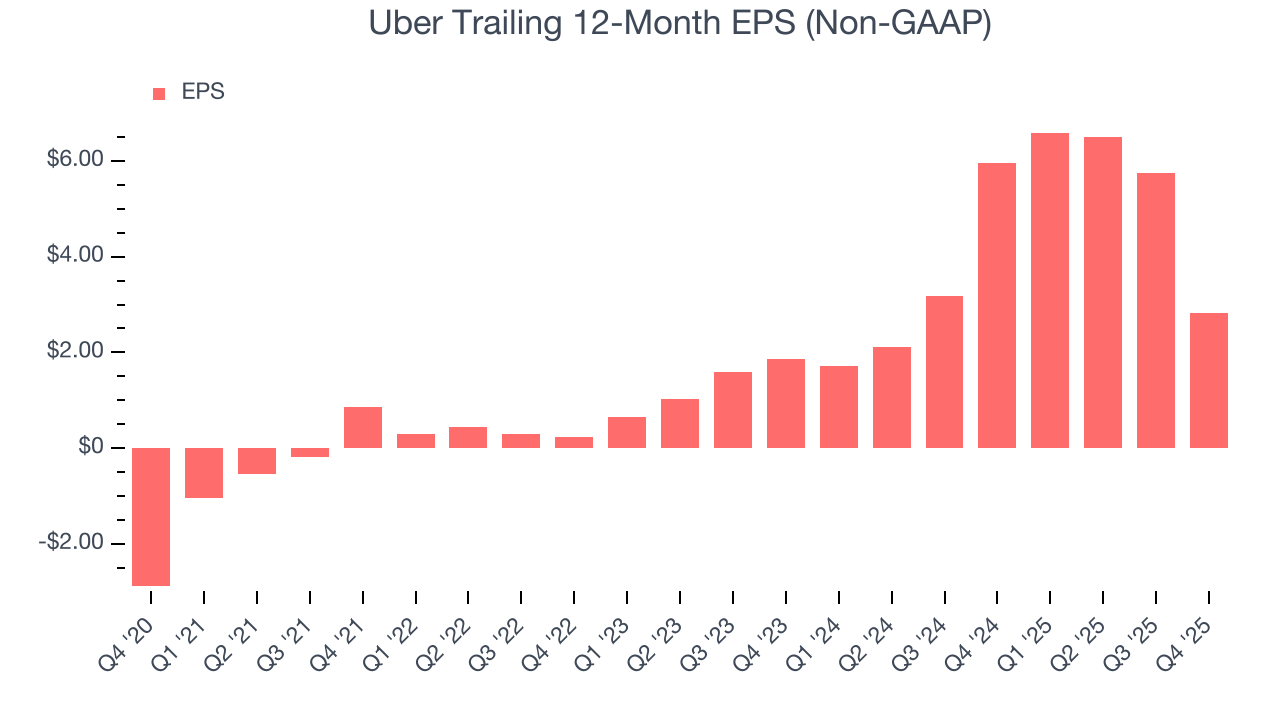
We can take a deeper look into Uber’s earnings quality to better understand the drivers of its performance. As we mentioned earlier, Uber’s EBITDA margin expanded by 11.4 percentage points over the last three years. This was the most relevant factor (aside from the revenue impact) behind its higher earnings; interest expenses and taxes can also affect EPS but don’t tell us as much about a company’s fundamentals.
In Q4, Uber reported adjusted EPS of $0.71, down from $3.64 in the same quarter last year. This print missed analysts’ estimates, but we care more about long-term adjusted EPS growth than short-term movements. Over the next 12 months, Wall Street expects Uber’s full-year EPS of $2.82 to grow 29.2%.
11. Cash Is King
Free cash flow isn't a prominently featured metric in company financials and earnings releases, but we think it's telling because it accounts for all operating and capital expenses, making it tough to manipulate. Cash is king.
Uber has shown robust cash profitability, driven by its cost-effective customer acquisition strategy that enables it to invest in new products and services rather than sales and marketing. The company’s free cash flow margin averaged 17.4% over the last two years, quite impressive for a consumer internet business.
Taking a step back, we can see that Uber’s margin expanded by 17.5 percentage points over the last few years. This is encouraging, and we can see it became a less capital-intensive business because its free cash flow profitability rose more than its operating profitability.
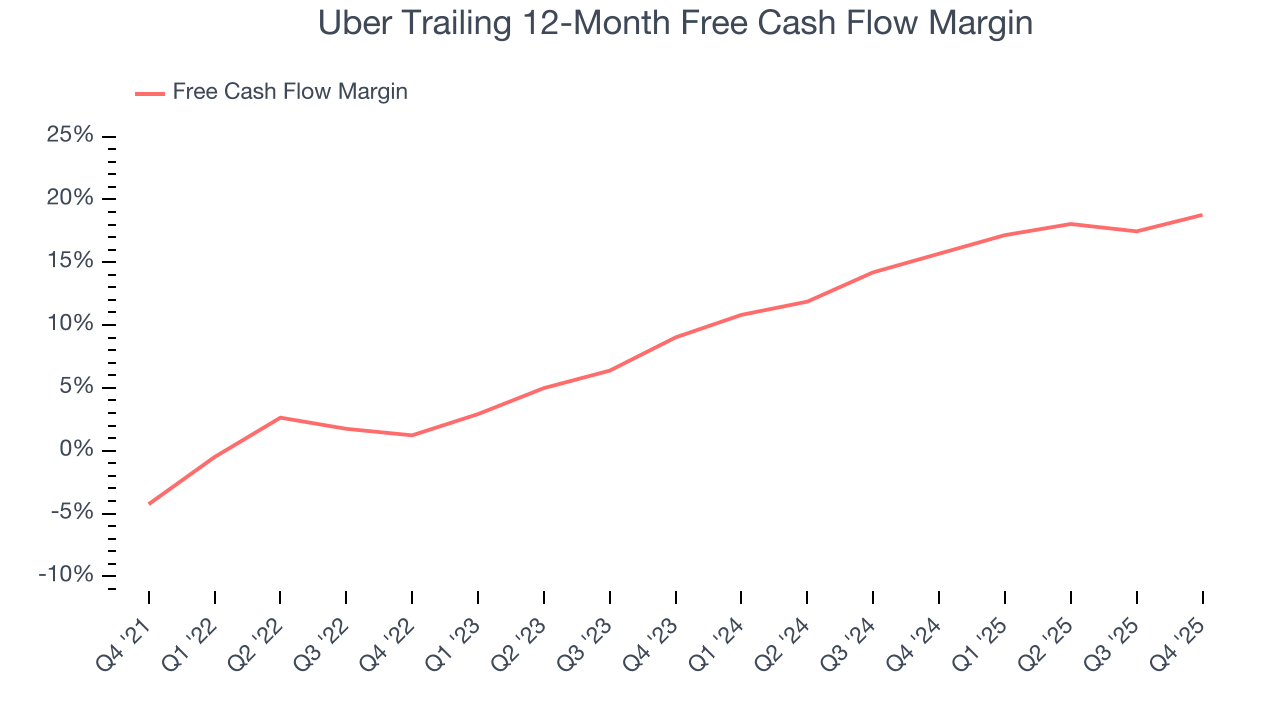
Uber’s free cash flow clocked in at $2.81 billion in Q4, equivalent to a 19.5% margin. This result was good as its margin was 5.3 percentage points higher than in the same quarter last year, building on its favorable historical trend.
12. Balance Sheet Assessment
Uber reported $8.26 billion of cash and $12.08 billion of debt on its balance sheet in the most recent quarter. As investors in high-quality companies, we primarily focus on two things: 1) that a company’s debt level isn’t too high and 2) that its interest payments are not excessively burdening the business.
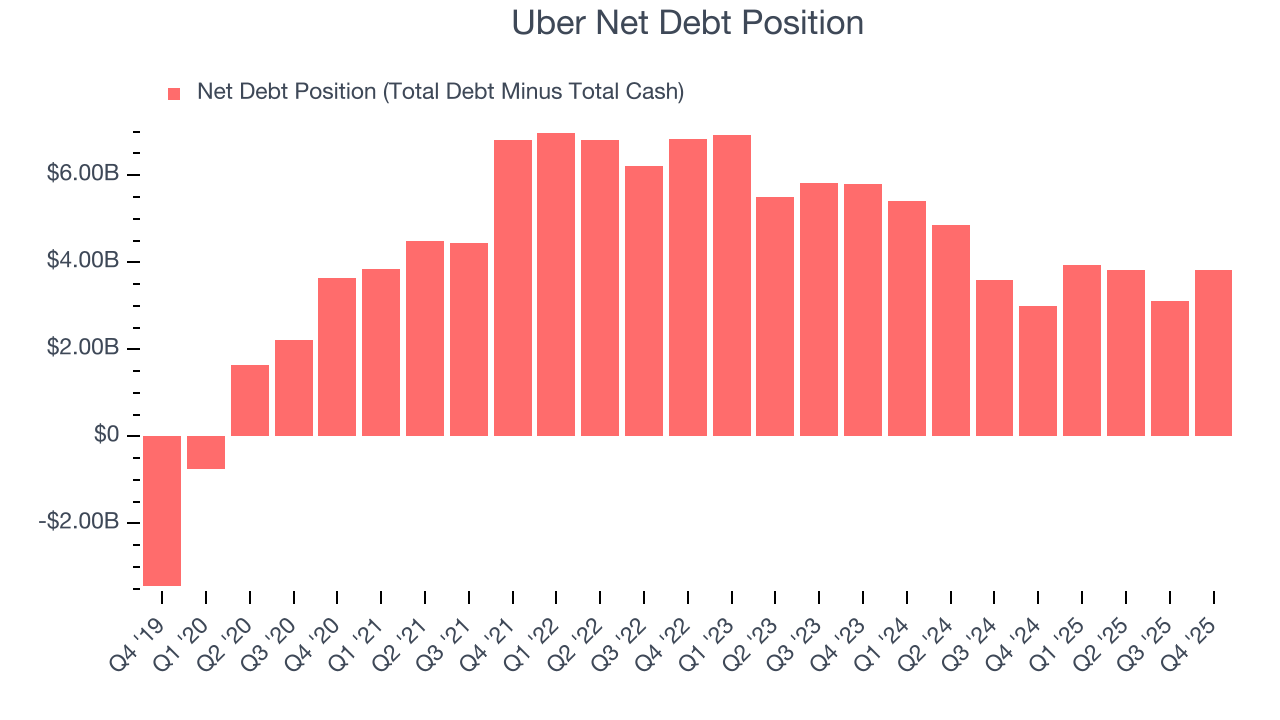
With $8.73 billion of EBITDA over the last 12 months, we view Uber’s 0.4× net-debt-to-EBITDA ratio as safe. We also see its $133 million of annual interest expenses as appropriate. The company’s profits give it plenty of breathing room, allowing it to continue investing in growth initiatives.
13. Key Takeaways from Uber’s Q4 Results
It was great to see Uber increase its number of users this quarter. We were also happy its number of monthly active platform consumers outperformed Wall Street’s estimates. On the other hand, revenue and EBITDA were both just roughly in line. The market seemed to be hoping for more, and the stock traded down 8.8% to $71.08 immediately following the results.
14. Is Now The Time To Buy Uber?
Updated: March 24, 2026 at 10:14 PM EDT
Before making an investment decision, investors should account for Uber’s business fundamentals and valuation in addition to what happened in the latest quarter.
Uber possesses a number of positive attributes. First off, its revenue growth was solid over the last three years. And while its gross margins make it extremely difficult to reach positive operating profits compared to other consumer internet businesses, its rising cash profitability gives it more optionality. On top of that, its EPS growth over the last three years has been fantastic.
Uber’s EV/EBITDA ratio based on the next 12 months is 14.8x. This multiple tells us that a lot of good news is priced in. Add this one to your watchlist and come back to it later.
Wall Street analysts have a consensus one-year price target of $103.68 on the company (compared to the current share price of $72.85).