Union Pacific (UNP)
Union Pacific keeps us up at night. Its weak sales growth and declining returns on capital show its demand and profits are shrinking.― StockStory Analyst Team
1. News


2. Summary
Why We Think Union Pacific Will Underperform
Part of the transcontinental railroad project, Union Pacific (NYSE:UNP) is a freight transportation company that operates a major railroad network.
- Flat sales over the last two years suggest it must find different ways to grow during this cycle
- Projected sales growth of 3.4% for the next 12 months suggests sluggish demand
- Earnings growth over the last two years fell short of the peer group average as its EPS only increased by 6.3% annually


Union Pacific doesn’t meet our quality standards. You should search for better opportunities.
Why There Are Better Opportunities Than Union Pacific


Union Pacific is trading at $241.45 per share, or 19.6x forward P/E. Union Pacific’s valuation may seem like a bargain, especially when stacked up against other industrials companies. We remind you that you often get what you pay for, though.
Our advice is to pay up for elite businesses whose advantages are tailwinds to earnings growth. Don’t get sucked into lower-quality businesses just because they seem like bargains. These mediocre businesses often never achieve a higher multiple as hoped, a phenomenon known as a “value trap”.
3. Union Pacific (UNP) Research Report: Q4 CY2025 Update
Freight transportation company Union Pacific (NYSE:UNP) fell short of the markets revenue expectations in Q4 CY2025, with sales flat year on year at $6.09 billion. Its non-GAAP profit of $2.86 per share was in line with analysts’ consensus estimates.
Union Pacific (UNP) Q4 CY2025 Highlights:
- Revenue: $6.09 billion vs analyst estimates of $6.12 billion (flat year on year, 0.5% miss)
- Adjusted EPS: $2.86 vs analyst estimates of $2.87 (in line)
- Operating Margin: 39.5%, down from 41.3% in the same quarter last year
- Free Cash Flow Margin: 20.1%, up from 15.6% in the same quarter last year
- Market Capitalization: $137 billion
Company Overview
Part of the transcontinental railroad project, Union Pacific (NYSE:UNP) is a freight transportation company that operates a major railroad network.
Union Pacific was established to connect the eastern and western United States, facilitating commerce and settlement. The company was created under the Pacific Railroad Act, signed by President Abraham Lincoln, to enhance transportation infrastructure and support economic growth. Over the years, Union Pacific has expanded its network, becoming one of the largest freight railroads in North America.
Union Pacific provides comprehensive freight transportation services, moving goods, including agricultural products, automobiles, chemicals, coal, and industrial equipment. The company addresses logistical challenges by offering reliable and efficient rail services that reduce transit times and costs for businesses.
Union Pacific's revenue is primarily generated through transportation fees for hauling freight. Its business model focuses on long-term contracts with key industries, ensuring a steady and recurring revenue stream. By leveraging its extensive rail network and strategic partnerships, Union Pacific creates unique value for customers seeking cost-effective transportation solutions.
4. Rail Transportation
The growth of e-commerce and global trade continues to drive demand for shipping services, presenting opportunities for rail transportation companies. While moving large volumes by rail can be highly cost-efficient for customers compared to air and ground transport, this mode of transportation results in slower delivery times, presenting a trade off. To improve transit times, the industry continues to invest in digitization to optimize fleets, loads, and even braking systems. However, rail transportation companies are still at the whim of economic cycles. Consumer spending, for example, can greatly impact the demand for these companies’ offerings while fuel costs can influence profit margins.
Public competitors in the rail industry include CSX Corporation (NASDAQ:CSX), Norfolk Southern (NYSE:NSC), and CPKC (NYSE:CP)
5. Revenue Growth
Reviewing a company’s long-term sales performance reveals insights into its quality. Any business can put up a good quarter or two, but many enduring ones grow for years. Unfortunately, Union Pacific’s 4.6% annualized revenue growth over the last five years was tepid. This was below our standard for the industrials sector and is a tough starting point for our analysis.
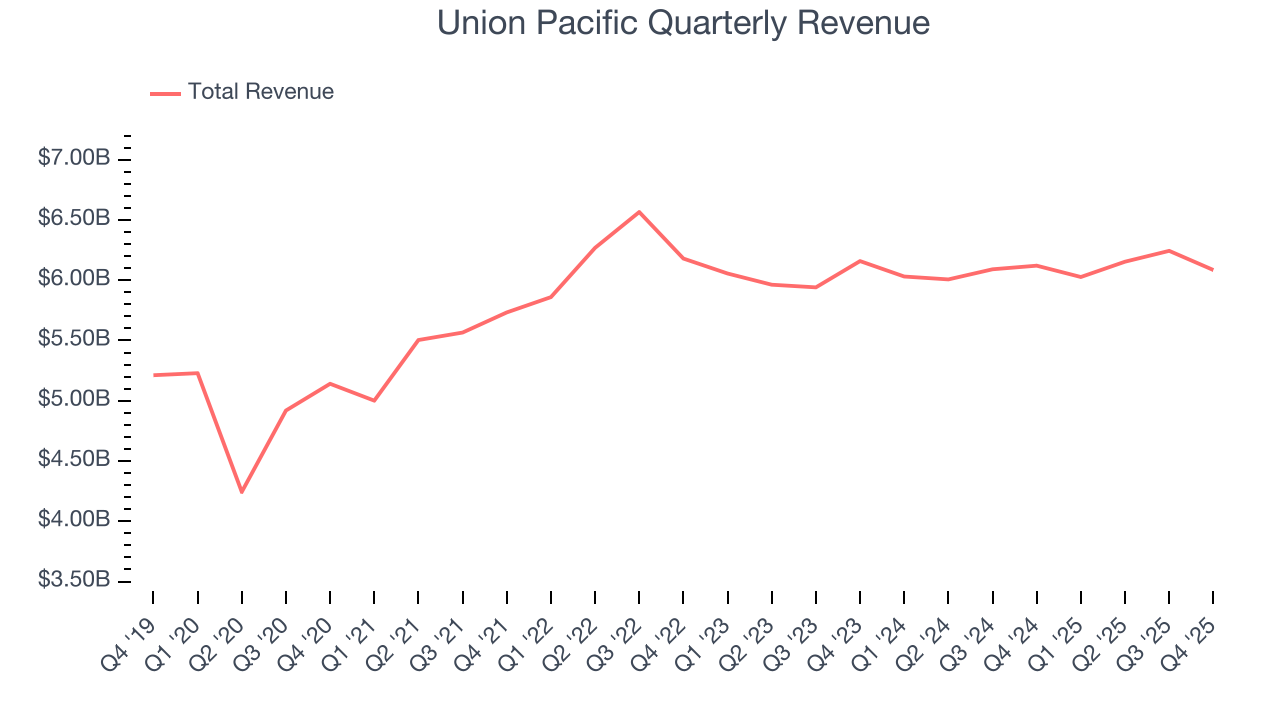
Long-term growth is the most important, but within industrials, a half-decade historical view may miss new industry trends or demand cycles. Union Pacific’s recent performance shows its demand has slowed as its revenue was flat over the last two years. We also note many other Rail Transportation businesses have faced declining sales because of cyclical headwinds. While Union Pacific’s growth wasn’t the best, it did do better than its peers. 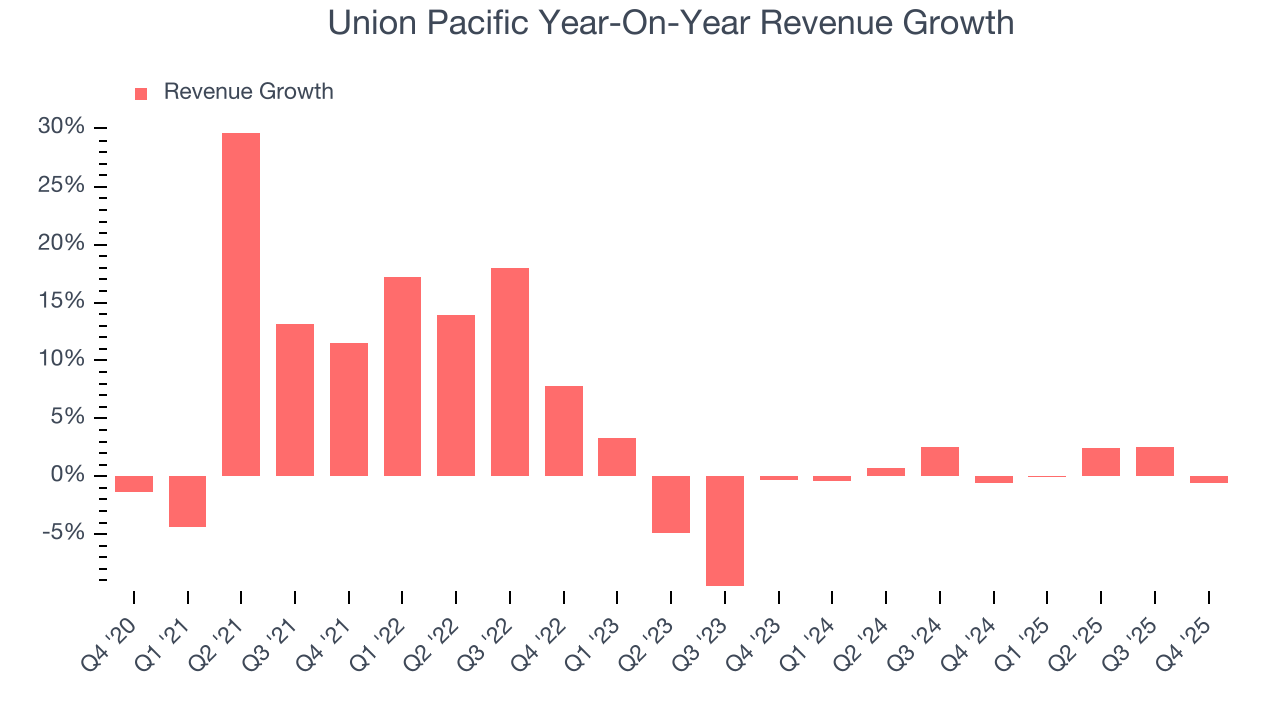
This quarter, Union Pacific missed Wall Street’s estimates and reported a rather uninspiring 0.6% year-on-year revenue decline, generating $6.09 billion of revenue.
Looking ahead, sell-side analysts expect revenue to grow 3.4% over the next 12 months. Although this projection indicates its newer products and services will spur better top-line performance, it is still below the sector average.
6. Gross Margin & Pricing Power
For industrials businesses, cost of sales is usually comprised of the direct labor, raw materials, and supplies needed to offer a product or service. These costs can be impacted by inflation and supply chain dynamics in the short term and a company’s purchasing power and scale over the long term.
Union Pacific has best-in-class unit economics for an industrials company, enabling it to invest in areas such as research and development. Its margin also signals it sells differentiated products, not commodities. As you can see below, it averaged an elite 55.2% gross margin over the last five years. That means Union Pacific only paid its suppliers $44.75 for every $100 in revenue. 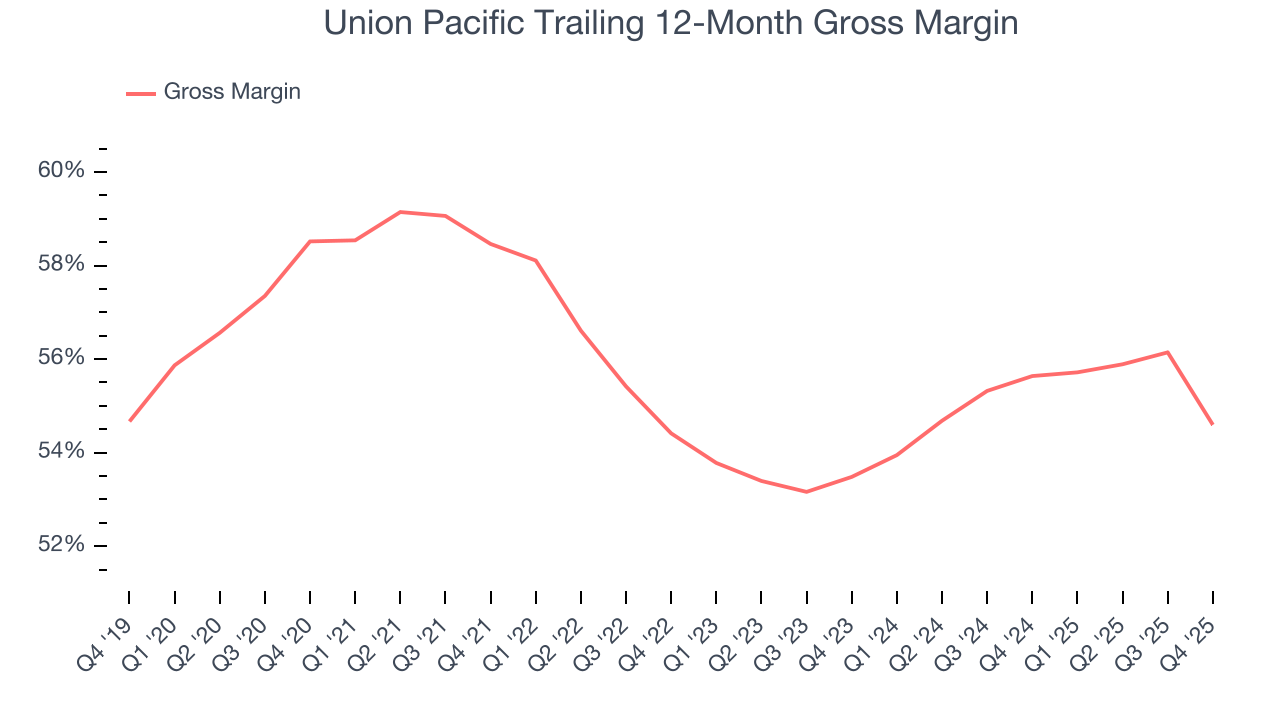
Union Pacific produced a 49.7% gross profit margin in Q4, marking a 6.2 percentage point decrease from 56% in the same quarter last year. Union Pacific’s full-year margin has also been trending down over the past 12 months, decreasing by 1 percentage points. If this move continues, it could suggest a more competitive environment with some pressure to lower prices and higher input costs (such as raw materials and manufacturing expenses).
7. Operating Margin
Operating margin is an important measure of profitability as it shows the portion of revenue left after accounting for all core expenses – everything from the cost of goods sold to advertising and wages. It’s also useful for comparing profitability across companies with different levels of debt and tax rates because it excludes interest and taxes.
Union Pacific has been a well-oiled machine over the last five years. It demonstrated elite profitability for an industrials business, boasting an average operating margin of 40.1%. This result isn’t surprising as its high gross margin gives it a favorable starting point.
Looking at the trend in its profitability, Union Pacific’s operating margin decreased by 2.7 percentage points over the last five years. Many Rail Transportation companies also saw their margins fall (along with revenue, as mentioned above) because the cycle turned in the wrong direction. We hope Union Pacific can emerge from this a stronger company, as the silver lining of a downturn is that market share can be won and efficiencies found.
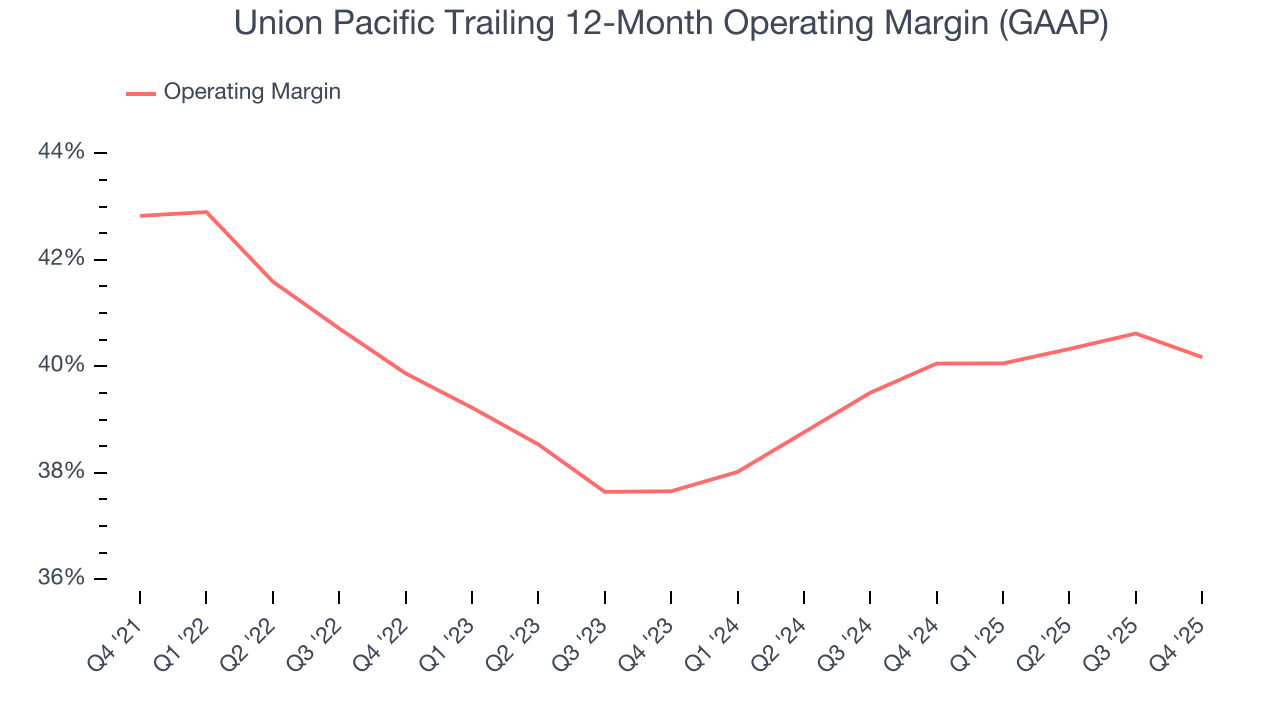
This quarter, Union Pacific generated an operating margin profit margin of 39.5%, down 1.8 percentage points year on year. Since Union Pacific’s gross margin decreased more than its operating margin, we can assume its recent inefficiencies were driven more by weaker leverage on its cost of sales rather than increased marketing, R&D, and administrative overhead expenses.
8. Earnings Per Share
Revenue trends explain a company’s historical growth, but the long-term change in earnings per share (EPS) points to the profitability of that growth – for example, a company could inflate its sales through excessive spending on advertising and promotions.
Union Pacific’s EPS grew at an unimpressive 7.3% compounded annual growth rate over the last five years. This performance was better than its flat revenue but doesn’t tell us much about its business quality because its operating margin didn’t improve.
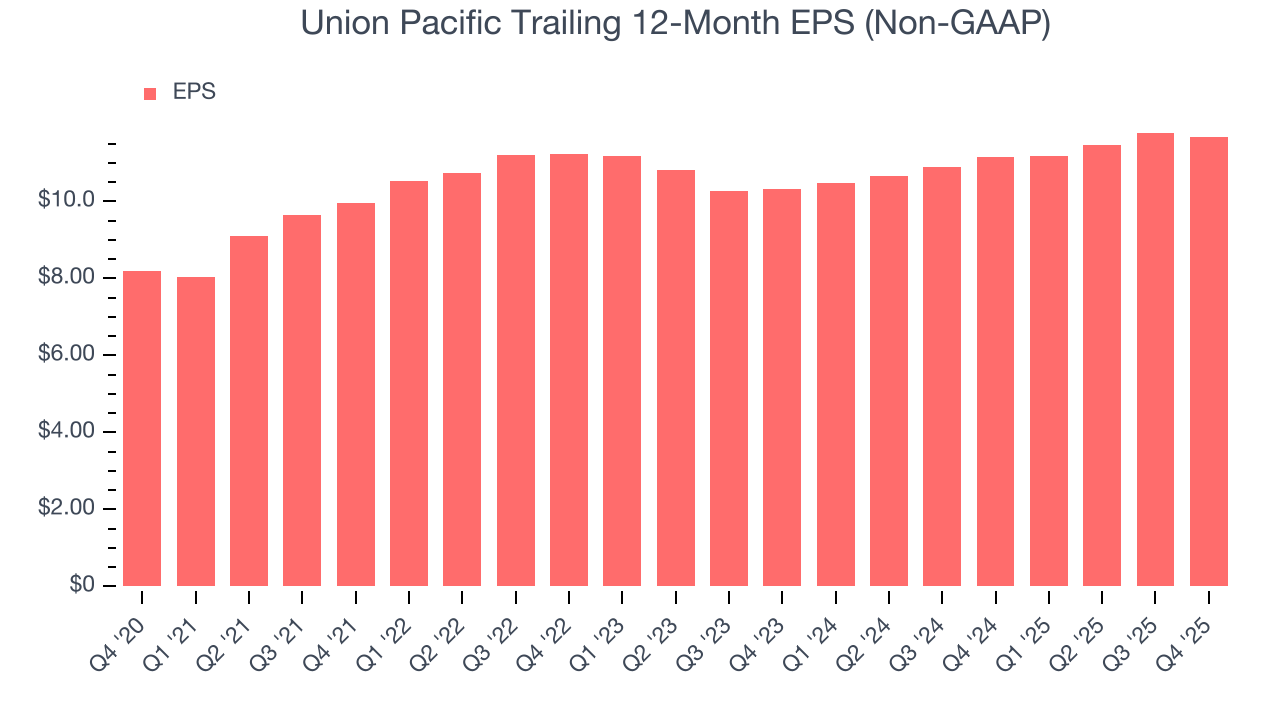
Diving into the nuances of Union Pacific’s earnings can give us a better understanding of its performance. A five-year view shows that Union Pacific has repurchased its stock, shrinking its share count by 12%. This tells us its EPS outperformed its revenue not because of increased operational efficiency but financial engineering, as buybacks boost per share earnings. 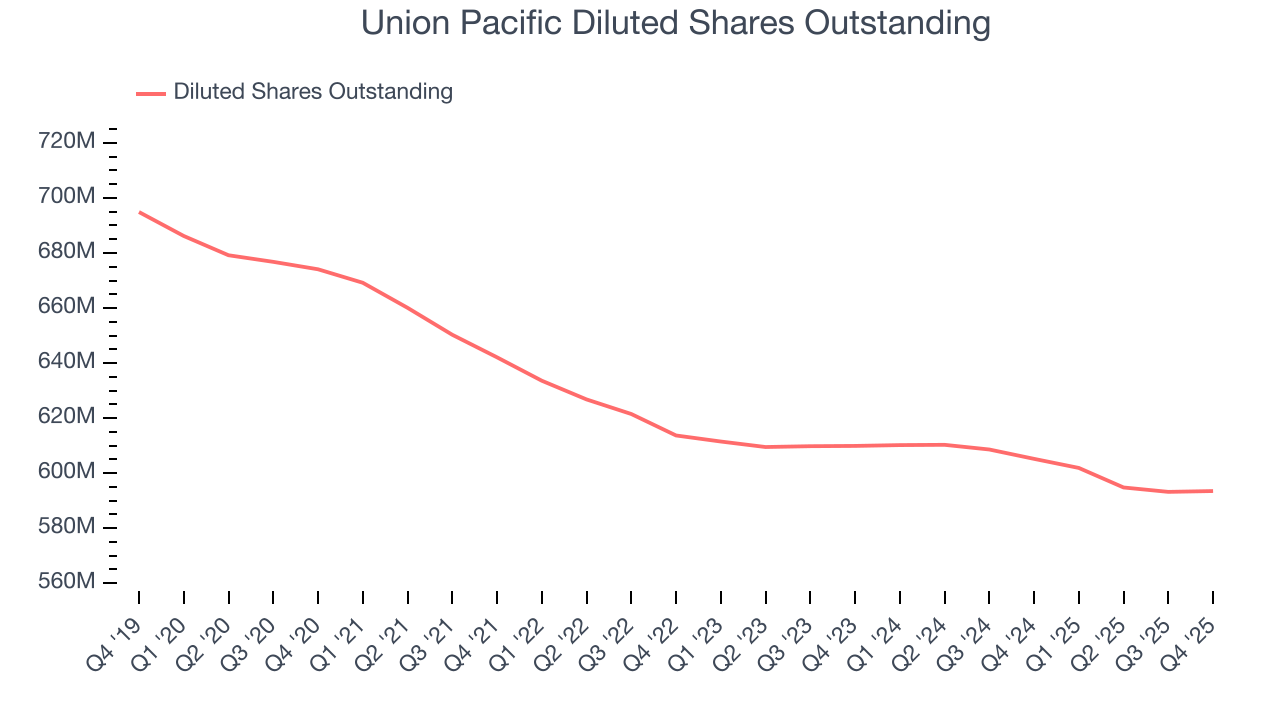
Like with revenue, we analyze EPS over a more recent period because it can provide insight into an emerging theme or development for the business.
For Union Pacific, its two-year annual EPS growth of 6.3% was lower than its five-year trend. We hope its growth can accelerate in the future.
In Q4, Union Pacific reported adjusted EPS of $2.86, down from $2.98 in the same quarter last year. This print was close to analysts’ estimates. Over the next 12 months, Wall Street expects Union Pacific’s full-year EPS of $11.67 to grow 7.4%.
9. Cash Is King
Although earnings are undoubtedly valuable for assessing company performance, we believe cash is king because you can’t use accounting profits to pay the bills.
Union Pacific has shown robust cash profitability, enabling it to comfortably ride out cyclical downturns while investing in plenty of new offerings and returning capital to investors. The company’s free cash flow margin averaged 11.4% over the last five years, quite impressive for an industrials business.
Taking a step back, we can see that Union Pacific’s margin dropped by 3.6 percentage points during that time. Continued declines could signal it is in the middle of an investment cycle.
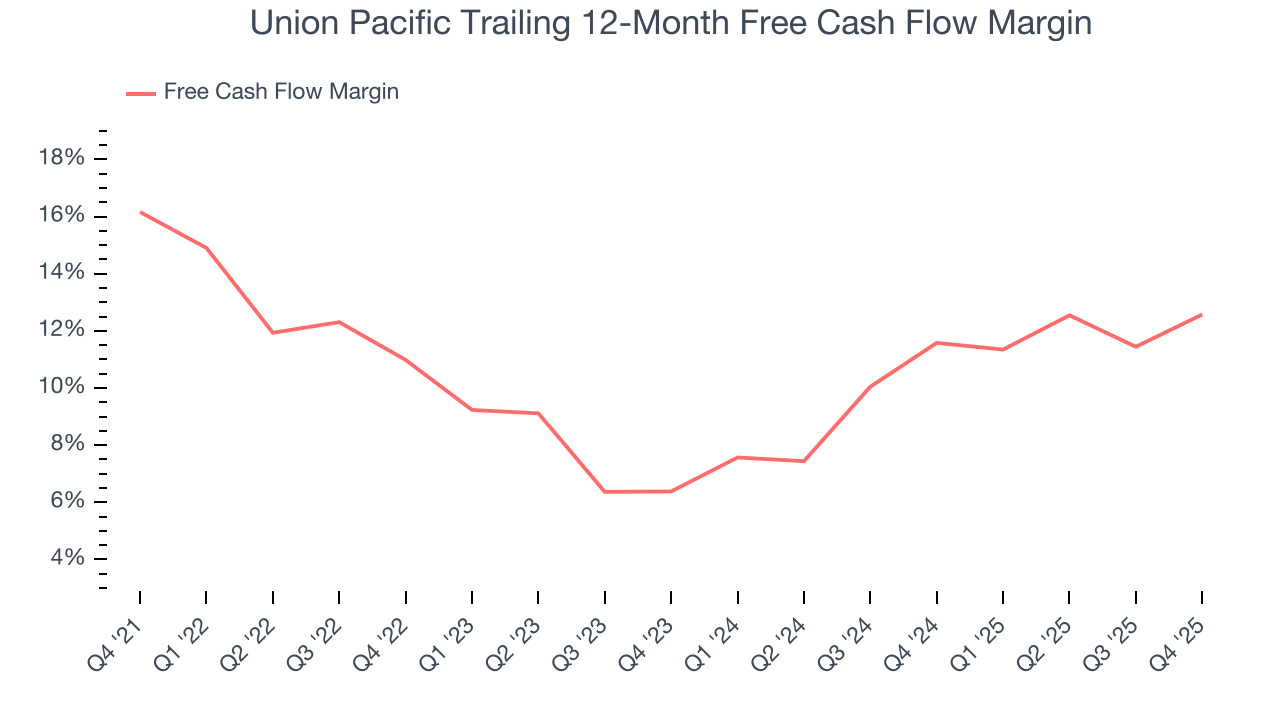
Union Pacific’s free cash flow clocked in at $1.23 billion in Q4, equivalent to a 20.1% margin. This result was good as its margin was 4.6 percentage points higher than in the same quarter last year, but we wouldn’t put too much weight on the short term because investment needs can be seasonal, causing temporary swings. Long-term trends carry greater meaning.
10. Return on Invested Capital (ROIC)
EPS and free cash flow tell us whether a company was profitable while growing its revenue. But was it capital-efficient? A company’s ROIC explains this by showing how much operating profit it makes compared to the money it has raised (debt and equity).
Although Union Pacific hasn’t been the highest-quality company lately, it historically found a few growth initiatives that worked out well. Its five-year average ROIC was 17.4%, impressive for an industrials business.
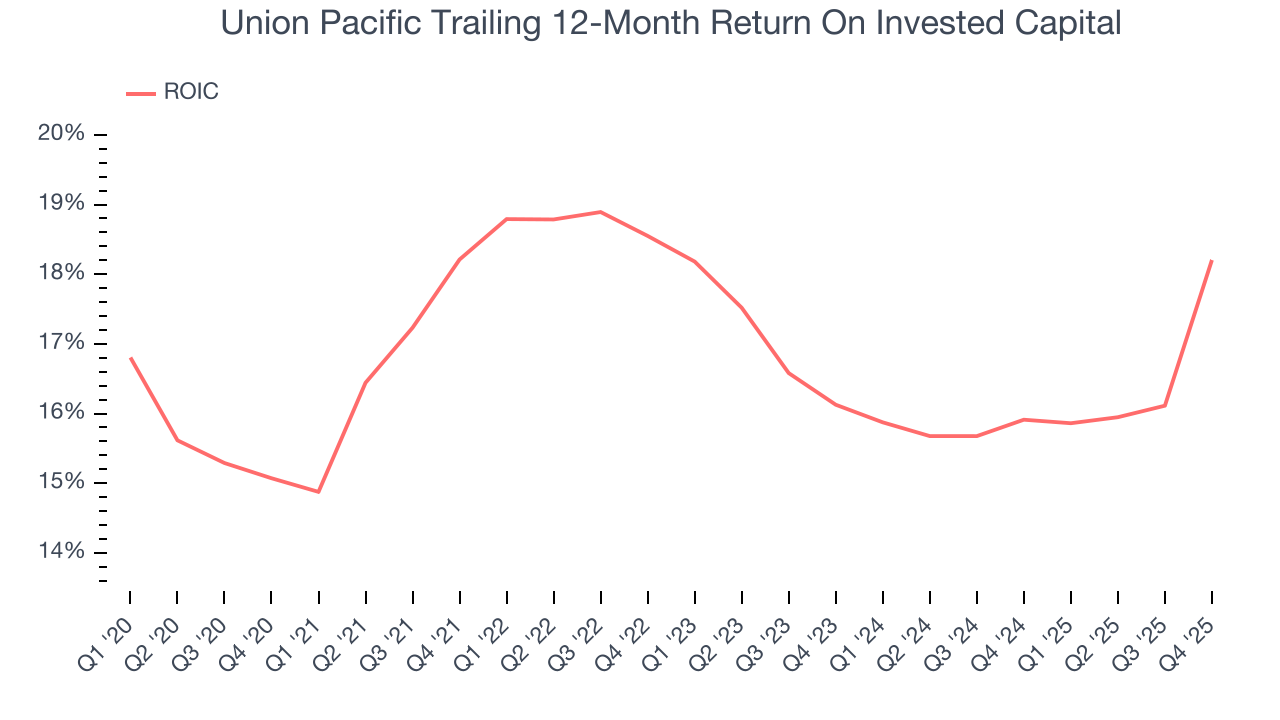
We like to invest in businesses with high returns, but the trend in a company’s ROIC is what often surprises the market and moves the stock price. On average, Union Pacific’s ROIC decreased by 1.3 percentage points annually over the last few years. We like what management has done in the past, but its declining returns are perhaps a symptom of fewer profitable growth opportunities.
11. Balance Sheet Assessment
Union Pacific reported $4.15 billion of cash and $32.55 billion of debt on its balance sheet in the most recent quarter. As investors in high-quality companies, we primarily focus on two things: 1) that a company’s debt level isn’t too high and 2) that its interest payments are not excessively burdening the business.
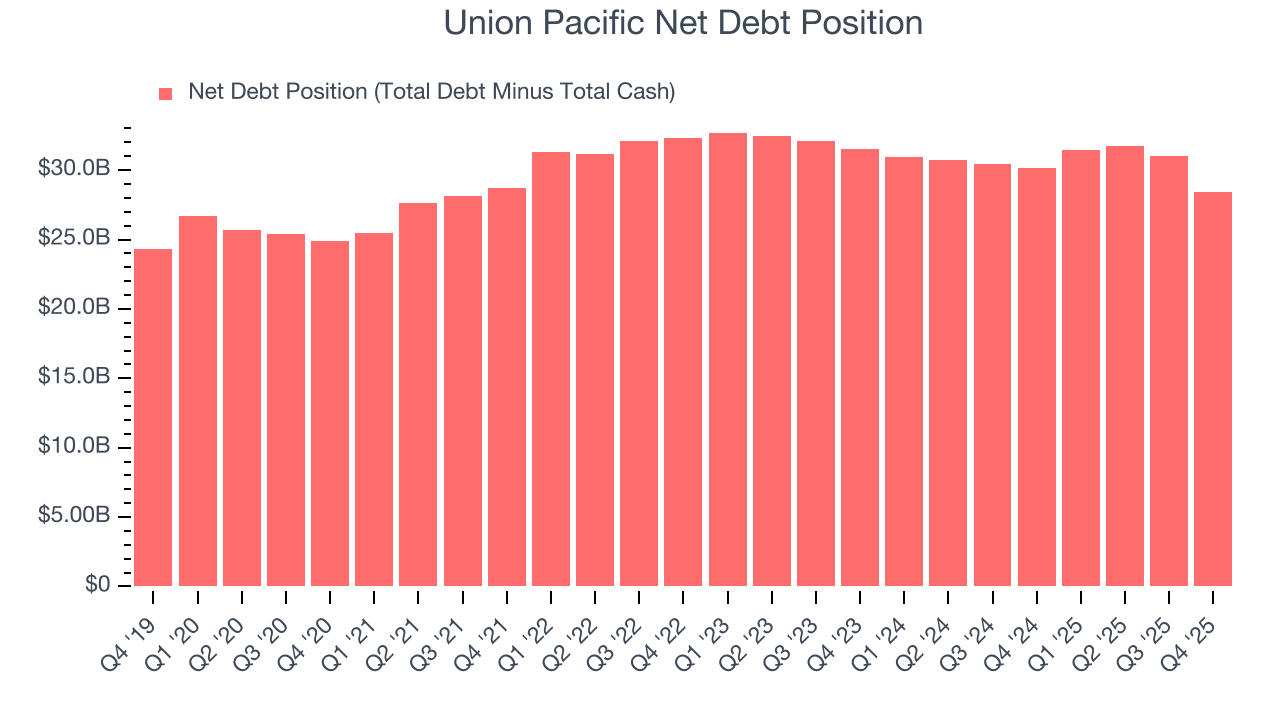
With $12.41 billion of EBITDA over the last 12 months, we view Union Pacific’s 2.3× net-debt-to-EBITDA ratio as safe. We also see its $643 million of annual interest expenses as appropriate. The company’s profits give it plenty of breathing room, allowing it to continue investing in growth initiatives.
12. Key Takeaways from Union Pacific’s Q4 Results
Revenue missed, operating margin was down year-on-year, and EPS was only in line. This quarter didn't have many resounding positives. The stock remained flat at $228.98 immediately following the results.
13. Is Now The Time To Buy Union Pacific?
Updated: March 13, 2026 at 11:39 PM EDT
We think that the latest earnings result is only one piece of the bigger puzzle. If you’re deciding whether to own Union Pacific, you should also grasp the company’s longer-term business quality and valuation.
Union Pacific doesn’t pass our quality test. First off, its revenue growth was uninspiring over the last five years, and analysts expect its demand to deteriorate over the next 12 months. While its admirable gross margins indicate the mission-critical nature of its offerings, the downside is its cash profitability fell over the last five years. On top of that, its declining operating margin shows the business has become less efficient.
Union Pacific’s P/E ratio based on the next 12 months is 19.6x. This valuation tells us a lot of optimism is priced in - you can find more timely opportunities elsewhere.
Wall Street analysts have a consensus one-year price target of $272.21 on the company (compared to the current share price of $241.45).