
Winnebago (WGO)
We wouldn’t recommend Winnebago. Its weak sales growth and declining returns on capital show its demand and profits are shrinking.― StockStory Analyst Team
1. News
2. Summary
Why We Think Winnebago Will Underperform
Created to provide high-quality, affordable RVs to the post-war American family, Winnebago (NYSE:WGO) is a manufacturer of recreational vehicles, providing a range of motorhomes, travel trailers, and fifth-wheel products for outdoor and adventure lifestyles.
- Customers postponed purchases of its products and services this cycle as its revenue declined by 10.5% annually over the last two years
- Incremental sales over the last five years were much less profitable as its earnings per share fell by 8.3% annually while its revenue grew
- High input costs result in an inferior gross margin of 16.6% that must be offset through higher volumes


Winnebago doesn’t satisfy our quality benchmarks. We’re hunting for superior stocks elsewhere.
Why There Are Better Opportunities Than Winnebago


Winnebago’s stock price of $41.24 implies a valuation ratio of 17.5x forward P/E. Winnebago’s valuation may seem like a bargain, especially when stacked up against other industrials companies. We remind you that you often get what you pay for, though.
It’s better to pay up for high-quality businesses with higher long-term earnings potential rather than to buy lower-quality stocks because they appear cheap. These challenged businesses often don’t re-rate, a phenomenon known as a “value trap”.
3. Winnebago (WGO) Research Report: Q4 CY2025 Update
RV Manufacturer Winnebago (NYSE:WGO) reported Q4 CY2025 results topping the market’s revenue expectations, with sales up 12.3% year on year to $702.7 million. The company’s full-year revenue guidance of $2.9 billion at the midpoint came in 1.1% above analysts’ estimates. Its non-GAAP profit of $0.38 per share was significantly above analysts’ consensus estimates.
Winnebago (WGO) Q4 CY2025 Highlights:
- Revenue: $702.7 million vs analyst estimates of $633.5 million (12.3% year-on-year growth, 10.9% beat)
- Adjusted EPS: $0.38 vs analyst estimates of $0.14 (significant beat)
- Adjusted EBITDA: $30.2 million vs analyst estimates of $21.28 million (4.3% margin, 41.9% beat)
- The company lifted its revenue guidance for the full year to $2.9 billion at the midpoint from $2.85 billion, a 1.8% increase
- Management raised its full-year Adjusted EPS guidance to $2.45 at the midpoint, a 4.3% increase
- Operating Margin: 2%, up from -0.1% in the same quarter last year
- Free Cash Flow was $19.8 million, up from -$26.7 million in the same quarter last year
- Market Capitalization: $1.14 billion
Company Overview
Created to provide high-quality, affordable RVs to the post-war American family, Winnebago (NYSE:WGO) is a manufacturer of recreational vehicles, providing a range of motorhomes, travel trailers, and fifth-wheel products for outdoor and adventure lifestyles.
Winnebago is a leading North American manufacturer of recreational vehicles (RVs) and marine products, with a diverse portfolio catering to leisure travel and outdoor recreational activities.
The company operates through three main segments: Towable RV, Motorhome RV, and Marine. In the Towable RV segment, Winnebago produces conventional travel trailers and fifth wheels under the Winnebago and Grand Design brand names. The Motorhome RV segment manufactures Class A, Class B, and Class C motorhomes under the Winnebago and Newmar brands. Winnebago's Marine segment produces premium quality recreational boats under the Chris-Craft and Barletta brands.
The company also manufactures specialty vehicles, including accessibility-enhanced motorhomes and custom commercial vehicles. Recently, Winnebago acquired Lithionics, a lithium-ion battery solutions provider, expanding its offerings in advanced power systems for RVs and other applications.
Winnebago Industries primarily generates revenue through wholesale sales of RVs and marine products to independent dealers. The company focuses on manufacturing, transferring inventory risk to dealers who handle retail sales. Revenue is recognized upon product shipment to dealers. Winnebago also earns additional revenue from parts sales, service work, specialty vehicles, and battery solutions, but these are secondary to its main wholesale business model.
4. Automobile Manufacturing
Much capital investment and technical know-how are needed to manufacture functional, safe, and aesthetically pleasing automobiles for the mass market. Barriers to entry are therefore high, and auto manufacturers with economies of scale can boast strong economic moats. However, this doesn’t insulate them from new entrants, as electric vehicles (EVs) have entered the market and are upending it. This has forced established manufacturers to not only contend with emerging EV-first competitors but also decide how much they want to invest in these disruptive technologies, which will likely cannibalize their legacy offerings.
Winnebago's competitors in the recreational vehicle market include THOR Industries (NYSE:THO), Forest River (a subsidiary of Berkshire Hathaway NYSE:BKH.B), and REV Group (NYSE:REVG).
5. Revenue Growth
A company’s long-term sales performance is one signal of its overall quality. Any business can experience short-term success, but top-performing ones enjoy sustained growth for years. Over the last five years, Winnebago grew its sales at a sluggish 2.3% compounded annual growth rate. This fell short of our benchmarks and is a rough starting point for our analysis.
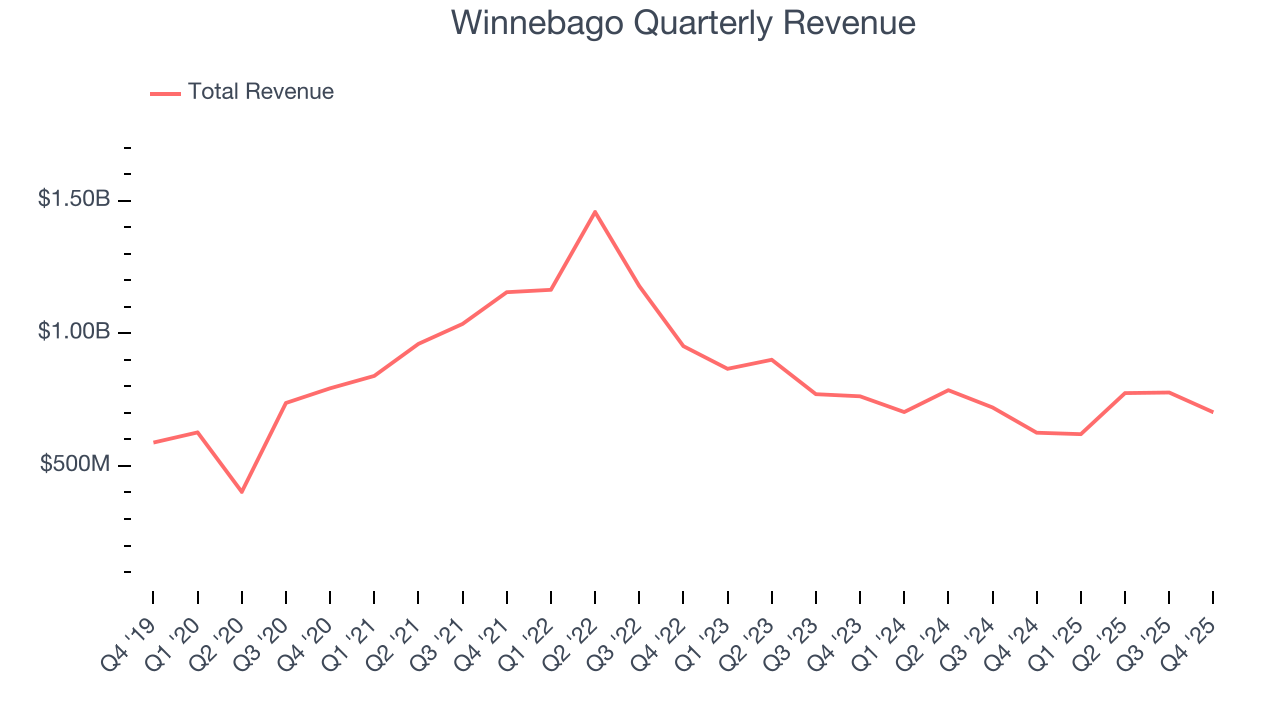
We at StockStory place the most emphasis on long-term growth, but within industrials, a half-decade historical view may miss cycles, industry trends, or a company capitalizing on catalysts such as a new contract win or a successful product line. Winnebago’s performance shows it grew in the past but relinquished its gains over the last two years, as its revenue fell by 6.7% annually. 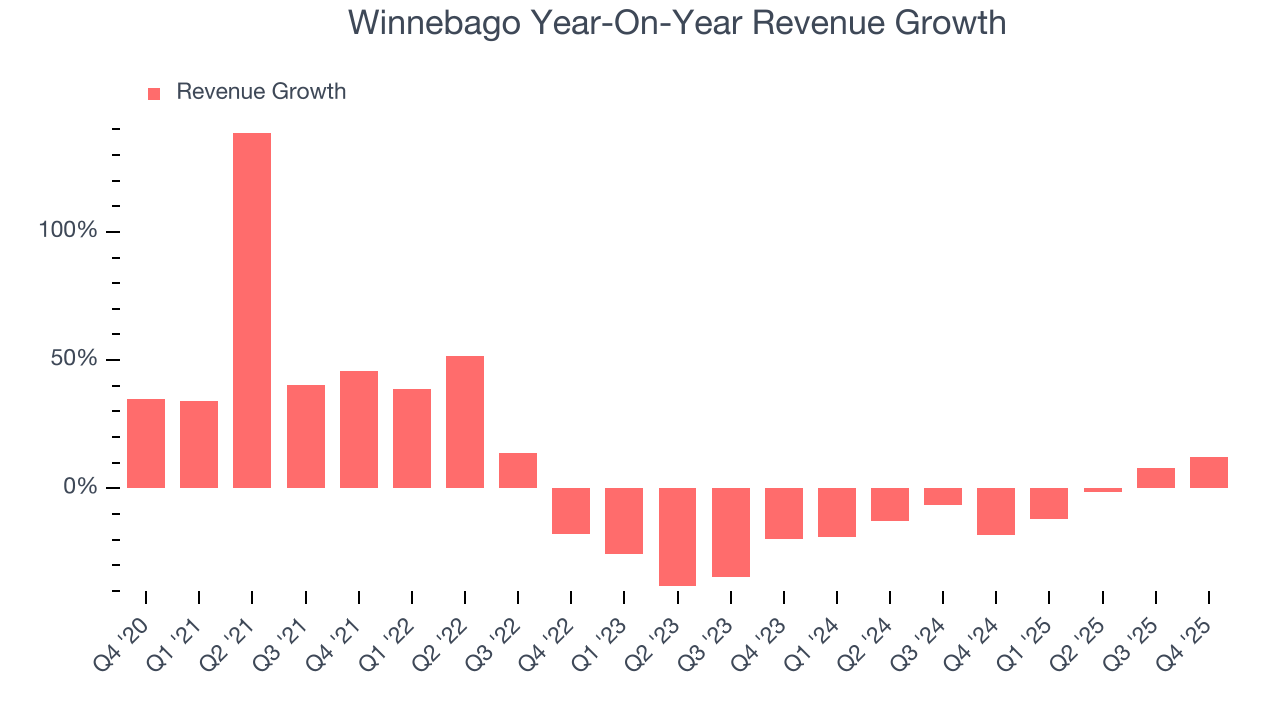
We can better understand the company’s revenue dynamics by analyzing its most important segments, Motorhomes and Towables, which are 43.9% and 41.8% of revenue. Over the last two years, Winnebago’s Motorhomes revenue (homes on wheels) averaged 7.5% year-on-year declines while its Towables revenue (non-motorized vehicles) averaged 4.6% declines. 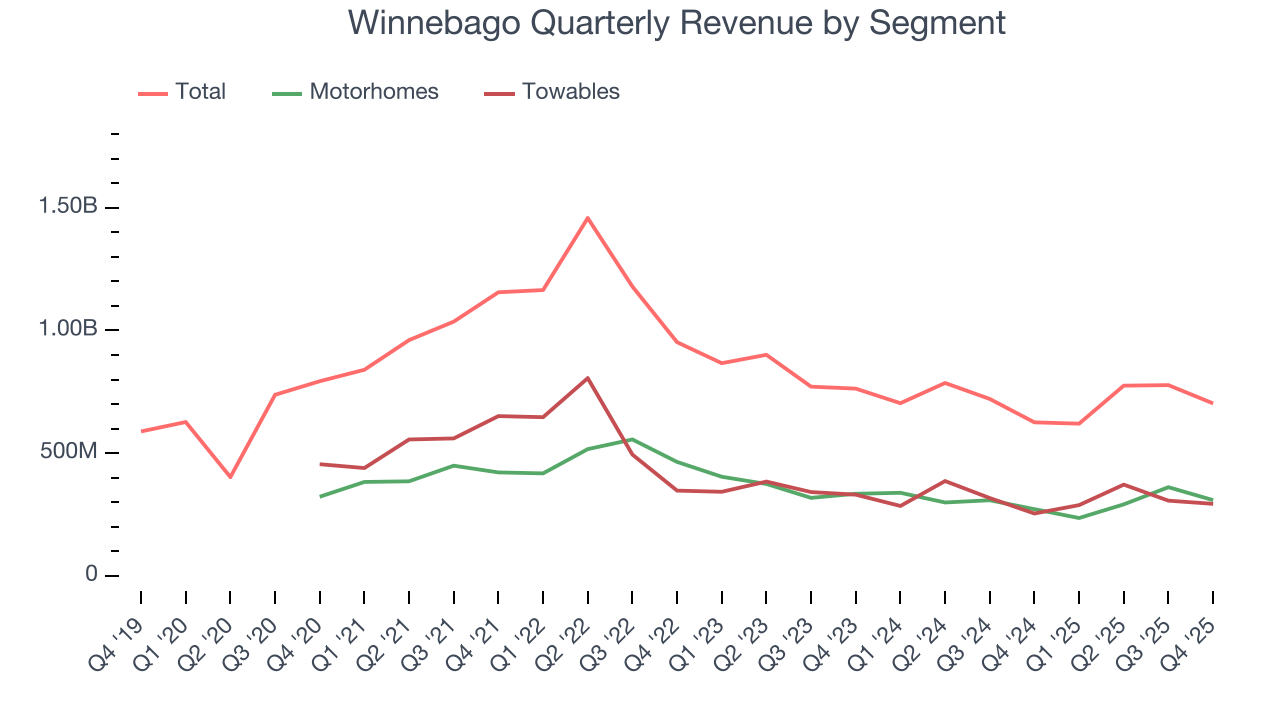
This quarter, Winnebago reported year-on-year revenue growth of 12.3%, and its $702.7 million of revenue exceeded Wall Street’s estimates by 10.9%.
Looking ahead, sell-side analysts expect revenue to remain flat over the next 12 months. While this projection indicates its newer products and services will fuel better top-line performance, it is still below average for the sector.
6. Gross Margin & Pricing Power
Winnebago has bad unit economics for an industrials business, signaling it operates in a competitive market. This is also because it’s an automobile manufacturer.
Automobile manufacturers have structurally lower profitability as they often break even on the initial sale of vehicles and instead make money on parts and servicing, which come many years later - this explains why new entrants such as Rivian, Lucid, and Nikola have negative gross margins. As you can see below, these dynamics culminated in an average 16.4% gross margin for Winnebago over the last five years.
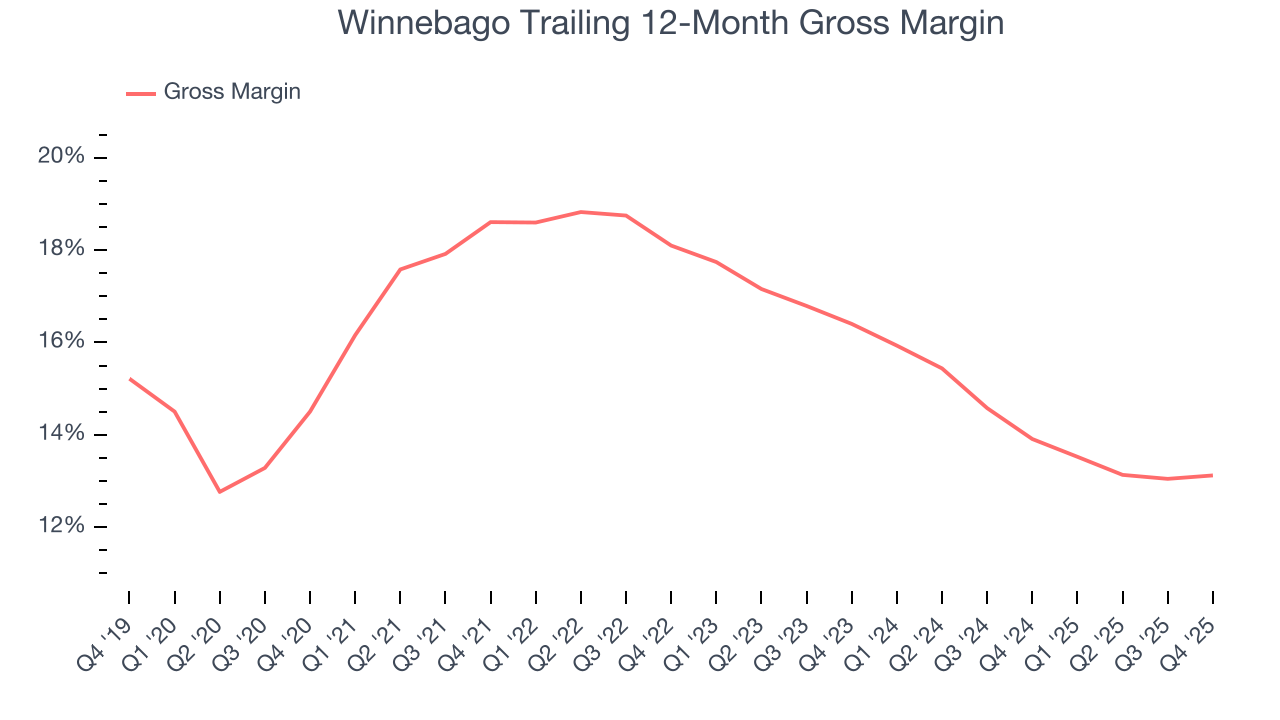
Winnebago’s gross profit margin came in at 12.7% this quarter, in line with the same quarter last year. On a wider time horizon, the company’s full-year margin has remained steady over the past four quarters, suggesting its input costs (such as raw materials and manufacturing expenses) have been stable and it isn’t under pressure to lower prices.
7. Operating Margin
Operating margin is an important measure of profitability as it shows the portion of revenue left after accounting for all core expenses – everything from the cost of goods sold to advertising and wages. It’s also useful for comparing profitability across companies with different levels of debt and tax rates because it excludes interest and taxes.
Winnebago was profitable over the last five years but held back by its large cost base. Its average operating margin of 7.8% was weak for an industrials business. This result isn’t too surprising given its low gross margin as a starting point.
Looking at the trend in its profitability, Winnebago’s operating margin decreased by 9.2 percentage points over the last five years. This raises questions about the company’s expense base because its revenue growth should have given it leverage on its fixed costs, resulting in better economies of scale and profitability. Winnebago’s performance was poor no matter how you look at it - it shows that costs were rising and it couldn’t pass them onto its customers.
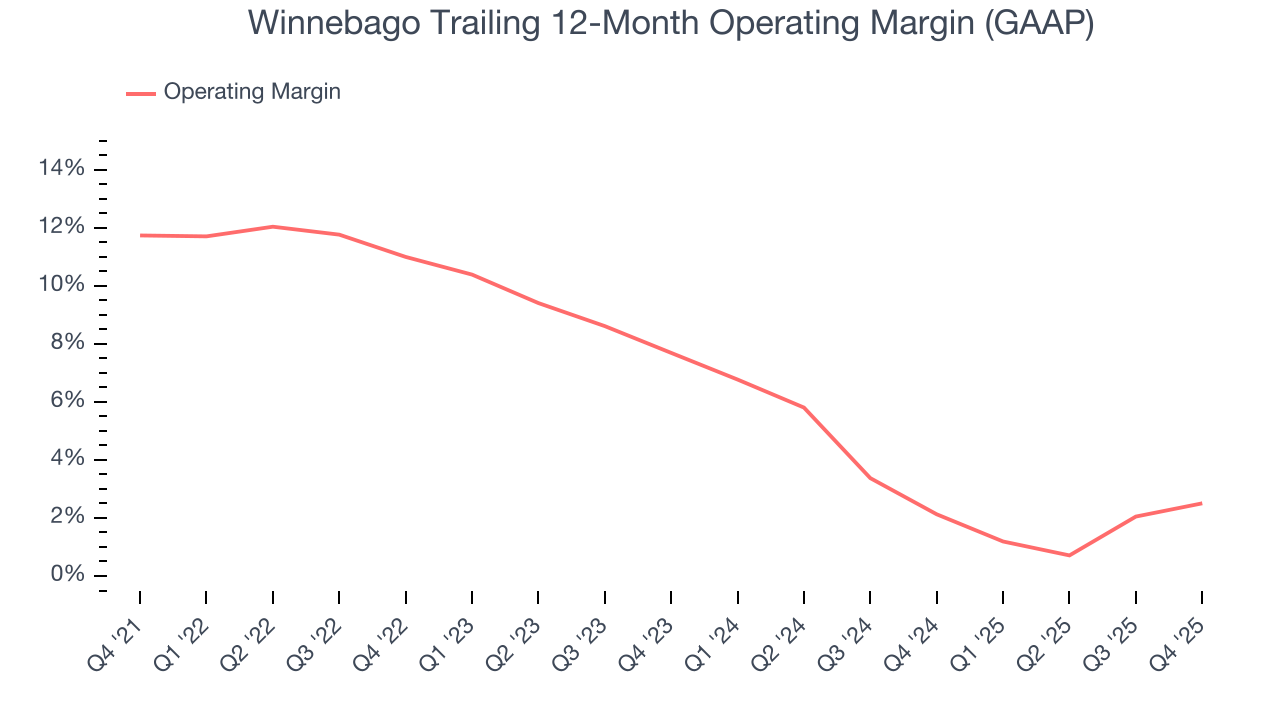
In Q4, Winnebago generated an operating margin profit margin of 2%, up 2.1 percentage points year on year. The increase was encouraging, and because its operating margin rose more than its gross margin, we can infer it was more efficient with expenses such as marketing, R&D, and administrative overhead.
8. Earnings Per Share
Revenue trends explain a company’s historical growth, but the long-term change in earnings per share (EPS) points to the profitability of that growth – for example, a company could inflate its sales through excessive spending on advertising and promotions.
Sadly for Winnebago, its EPS declined by 10.1% annually over the last five years while its revenue grew by 2.3%. This tells us the company became less profitable on a per-share basis as it expanded due to non-fundamental factors such as interest expenses and taxes.

We can take a deeper look into Winnebago’s earnings to better understand the drivers of its performance. As we mentioned earlier, Winnebago’s operating margin expanded this quarter but declined by 9.2 percentage points over the last five years. This was the most relevant factor (aside from the revenue impact) behind its lower earnings; interest expenses and taxes can also affect EPS but don’t tell us as much about a company’s fundamentals.
Like with revenue, we analyze EPS over a more recent period because it can provide insight into an emerging theme or development for the business.
For Winnebago, its two-year annual EPS declines of 44% show it’s continued to underperform. These results were bad no matter how you slice the data.
In Q4, Winnebago reported adjusted EPS of $0.38, up from negative $0.03 in the same quarter last year. This print easily cleared analysts’ estimates, and shareholders should be content with the results. Over the next 12 months, Wall Street expects Winnebago’s full-year EPS of $2.09 to grow 18.7%.
9. Cash Is King
Free cash flow isn't a prominently featured metric in company financials and earnings releases, but we think it's telling because it accounts for all operating and capital expenses, making it tough to manipulate. Cash is king.
Winnebago has shown mediocre cash profitability over the last five years, giving the company limited opportunities to return capital to shareholders. Its free cash flow margin averaged 5.3%, subpar for an industrials business.
Taking a step back, we can see that Winnebago’s margin dropped by 1.2 percentage points during that time. This along with its unexciting margin put the company in a tough spot, and shareholders are likely hoping it can reverse course. If the trend continues, it could signal it’s in the middle of an investment cycle.
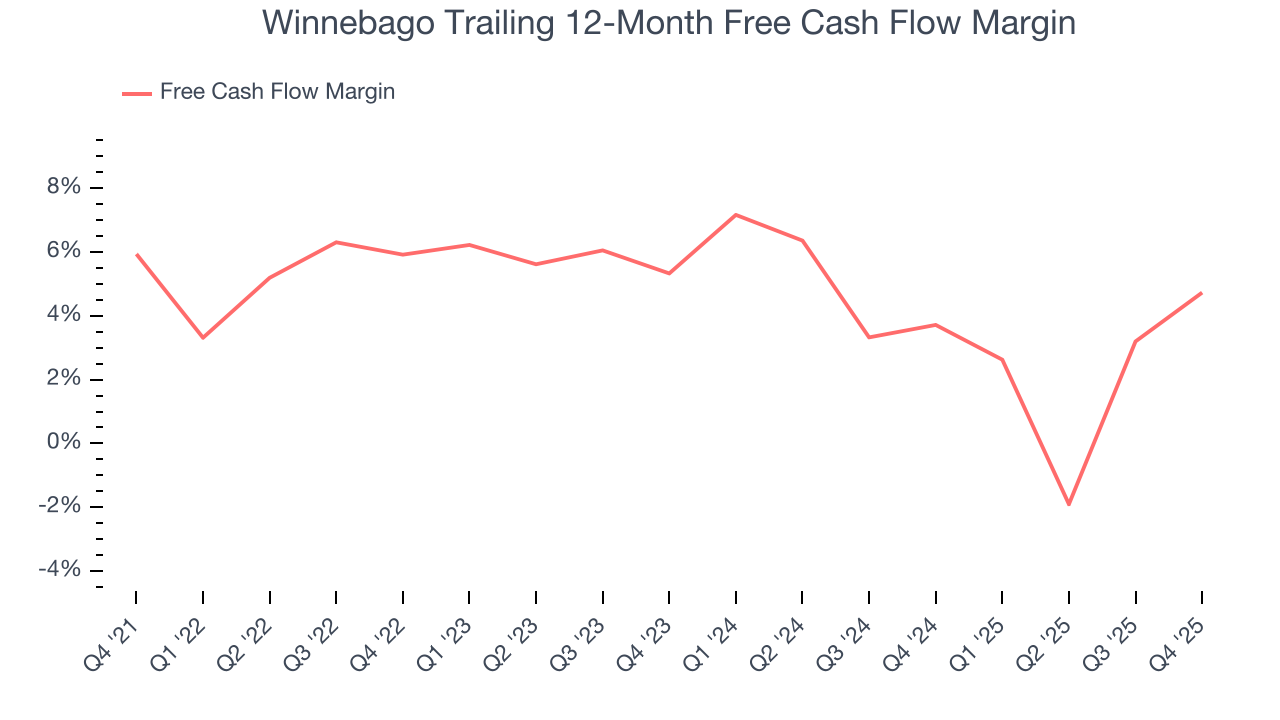
Winnebago’s free cash flow clocked in at $19.8 million in Q4, equivalent to a 2.8% margin. Its cash flow turned positive after being negative in the same quarter last year, but we wouldn’t read too much into the short term because investment needs can be seasonal, causing temporary swings. Long-term trends are more important.
10. Return on Invested Capital (ROIC)
EPS and free cash flow tell us whether a company was profitable while growing its revenue. But was it capital-efficient? A company’s ROIC explains this by showing how much operating profit it makes compared to the money it has raised (debt and equity).
Although Winnebago hasn’t been the highest-quality company lately because of its poor revenue and EPS performance, it historically found a few growth initiatives that worked out well. Its five-year average ROIC was 14.3%, impressive for an industrials business.

We like to invest in businesses with high returns, but the trend in a company’s ROIC is what often surprises the market and moves the stock price. Over the last few years, Winnebago’s ROIC has unfortunately decreased significantly. We like what management has done in the past, but its declining returns are perhaps a symptom of fewer profitable growth opportunities.
11. Balance Sheet Assessment
Winnebago reported $181.7 million of cash and $578.6 million of debt on its balance sheet in the most recent quarter. As investors in high-quality companies, we primarily focus on two things: 1) that a company’s debt level isn’t too high and 2) that its interest payments are not excessively burdening the business.
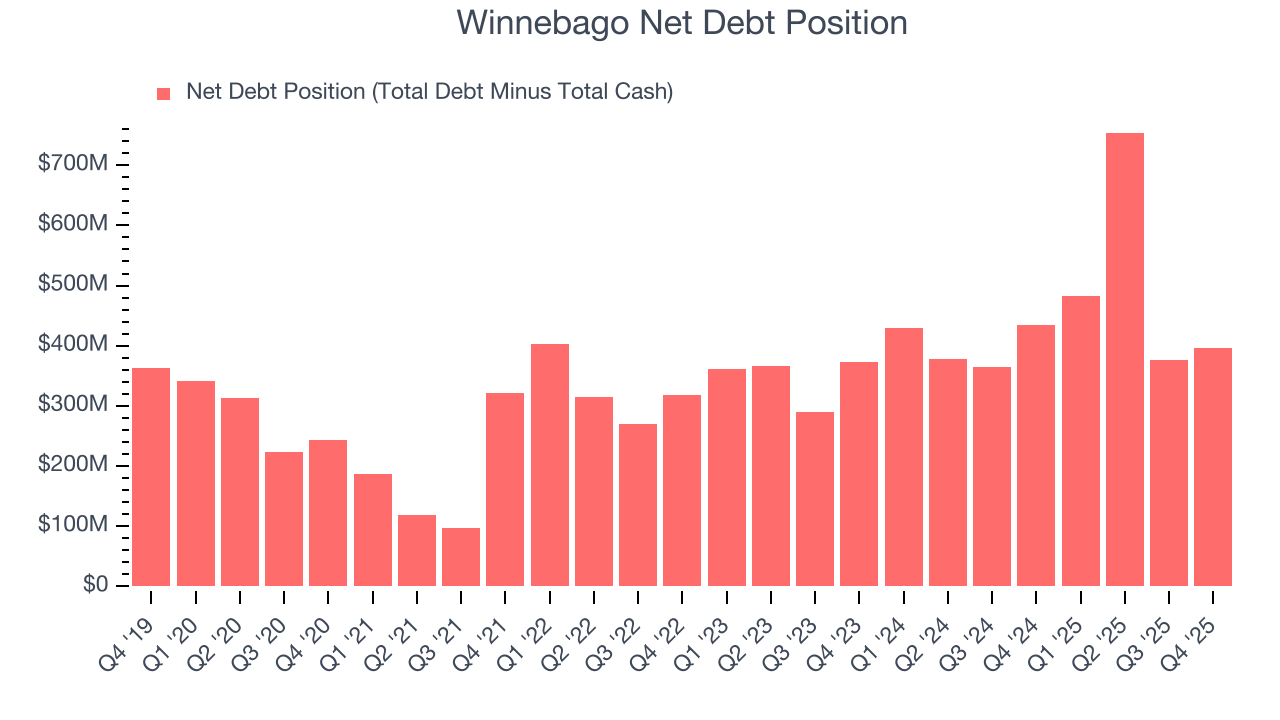
With $137.7 million of EBITDA over the last 12 months, we view Winnebago’s 2.9× net-debt-to-EBITDA ratio as safe. We also see its $14.6 million of annual interest expenses as appropriate. The company’s profits give it plenty of breathing room, allowing it to continue investing in growth initiatives.
12. Key Takeaways from Winnebago’s Q4 Results
This was an very encouraging 'beat and raise' quarter. Specifically, it was good to see Winnebago beat analysts’ EPS expectations this quarter on better revenue. Looking ahead, the company raised full-year guidance for both revenue and EPS. Zooming out, we think this quarter featured many important positives. The stock traded up 8.6% to $43.80 immediately following the results.
13. Is Now The Time To Buy Winnebago?
Updated: December 19, 2025 at 7:15 AM EST
We think that the latest earnings result is only one piece of the bigger puzzle. If you’re deciding whether to own Winnebago, you should also grasp the company’s longer-term business quality and valuation.
Winnebago falls short of our quality standards. For starters, its revenue growth was weak over the last five years, and analysts expect its demand to deteriorate over the next 12 months. And while its projected EPS for the next year implies the company’s fundamentals will improve, the downside is its diminishing returns show management's prior bets haven't worked out. On top of that, its declining EPS over the last five years makes it a less attractive asset to the public markets.
Winnebago’s P/E ratio based on the next 12 months is 16.3x. This valuation is reasonable, but the company’s shaky fundamentals present too much downside risk. There are superior stocks to buy right now.
Wall Street analysts have a consensus one-year price target of $45 on the company (compared to the current share price of $43.80).