Wyndham (WH)
Wyndham keeps us up at night. Its low returns on capital and plummeting sales suggest it struggles to generate demand and profits, a red flag.― StockStory Analyst Team
1. News


2. Summary
Why We Think Wyndham Will Underperform
Established in 1981, Wyndham (NYSE:WH) is a global hotel franchising company with over 9,000 hotels across nearly 95 countries on six continents.
- Sales were flat over the last five years, indicating it’s failed to expand its business
- Low returns on capital reflect management’s struggle to allocate funds effectively, and its decreasing returns suggest its historical profit centers are aging
- Revenue per room has underperformed over the past two years, suggesting it may need to develop new facilities


Wyndham’s quality is not up to our standards. We’re hunting for superior stocks elsewhere.
Why There Are Better Opportunities Than Wyndham


At $80.35 per share, Wyndham trades at 16.6x forward P/E. Yes, this valuation multiple is lower than that of other consumer discretionary peers, but we’ll remind you that you often get what you pay for.
Our advice is to pay up for elite businesses whose advantages are tailwinds to earnings growth. Don’t get sucked into lower-quality businesses just because they seem like bargains. These mediocre businesses often never achieve a higher multiple as hoped, a phenomenon known as a “value trap”.
3. Wyndham (WH) Research Report: Q4 CY2025 Update
Hotel franchising company Wyndham (NYSE:WH) missed Wall Street’s revenue expectations in Q4 CY2025, with sales falling 2.1% year on year to $334 million. Its non-GAAP profit of $0.93 per share was 4.4% above analysts’ consensus estimates.
Wyndham (WH) Q4 CY2025 Highlights:
- Revenue: $334 million vs analyst estimates of $336 million (2.1% year-on-year decline, 0.6% miss)
- Adjusted EPS: $0.93 vs analyst estimates of $0.89 (4.4% beat)
- Adjusted EBITDA: $165 million vs analyst estimates of $162.4 million (49.4% margin, 1.6% beat)
- Adjusted EPS guidance for the upcoming financial year 2026 is $4.71 at the midpoint, missing analyst estimates by 5.2%
- EBITDA guidance for the upcoming financial year 2026 is $737.5 million at the midpoint, below analyst estimates of $759.1 million
- Operating Margin: -10.8%, down from 38.1% in the same quarter last year
- Free Cash Flow Margin: 50.3%, up from 32% in the same quarter last year
- RevPAR: $42.91 at quarter end, up 7.2% year on year
- Market Capitalization: $6.07 billion
Company Overview
Established in 1981, Wyndham (NYSE:WH) is a global hotel franchising company with over 9,000 hotels across nearly 95 countries on six continents.
The company's portfolio is diverse, encompassing over 20 hotel brands that cater to a broad spectrum of travelers and budgets.
At the luxury and upscale end, Wyndham offers brands like Wyndham Grand and Dolce Hotels and Resorts, known for their refined experiences and exceptional service. The company's mid-scale offerings, such as Ramada and Wingate, provide comfortable and value-driven accommodations for business and leisure travelers. Lastly, Wyndham's economy brands, including Days Inn and Super 8, offer affordable and reliable lodging options.
Wyndham primarily focuses on hotel franchising, with a vast majority of its properties operated by independent owners under franchise agreements. This model has allowed Wyndham to maintain a wide geographic spread without the substantial capital investment typically associated with owning properties. The company also manages a smaller number of hotels through management contracts.
Customer loyalty is key to Wyndham's operations. Wyndham Rewards, its loyalty program, is a notable example, offering members a simple and generous points system that can be redeemed for free nights, discounts, and other rewards.
4. Consumer Discretionary - Travel and Vacation Providers
The Consumer Discretionary sector, by definition, is made up of companies selling non-essential goods and services. When economic conditions deteriorate or tastes shift, consumers can easily cut back or eliminate these purchases. For long-term investors with five-year holding periods, this creates a structural challenge: the sector is inherently hit-driven, with low switching costs and fickle customers. As a result, only a handful of companies can reliably grow demand and compound earnings over long periods, which is why our bar is high and High Quality ratings are rare.
Travel and vacation providers operate tour packages, cruise lines, online travel agencies, and vacation rental platforms, connecting consumers with leisure and business travel experiences. Tailwinds include robust post-pandemic travel demand, a consumer preference shift toward experiences over goods, and technology-enabled personalization improving conversion and loyalty. However, headwinds are significant: the industry is acutely sensitive to macroeconomic cycles, geopolitical instability, and fuel price volatility. Low switching costs mean fierce price competition, while capacity additions in segments like cruises can lead to oversupply. Regulatory burdens, weather disruptions, and public health risks further create episodic but potentially severe demand shocks.
Wyndham’s primary competitors include Marriott International (NYSE:MAR), Hilton Worldwide Holdings (NYSE:HLT), InterContinental Hotels Group (NYSE:IHG), Choice Hotels International (NYSE:CHH), and Hyatt Hotels (NYSE:H).
5. Revenue Growth
A company’s long-term sales performance is one signal of its overall quality. Any business can have short-term success, but a top-tier one grows for years. Unfortunately, Wyndham’s 1.9% annualized revenue growth over the last five years was weak. This was below our standards and is a rough starting point for our analysis.
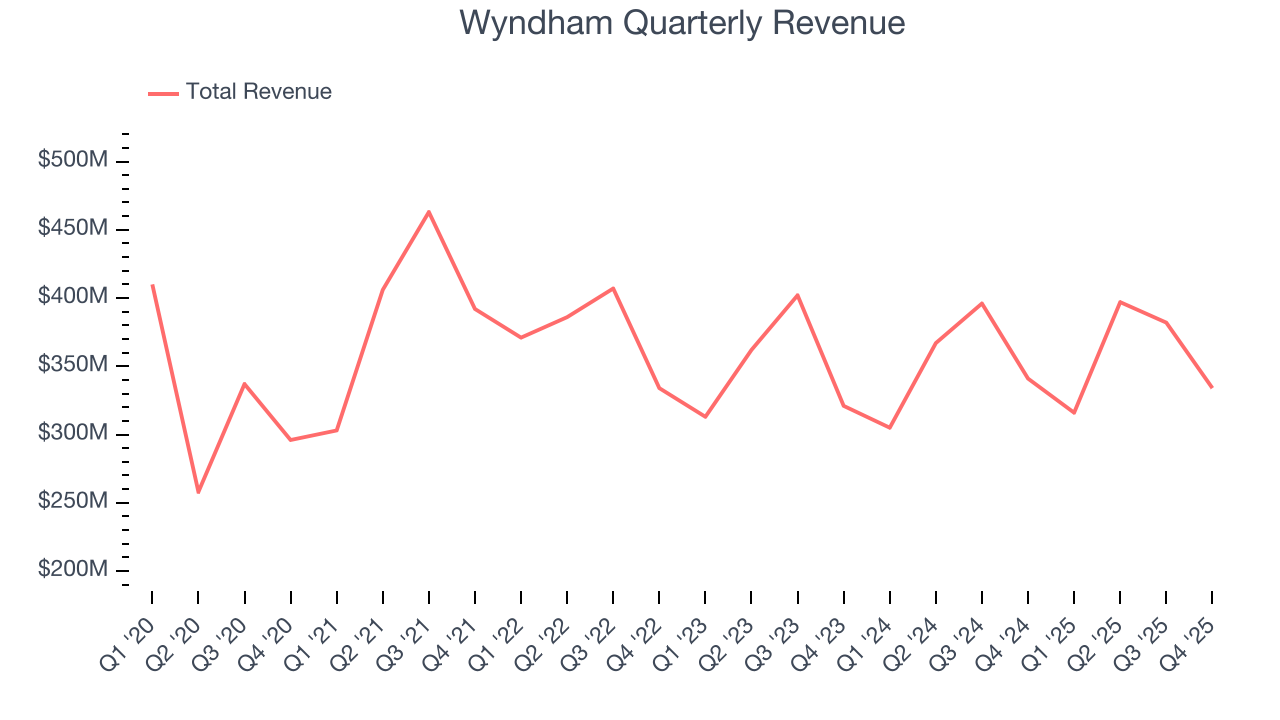
We at StockStory place the most emphasis on long-term growth, but within consumer discretionary, a stretched historical view may miss a company riding a successful new property or trend. Wyndham’s annualized revenue growth of 1.1% over the last two years aligns with its five-year trend, suggesting its demand was consistently weak. 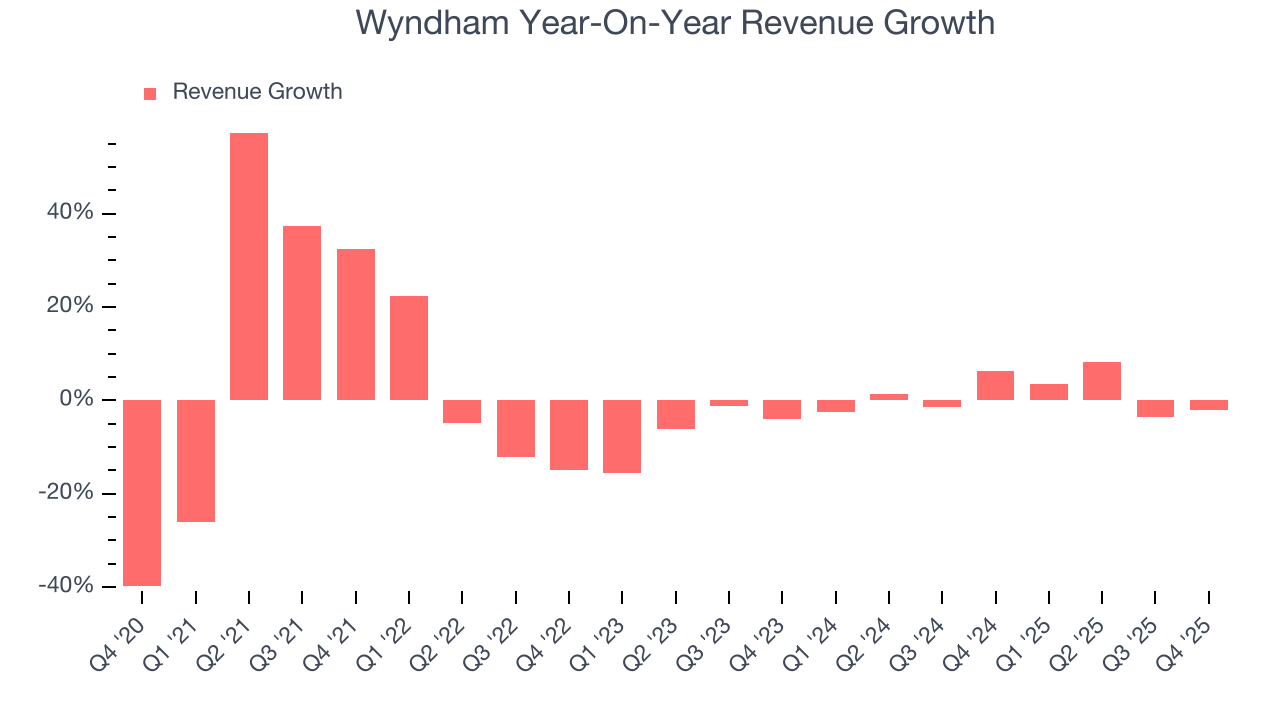
Wyndham also reports revenue per available room, which clocked in at $42.91 this quarter and is a key metric accounting for daily rates and occupancy levels. Over the last two years, Wyndham’s revenue per room averaged 2.3% year-on-year growth, which is quite underwhelming. This number doesn’t surprise us as it’s in line with its revenue growth. It is sometimes the strategy of hotels to grow ancillary revenues because they are price takers in room revenues. 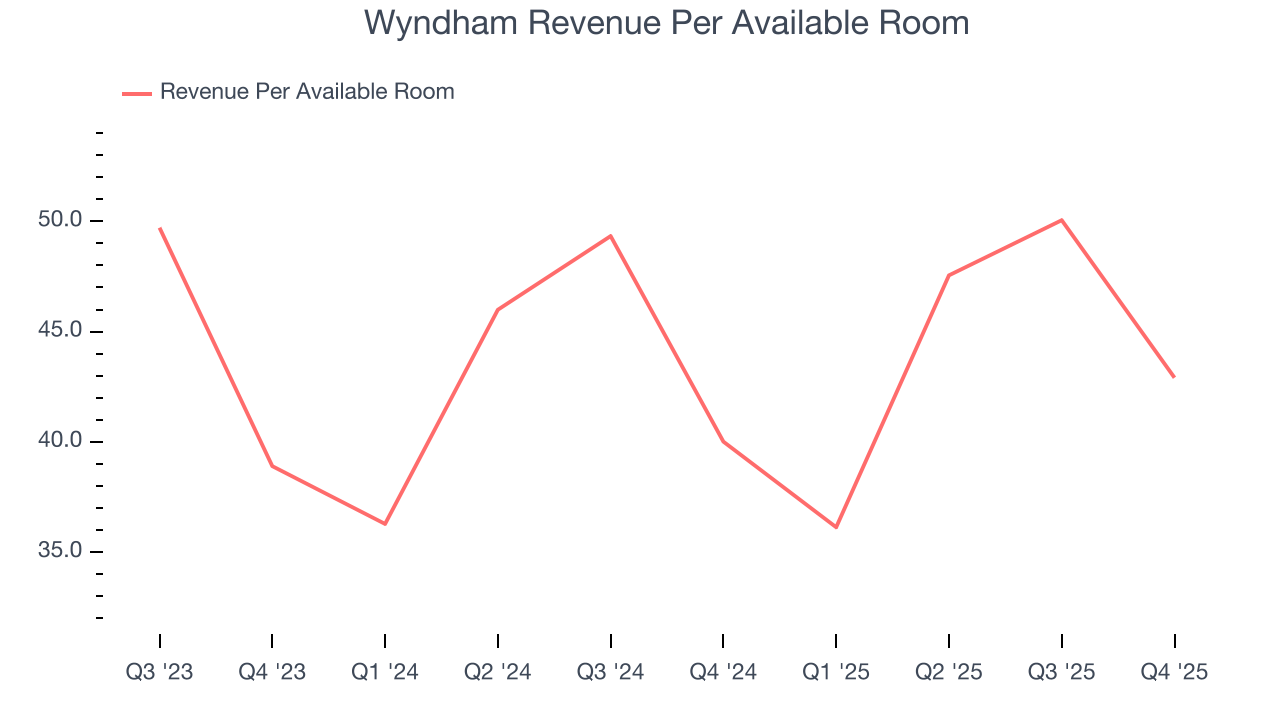
This quarter, Wyndham missed Wall Street’s estimates and reported a rather uninspiring 2.1% year-on-year revenue decline, generating $334 million of revenue.
Looking ahead, sell-side analysts expect revenue to grow 5.5% over the next 12 months. While this projection indicates its newer products and services will fuel better top-line performance, it is still below average for the sector.
6. Operating Margin
Wyndham’s operating margin has shrunk over the last 12 months and averaged 31.7% over the last two years. The company’s profitability was mediocre for a consumer discretionary business and shows it couldn’t pass its higher operating expenses onto its customers.
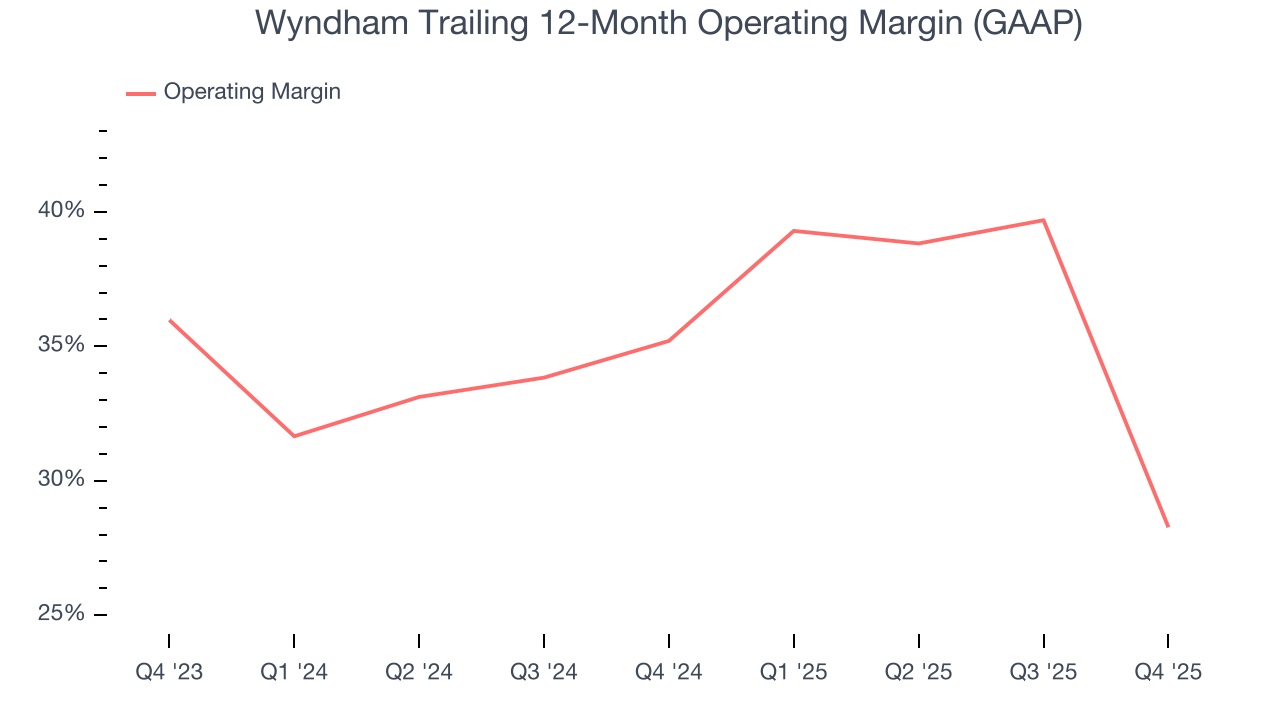
This quarter, Wyndham generated an operating margin profit margin of negative 10.8%, down 48.9 percentage points year on year. This contraction shows it was less efficient because its expenses increased relative to its revenue.
7. Earnings Per Share
Revenue trends explain a company’s historical growth, but the long-term change in earnings per share (EPS) points to the profitability of that growth – for example, a company could inflate its sales through excessive spending on advertising and promotions.
Wyndham’s EPS grew at a decent 34.8% compounded annual growth rate over the last five years, higher than its 1.9% annualized revenue growth. However, this alone doesn’t tell us much about its business quality because its operating margin didn’t improve.
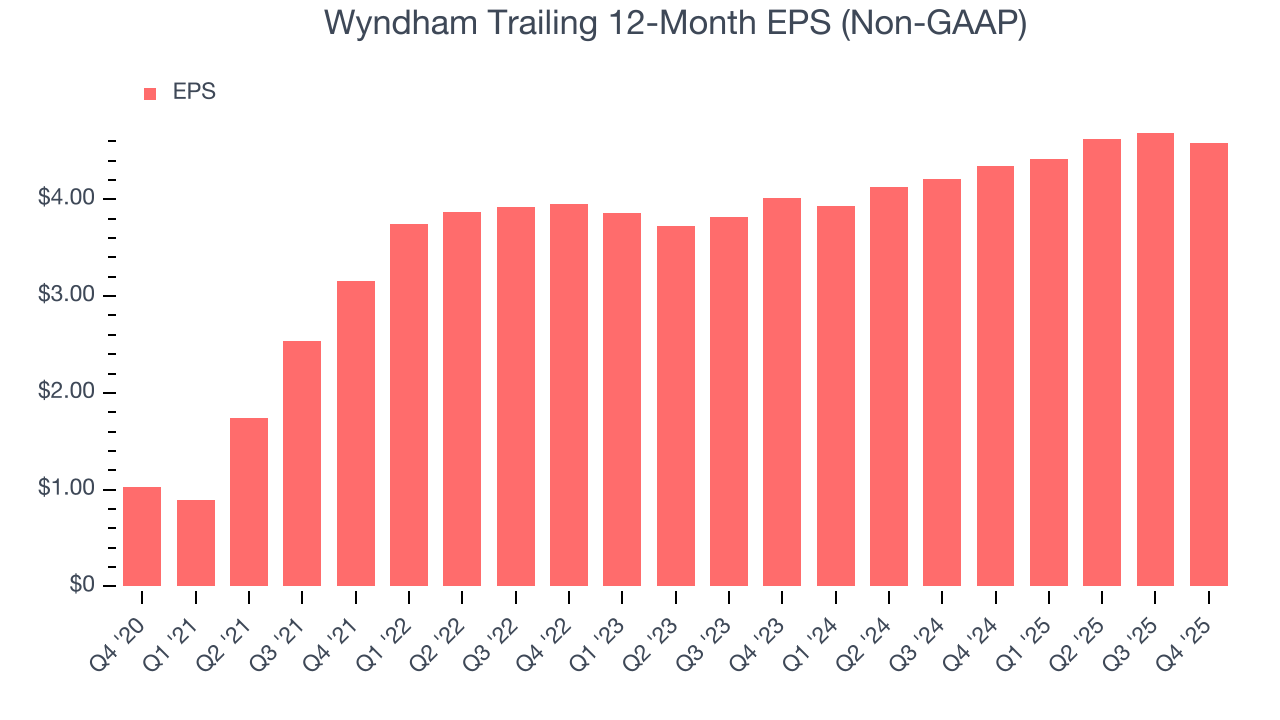
In Q4, Wyndham reported adjusted EPS of $0.93, down from $1.04 in the same quarter last year. Despite falling year on year, this print beat analysts’ estimates by 4.4%. Over the next 12 months, Wall Street expects Wyndham’s full-year EPS of $4.58 to grow 7.4%.
8. Cash Is King
Free cash flow isn't a prominently featured metric in company financials and earnings releases, but we think it's telling because it accounts for all operating and capital expenses, making it tough to manipulate. Cash is king.
Wyndham has shown poor cash profitability over the last two years, giving the company limited opportunities to return capital to shareholders. Its free cash flow margin averaged 20.9%, lousy for a consumer discretionary business.
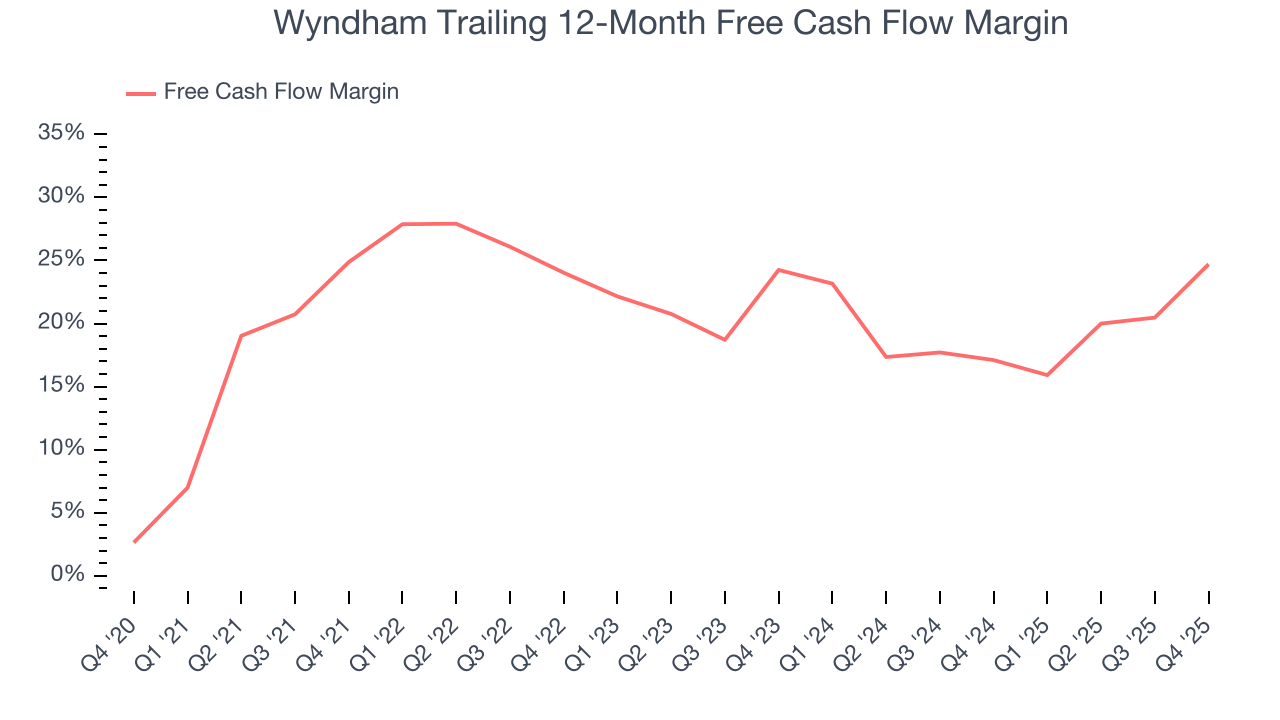
Wyndham’s free cash flow clocked in at $168 million in Q4, equivalent to a 50.3% margin. This result was good as its margin was 18.3 percentage points higher than in the same quarter last year, but we wouldn’t put too much weight on the short term because investment needs can be seasonal, causing temporary swings. Long-term trends carry greater meaning.
9. Return on Invested Capital (ROIC)
EPS and free cash flow tell us whether a company was profitable while growing its revenue. But was it capital-efficient? A company’s ROIC explains this by showing how much operating profit it makes compared to the money it has raised (debt and equity).
Wyndham historically did a mediocre job investing in profitable growth initiatives. Its five-year average ROIC was 12.1%, somewhat low compared to the best consumer discretionary companies that consistently pump out 25%+.
We like to invest in businesses with high returns, but the trend in a company’s ROIC is what often surprises the market and moves the stock price. Unfortunately, Wyndham’s ROIC averaged 4.8 percentage point decreases each year over the last few years. Paired with its already low returns, these declines suggest its profitable growth opportunities are few and far between.
10. Balance Sheet Assessment
Wyndham reported $64 million of cash and $2.56 billion of debt on its balance sheet in the most recent quarter. As investors in high-quality companies, we primarily focus on two things: 1) that a company’s debt level isn’t too high and 2) that its interest payments are not excessively burdening the business.
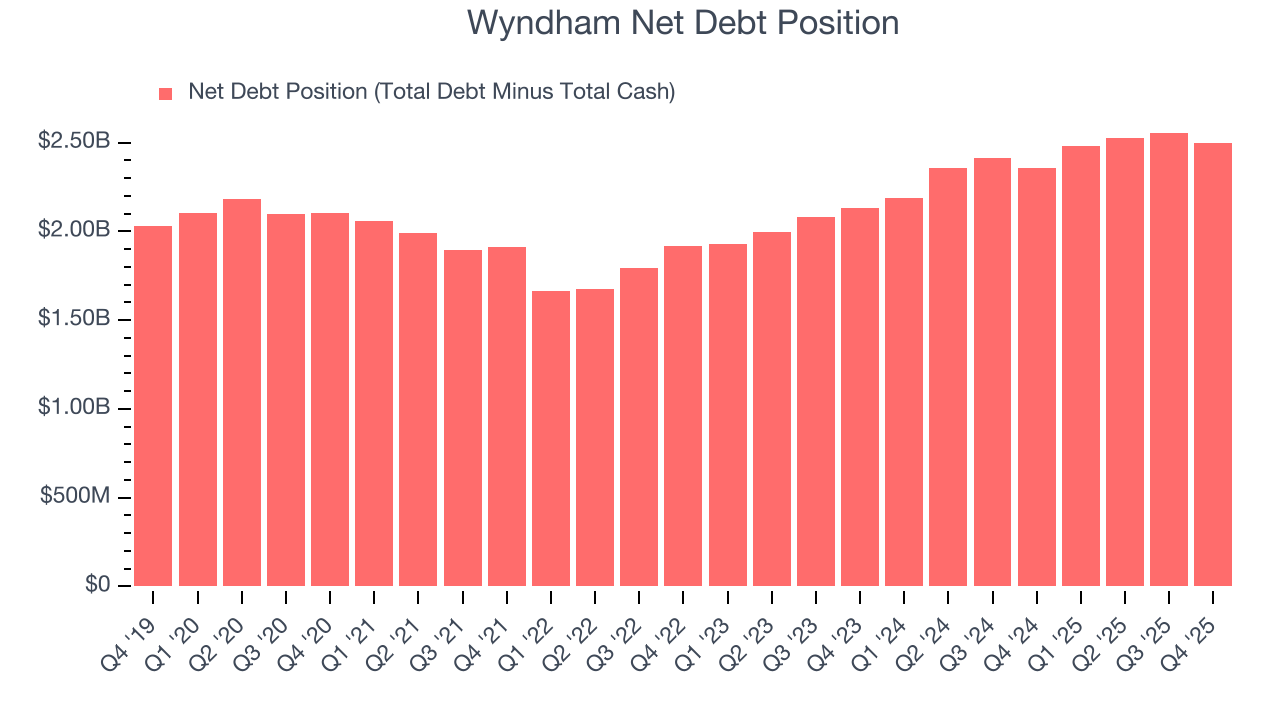
With $718 million of EBITDA over the last 12 months, we view Wyndham’s 3.5× net-debt-to-EBITDA ratio as safe. We also see its $67 million of annual interest expenses as appropriate. The company’s profits give it plenty of breathing room, allowing it to continue investing in growth initiatives.
11. Key Takeaways from Wyndham’s Q4 Results
It was good to see Wyndham beat analysts’ EPS expectations this quarter. On the other hand, its full-year EBITDA guidance missed and its revenue fell slightly short of Wall Street’s estimates. Overall, this was a weaker quarter. The stock traded down 1.2% to $79.25 immediately after reporting.
12. Is Now The Time To Buy Wyndham?
Updated: February 18, 2026 at 4:55 PM EST
Are you wondering whether to buy Wyndham or pass? We urge investors to not only consider the latest earnings results but also longer-term business quality and valuation as well.
We cheer for all companies serving everyday consumers, but in the case of Wyndham, we’ll be cheering from the sidelines. While its decent EPS growth over the last five years shows its profits are trickling down to shareholders, the downside is its revenue per room has disappointed. On top of that, its projected EPS for the next year is lacking.
Wyndham’s P/E ratio based on the next 12 months is 16.3x. This valuation is reasonable, but the company’s shaky fundamentals present too much downside risk. There are more exciting stocks to buy at the moment.
Wall Street analysts have a consensus one-year price target of $94.12 on the company (compared to the current share price of $79.25).
Although the price target is bullish, readers should exercise caution because analysts tend to be overly optimistic. The firms they work for, often big banks, have relationships with companies that extend into fundraising, M&A advisory, and other rewarding business lines. As a result, they typically hesitate to say bad things for fear they will lose out. We at StockStory do not suffer from such conflicts of interest, so we’ll always tell it like it is.