
Worthington (WOR)
Worthington is up against the odds. Its low returns on capital and plummeting sales suggest it struggles to generate demand and profits, a red flag.― StockStory Analyst Team
1. News


2. Summary
Why We Think Worthington Will Underperform
Founded by a steel salesman, Worthington (NYSE:WOR) specializes in steel processing, pressure cylinders, and engineered cabs for commercial markets.
- Products and services are facing significant end-market challenges during this cycle as sales have declined by 14.9% annually over the last five years
- Earnings per share have contracted by 28.8% annually over the last two years, a headwind for returns as stock prices often echo long-term EPS performance
- Low returns on capital reflect management’s struggle to allocate funds effectively, and its falling returns suggest its earlier profit pools are drying up


Worthington’s quality doesn’t meet our hurdle. We’d search for superior opportunities elsewhere.
Why There Are Better Opportunities Than Worthington


Worthington’s stock price of $51.30 implies a valuation ratio of 15.3x forward P/E. Worthington’s multiple may seem like a great deal among industrials peers, but we think there are valid reasons why it’s this cheap.
Cheap stocks can look like great bargains at first glance, but you often get what you pay for. These mediocre businesses often have less earnings power, meaning there is more reliance on a re-rating to generate good returns - an unlikely scenario for low-quality companies.
3. Worthington (WOR) Research Report: Q4 CY2025 Update
Diversified industrial manufacturing company Worthington (NYSE:WOR) reported Q4 CY2025 results topping the market’s revenue expectations, with sales up 19.5% year on year to $327.5 million. Its non-GAAP profit of $0.65 per share was 7.7% below analysts’ consensus estimates.
Worthington (WOR) Q4 CY2025 Highlights:
- Revenue: $327.5 million vs analyst estimates of $310.6 million (19.5% year-on-year growth, 5.4% beat)
- Adjusted EPS: $0.65 vs analyst expectations of $0.70 (7.7% miss)
- Adjusted EBITDA: $60.48 million vs analyst estimates of $62.69 million (18.5% margin, 3.5% miss)
- Operating Margin: 3.7%, up from 1.3% in the same quarter last year
- Free Cash Flow Margin: 11.9%, similar to the same quarter last year
- Market Capitalization: $2.87 billion
Company Overview
Founded by a steel salesman, Worthington (NYSE:WOR) specializes in steel processing, pressure cylinders, and engineered cabs for commercial markets.
The company operates through two primary segments: Consumer Products and Building Products.
The Consumer Products segment offers products for tools, outdoor living, and celebrations markets under various brand names. These include propane-filled cylinders, handheld torches, helium-filled balloon kits, and specialized hand tools and instruments. The Building Products segment focuses on refrigerant and LPG cylinders, well water and expansion tanks, and other specialty products primarily for the gas production and distribution industries.
Acquisitions play a prominent role in the company's growth strategy, and a recent example includes Level 5 Tools, a provider of drywall equipment and related accessories. This acquisition has allowed Worthington to expand its presence in the construction tools market.
Note that Worthington used to have two other businesses, Steel Processing and Sustainable Energy Solutions. The Steel Processing segment was spun off as Worthington Steel (NYSE:WS) in December 2023 while the Sustainable Energy Solutions segment was separated in May 2024. These divestitures were executed so Worthington could focus on its core product lines, and their one-off impacts are reflected in this report's numbers.
4. Engineered Components and Systems
Engineered components and systems companies possess technical know-how in sometimes narrow areas such as metal forming or intelligent robotics. Lately, automation and connected equipment collecting analyzable data have been trending, creating new demand. On the other hand, like the broader industrials sector, engineered components and systems companies are at the whim of economic cycles. Consumer spending and interest rates, for example, can greatly impact the industrial production that drives demand for these companies’ offerings.
Competitors in the metals manufacturing industry include Nucor Corporation (NYSE:NUE), Steel Dynamics (NASDAQ:STLD), and Reliance Steel & Aluminum (NYSE:RS).
5. Revenue Growth
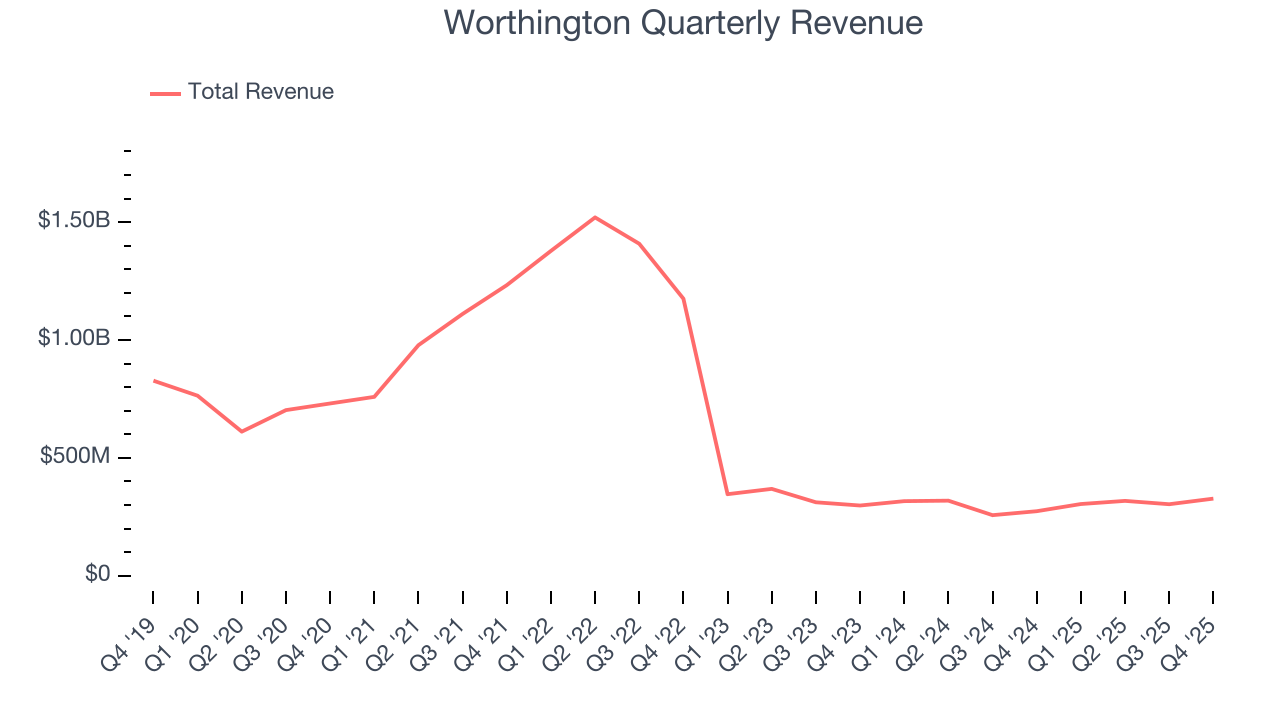
A company’s long-term performance is an indicator of its overall quality. Any business can put up a good quarter or two, but the best consistently grow over the long haul. Worthington struggled to consistently generate demand over the last five years as its sales dropped at a 14.9% annual rate. This wasn’t a great result and is a sign of poor business quality.
Long-term growth is the most important, but within industrials, a half-decade historical view may miss new industry trends or demand cycles. Worthington’s annualized revenue declines of 2.7% over the last two years suggest its demand continued shrinking. 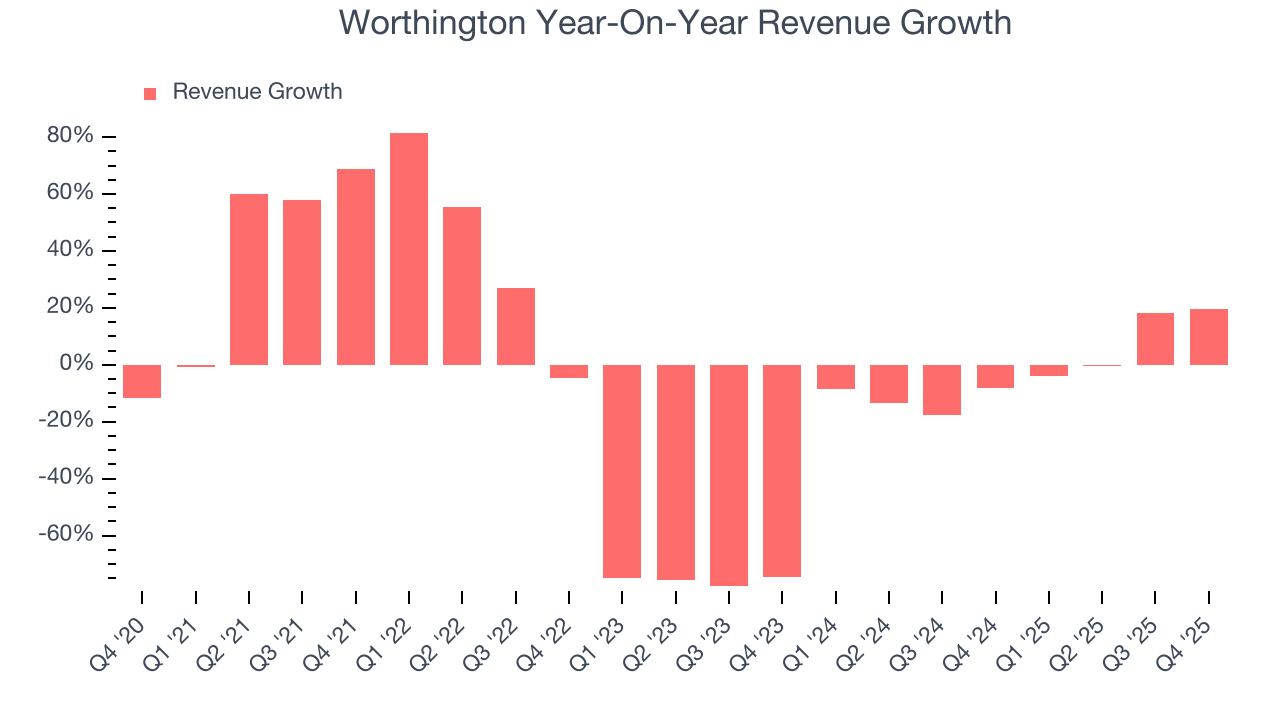
We can dig further into the company’s revenue dynamics by analyzing its most important segments, Consumer Products and Building Products, which are 36.6% and 63.4% of revenue. Over the last two years, Worthington’s Consumer Products revenue (cylinders, torches, balloon kits, tools) was flat while its Building Products revenue (refrigerant, cylinders, tanks) averaged 7.2% year-on-year growth. 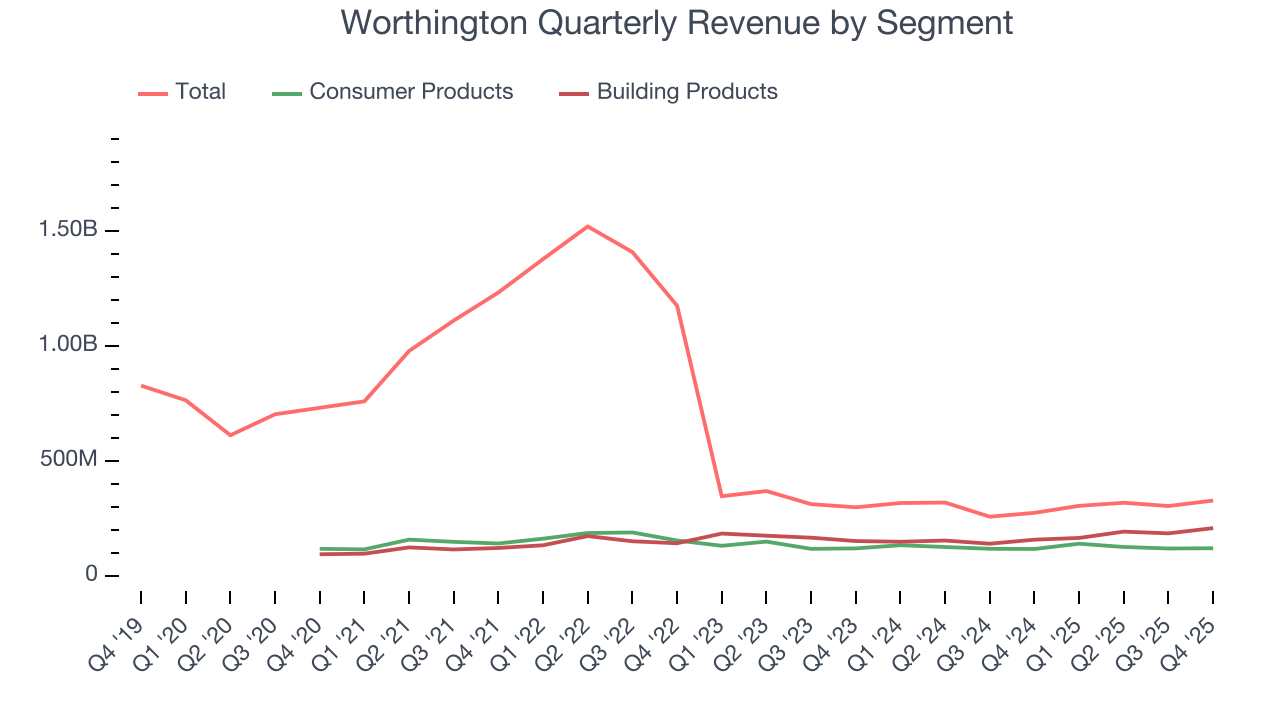
This quarter, Worthington reported year-on-year revenue growth of 19.5%, and its $327.5 million of revenue exceeded Wall Street’s estimates by 5.4%.
Looking ahead, sell-side analysts expect revenue to grow 6.7% over the next 12 months. While this projection suggests its newer products and services will spur better top-line performance, it is still below the sector average.
6. Gross Margin & Pricing Power
All else equal, we prefer higher gross margins because they usually indicate that a company sells more differentiated products and commands stronger pricing power.
Worthington has bad unit economics for an industrials business, signaling it operates in a competitive market. As you can see below, it averaged a 17.5% gross margin over the last five years. Said differently, Worthington had to pay a chunky $82.54 to its suppliers for every $100 in revenue. 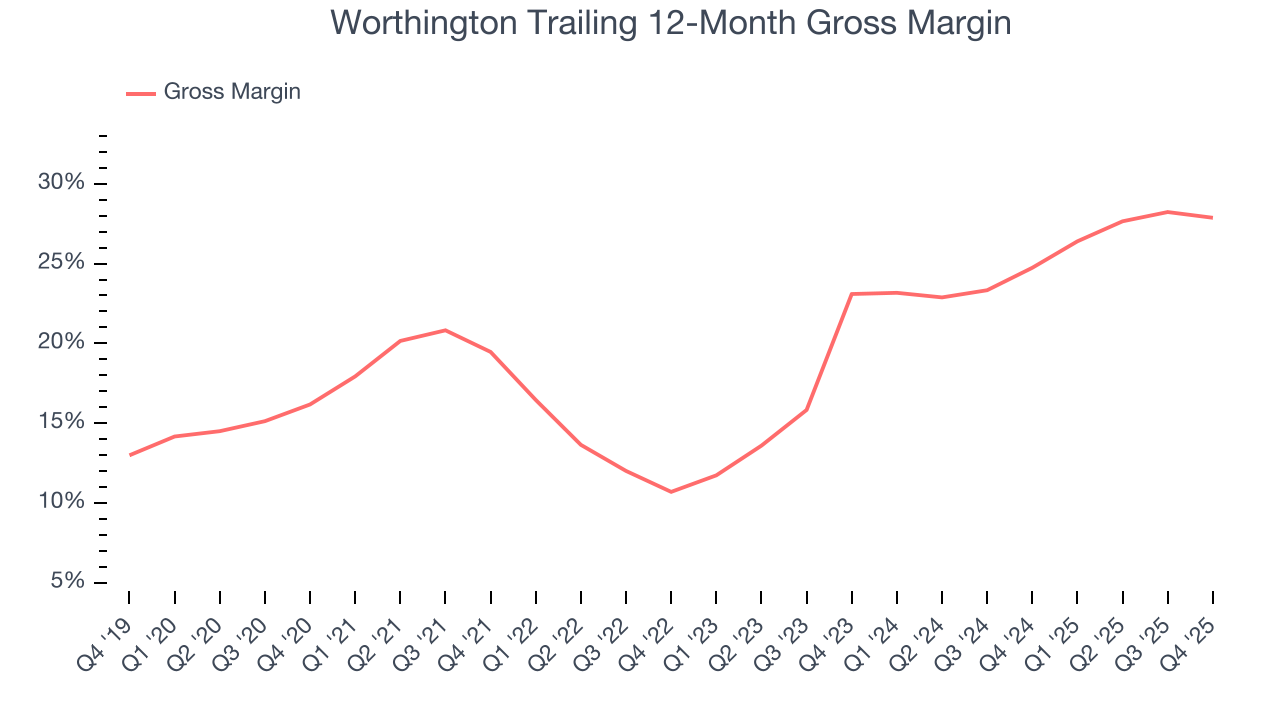
Worthington’s gross profit margin came in at 25.8% this quarter, down 1.2 percentage points year on year. Zooming out, however, Worthington’s full-year margin has been trending up over the past 12 months, increasing by 3.1 percentage points. If this move continues, it could suggest better unit economics due to more leverage from its growing sales on the fixed portion of its cost of goods sold (such as manufacturing expenses).
7. Operating Margin
Worthington was profitable over the last five years but held back by its large cost base. Its average operating margin of 3.8% was weak for an industrials business. This result isn’t too surprising given its low gross margin as a starting point.
Looking at the trend in its profitability, Worthington’s operating margin decreased by 8.5 percentage points over the last five years. Worthington’s performance was poor no matter how you look at it - it shows that costs were rising and it couldn’t pass them onto its customers.
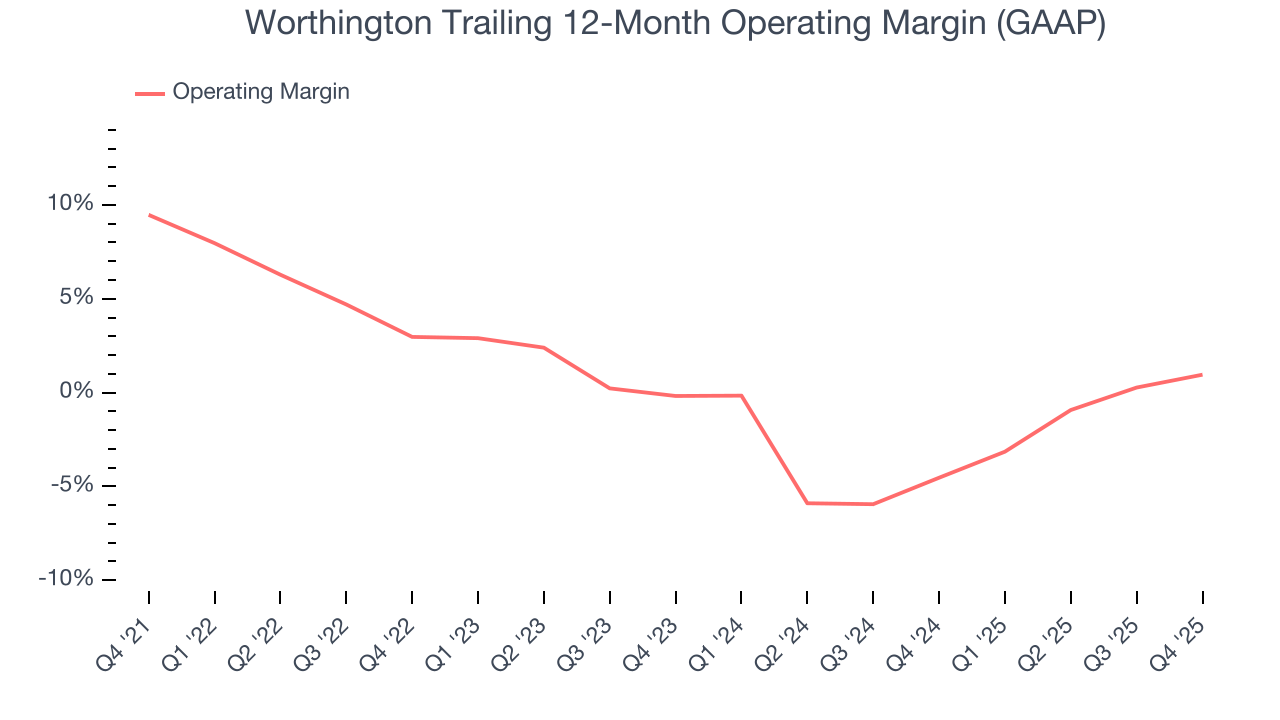
This quarter, Worthington generated an operating margin profit margin of 3.7%, up 2.5 percentage points year on year. The increase was encouraging, and because its gross margin actually decreased, we can assume it was more efficient because its operating expenses like marketing, R&D, and administrative overhead grew slower than its revenue.
8. Earnings Per Share
Revenue trends explain a company’s historical growth, but the long-term change in earnings per share (EPS) points to the profitability of that growth – for example, a company could inflate its sales through excessive spending on advertising and promotions.
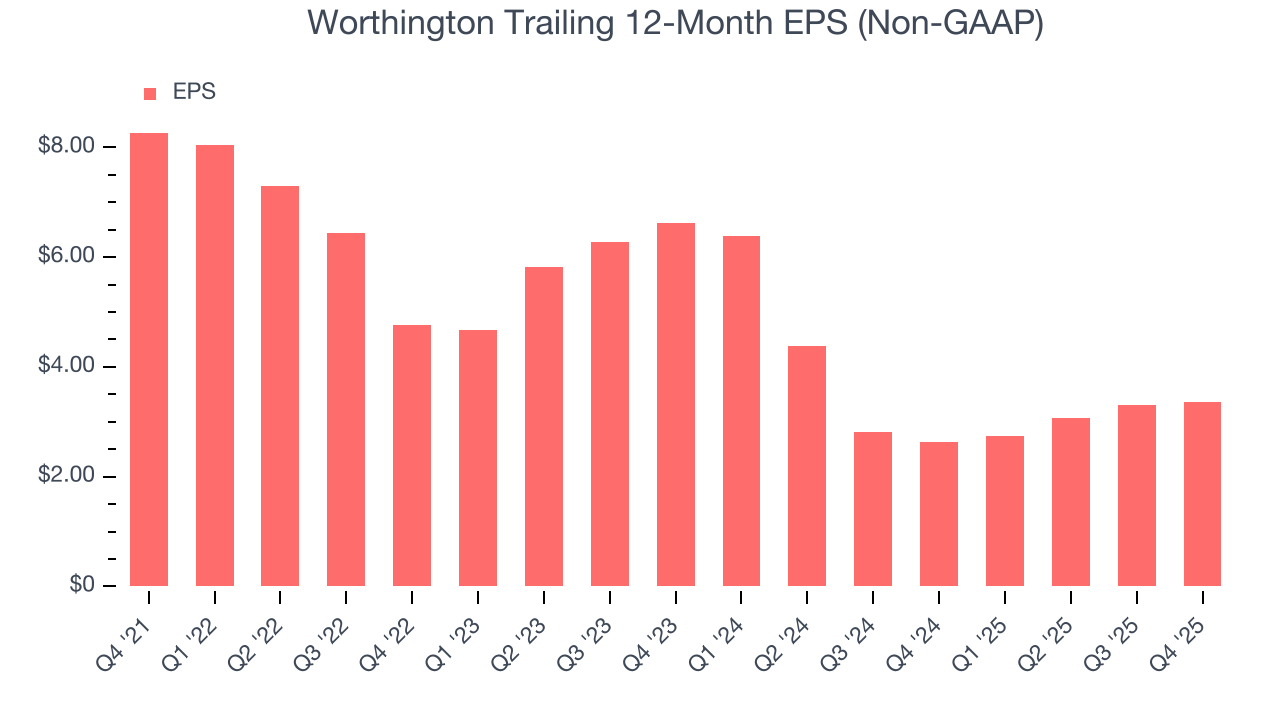
Worthington’s EPS grew at a decent 8.8% compounded annual growth rate over the last five years, higher than its 14.9% annualized revenue declines. However, this alone doesn’t tell us much about its business quality because its operating margin didn’t improve.
We can take a deeper look into Worthington’s earnings quality to better understand the drivers of its performance. A five-year view shows that Worthington has repurchased its stock, shrinking its share count by 6.1%. This tells us its EPS outperformed its revenue not because of increased operational efficiency but financial engineering, as buybacks boost per share earnings. 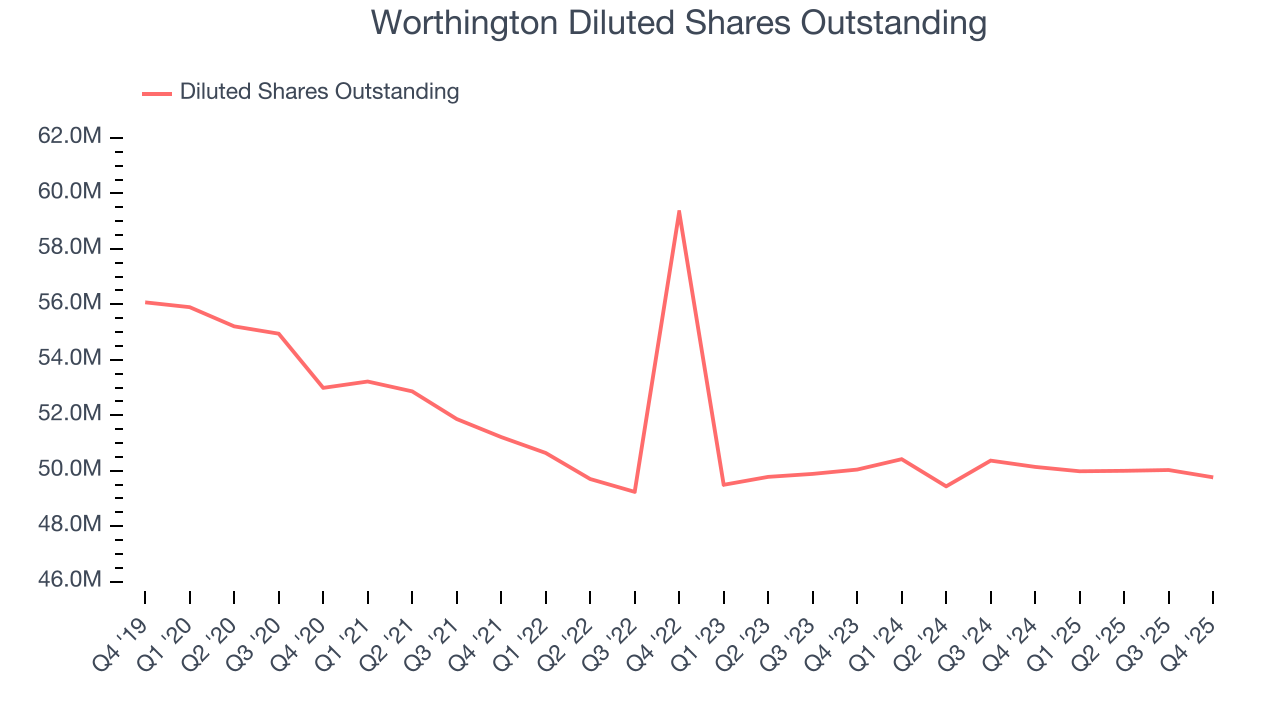
Like with revenue, we analyze EPS over a more recent period because it can provide insight into an emerging theme or development for the business.
For Worthington, its two-year annual EPS declines of 28.8% mark a reversal from its five-year trend. We hope Worthington can return to earnings growth in the future.
In Q4, Worthington reported adjusted EPS of $0.65, up from $0.60 in the same quarter last year. Despite growing year on year, this print missed analysts’ estimates, but we care more about long-term adjusted EPS growth than short-term movements. Over the next 12 months, Wall Street expects Worthington’s full-year EPS of $3.36 to grow 12.4%.
9. Cash Is King
Free cash flow isn't a prominently featured metric in company financials and earnings releases, but we think it's telling because it accounts for all operating and capital expenses, making it tough to manipulate. Cash is king.
Worthington has shown decent cash profitability, giving it some flexibility to reinvest or return capital to investors. The company’s free cash flow margin averaged 7.2% over the last five years, slightly better than the broader industrials sector.
Taking a step back, we can see that Worthington’s margin expanded by 17.7 percentage points during that time. This is encouraging, and we can see it became a less capital-intensive business because its free cash flow profitability rose while its operating profitability fell.
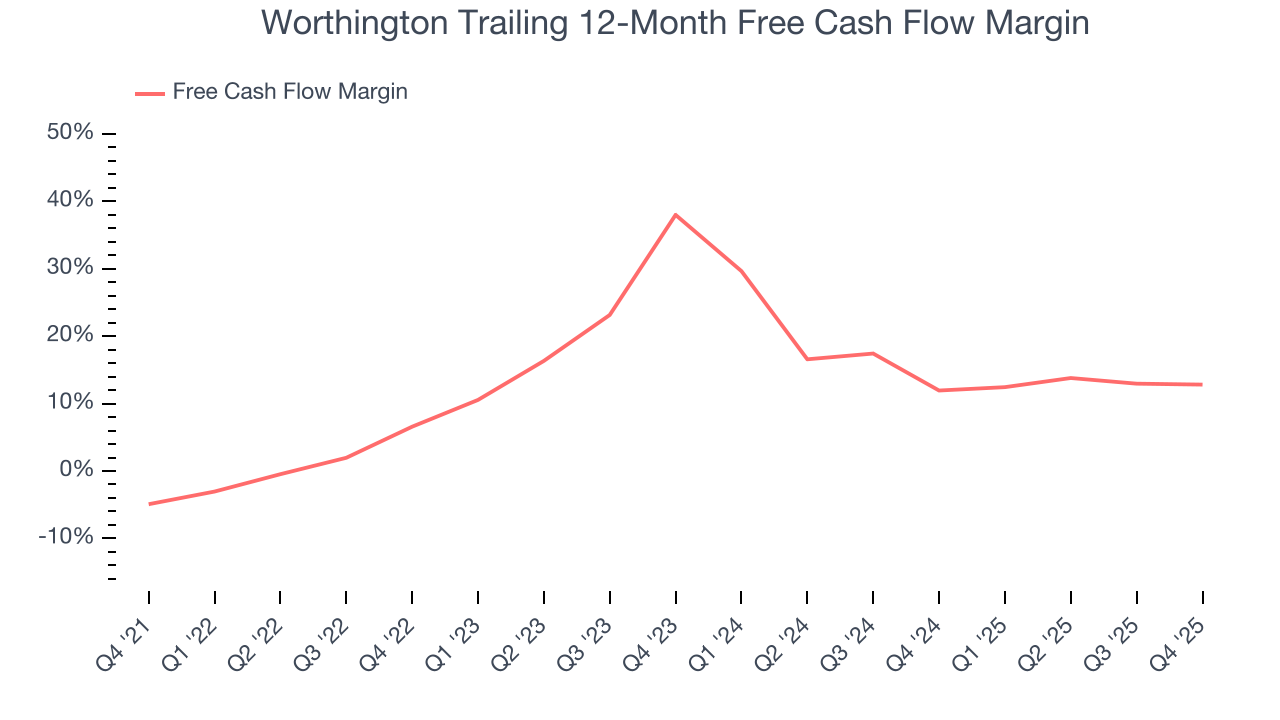
Worthington’s free cash flow clocked in at $39.09 million in Q4, equivalent to a 11.9% margin. This cash profitability was in line with the comparable period last year and above its five-year average.
10. Return on Invested Capital (ROIC)
EPS and free cash flow tell us whether a company was profitable while growing its revenue. But was it capital-efficient? A company’s ROIC explains this by showing how much operating profit it makes compared to the money it has raised (debt and equity).
Worthington historically did a mediocre job investing in profitable growth initiatives. Its five-year average ROIC was 1%, lower than the typical cost of capital (how much it costs to raise money) for industrials companies.
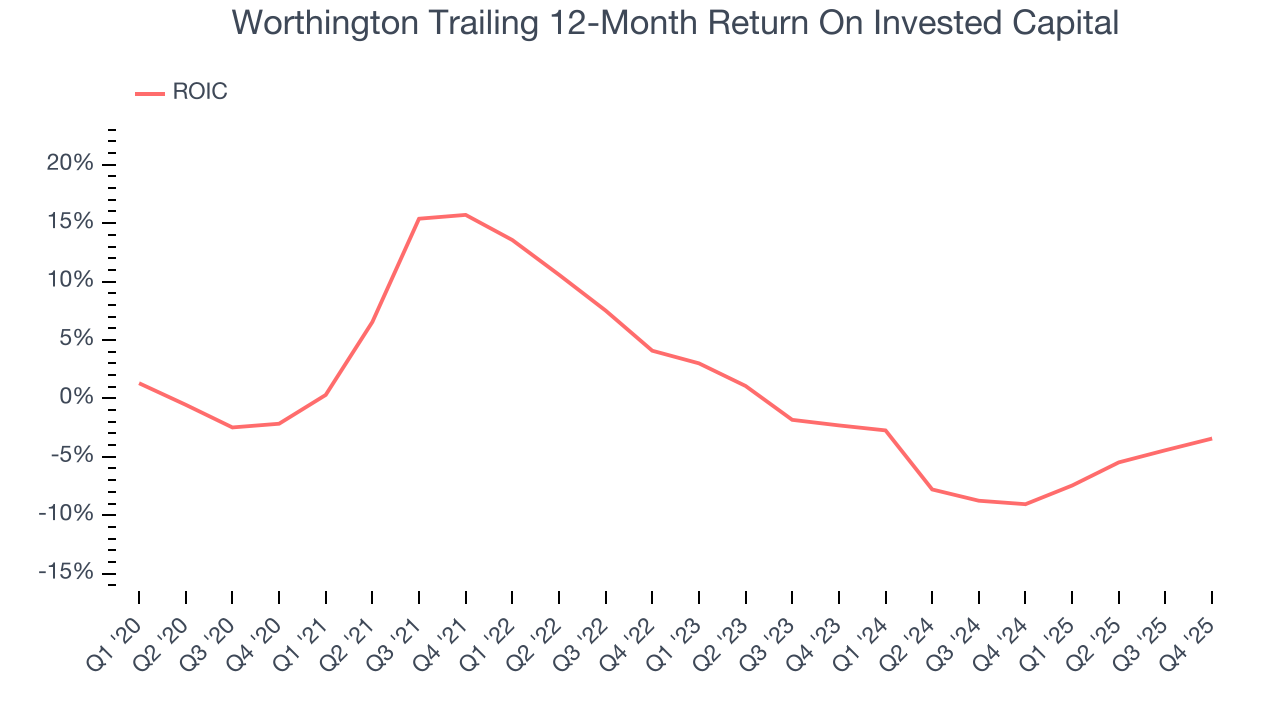
We like to invest in businesses with high returns, but the trend in a company’s ROIC is what often surprises the market and moves the stock price. Over the last few years, Worthington’s ROIC has unfortunately decreased significantly. Paired with its already low returns, these declines suggest its profitable growth opportunities are few and far between.
11. Balance Sheet Assessment
Worthington reported $180.3 million of cash and $345.7 million of debt on its balance sheet in the most recent quarter. As investors in high-quality companies, we primarily focus on two things: 1) that a company’s debt level isn’t too high and 2) that its interest payments are not excessively burdening the business.
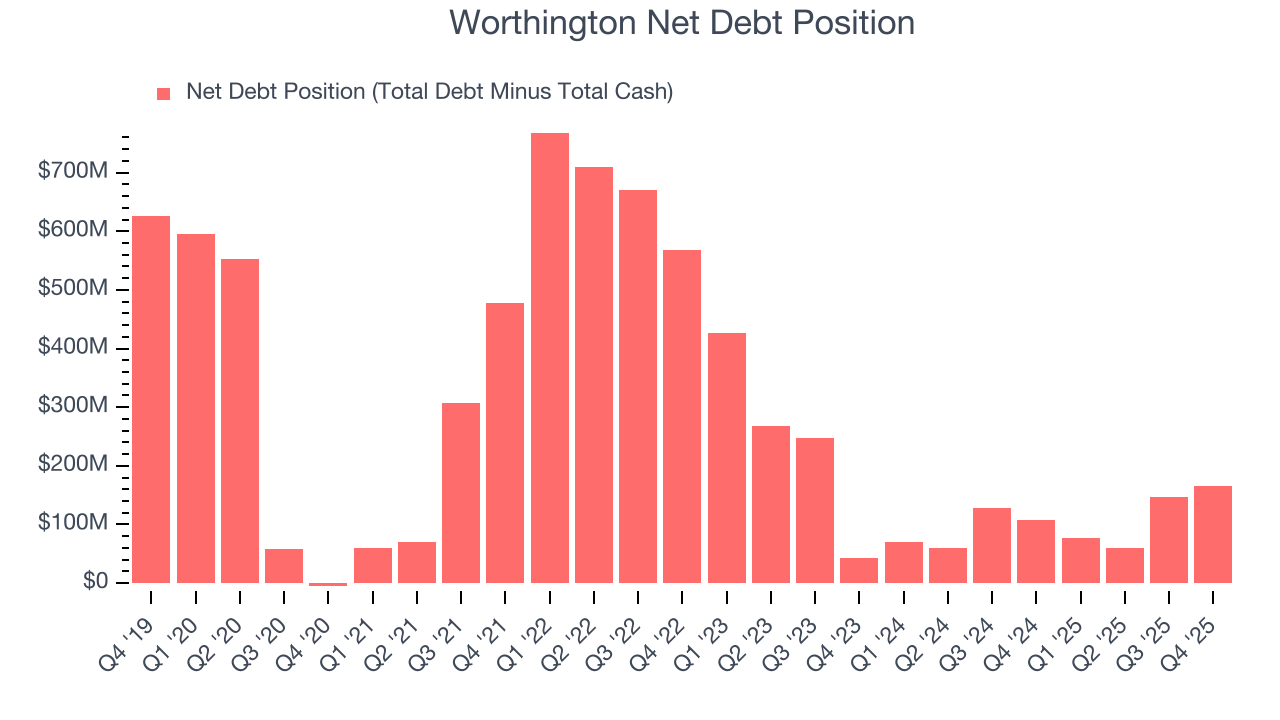
With $157.8 million of EBITDA over the last 12 months, we view Worthington’s 1.0× net-debt-to-EBITDA ratio as safe. We also see its $2.10 million of annual interest expenses as appropriate. The company’s profits give it plenty of breathing room, allowing it to continue investing in growth initiatives.
12. Key Takeaways from Worthington’s Q4 Results
We were impressed by how significantly Worthington blew past analysts’ revenue expectations this quarter. We were also glad its Building Products revenue topped Wall Street’s estimates. On the other hand, its EPS missed and its EBITDA fell short of Wall Street’s estimates. Overall, this quarter could have been better. The stock traded down 7.7% to $51.96 immediately following the results.
13. Is Now The Time To Buy Worthington?
Updated: December 16, 2025 at 10:34 PM EST
A common mistake we notice when investors are deciding whether to buy a stock or not is that they simply look at the latest earnings results. Business quality and valuation matter more, so we urge you to understand these dynamics as well.
We cheer for all companies making their customers lives easier, but in the case of Worthington, we’ll be cheering from the sidelines. First off, its revenue has declined over the last five years. And while its rising cash profitability gives it more optionality, the downside is its diminishing returns show management's prior bets haven't worked out. On top of that, its relatively low ROIC suggests management has struggled to find compelling investment opportunities.
Worthington’s P/E ratio based on the next 12 months is 15.3x. This valuation is reasonable, but the company’s shaky fundamentals present too much downside risk. There are superior stocks to buy right now.
Wall Street analysts have a consensus one-year price target of $68.20 on the company (compared to the current share price of $51.30).
Although the price target is bullish, readers should exercise caution because analysts tend to be overly optimistic. The firms they work for, often big banks, have relationships with companies that extend into fundraising, M&A advisory, and other rewarding business lines. As a result, they typically hesitate to say bad things for fear they will lose out. We at StockStory do not suffer from such conflicts of interest, so we’ll always tell it like it is.