
W. R. Berkley (WRB)
W. R. Berkley is intriguing. Its elite revenue growth and returns on capital demonstrate it can grow rapidly and profitably.― StockStory Analyst Team
1. News


2. Summary
Why W. R. Berkley Is Interesting
Founded in 1967 and operating through more than 50 specialized insurance units across the globe, W. R. Berkley (NYSE:WRB) underwrites commercial insurance and reinsurance through specialized subsidiaries serving industries from healthcare to construction to transportation.
- Additional sales over the last five years increased its profitability as the 33% annual growth in its earnings per share outpaced its revenue
- Stellar return on equity showcases management’s ability to surface highly profitable business ventures
- On the other hand, its estimated sales growth of 4.4% for the next 12 months implies demand will slow from its two-year trend


W. R. Berkley has some noteworthy aspects. We’d wait until its quality rises or its price falls.
Why Should You Watch W. R. Berkley


W. R. Berkley’s stock price of $65.20 implies a valuation ratio of 2.2x forward P/B. The rich valuation multiple means there is a lot of good news priced into the stock; short-term price swings could result if anything bursts that bubble.
W. R. Berkley could improve its business quality by stringing together a few solid quarters. We’d be more open to buying the stock when that time comes.
3. W. R. Berkley (WRB) Research Report: Q4 CY2025 Update
Property casualty insurer W. R. Berkley (NYSE:WRB) missed Wall Street’s revenue expectations in Q4 CY2025 as sales only rose 1.5% year on year to $3.72 billion. Its non-GAAP profit of $1.13 per share was in line with analysts’ consensus estimates.
W. R. Berkley (WRB) Q4 CY2025 Highlights:
- Net Premiums Earned: $3.18 billion vs analyst estimates of $3.19 billion (5.6% year-on-year growth, in line)
- Revenue: $3.72 billion vs analyst estimates of $3.75 billion (1.5% year-on-year growth, 0.8% miss)
- Combined Ratio: 89.4% vs analyst estimates of 90.3% (94.3 basis point beat)
- Adjusted EPS: $1.13 vs analyst estimates of $1.12 (in line)
- Book Value per Share: $25.72 vs analyst estimates of $27.51 (16.4% year-on-year growth, 6.5% miss)
- Market Capitalization: $25.51 billion
Company Overview
Founded in 1967 and operating through more than 50 specialized insurance units across the globe, W. R. Berkley (NYSE:WRB) underwrites commercial insurance and reinsurance through specialized subsidiaries serving industries from healthcare to construction to transportation.
W. R. Berkley operates through two main segments: Insurance and Reinsurance & Monoline Excess. The Insurance segment, which forms the bulk of its business, provides commercial and specialty personal lines coverage through a decentralized structure of specialized units. These units are organized into four main categories: Excess & Surplus Lines for complex or unique risks; Industry Specialty for sector-specific coverage; Product Specialty for specific insurance lines like workers' compensation; and Regional units serving local markets across the United States.
For example, a construction company might work with Berkley Construction Solutions for excess liability coverage, while a technology firm could obtain cyber risk protection through Berkley Cyber Risk Solutions. This specialized approach allows the company to tailor its underwriting to specific risk profiles rather than offering one-size-fits-all policies.
The company's Reinsurance & Monoline Excess segment provides reinsurance to other insurance companies, helping them manage their risk exposure. Through this segment, W. R. Berkley essentially insures other insurers, taking on portions of their risk in exchange for premiums.
W. R. Berkley has a global footprint, writing business in more than 60 countries with offices in 43 cities outside the United States. The company distributes its products primarily through independent agents, brokers, and wholesale channels, with each business unit maintaining autonomy to respond to local market conditions. This decentralized structure allows the company to adapt quickly to changing market dynamics while maintaining specialized expertise in numerous niches of the insurance market.
4. Property & Casualty Insurance
Property & Casualty (P&C) insurers protect individuals and businesses against financial loss from damage to property or from legal liability. This is a cyclical industry, and the sector benefits when there is 'hard market', characterized by strong premium rate increases that outpace loss and cost inflation, resulting in robust underwriting margins. The opposite is true in a 'soft market'. Interest rates also matter, as they determine the yields earned on fixed-income portfolios. On the other hand, P&C insurers face a major secular headwind from the increasing frequency and severity of catastrophe losses due to climate change. Furthermore, the liability side of the business is pressured by 'social inflation'—the trend of rising litigation costs and larger jury awards.
W. R. Berkley competes with other property and casualty insurers including Chubb (NYSE:CB), Travelers (NYSE:TRV), The Hartford (NYSE:HIG), and American International Group (NYSE:AIG). In the reinsurance market, it faces competition from major players such as Swiss Re, Munich Re, and Berkshire Hathaway (NYSE:BRK.A, NYSE:BRK.B).
5. Revenue Growth
In general, insurance companies earn revenue from three primary sources. The first is the core insurance business itself, often called underwriting and represented in the income statement as premiums earned. The second source is investment income from investing the “float” (premiums collected upfront not yet paid out as claims) in assets such as fixed-income assets and equities. The third is fees from various sources such as policy administration, annuities, or other value-added services. Over the last five years, W. R. Berkley grew its revenue at an excellent 12.7% compounded annual growth rate. Its growth surpassed the average insurance company and shows its offerings resonate with customers, a great starting point for our analysis.
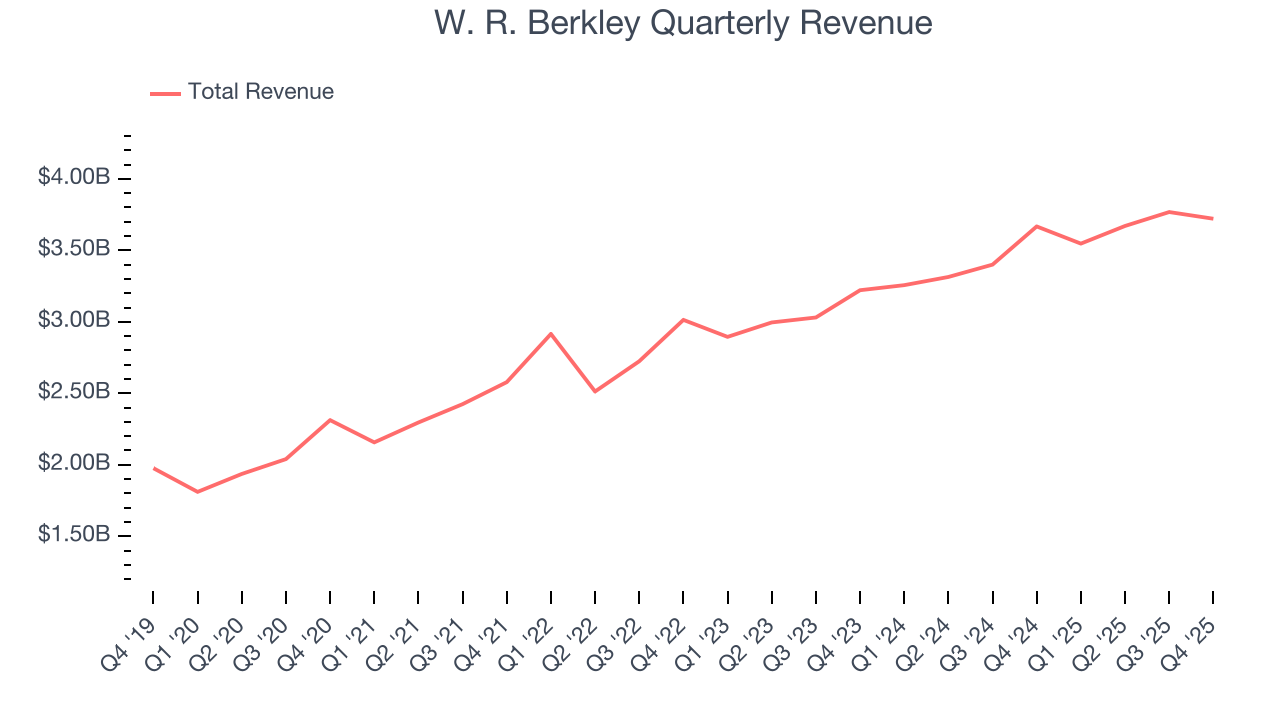
We at StockStory place the most emphasis on long-term growth, but within financials, a half-decade historical view may miss recent interest rate changes, market returns, and industry trends. W. R. Berkley’s annualized revenue growth of 10.1% over the last two years is below its five-year trend, but we still think the results suggest healthy demand. 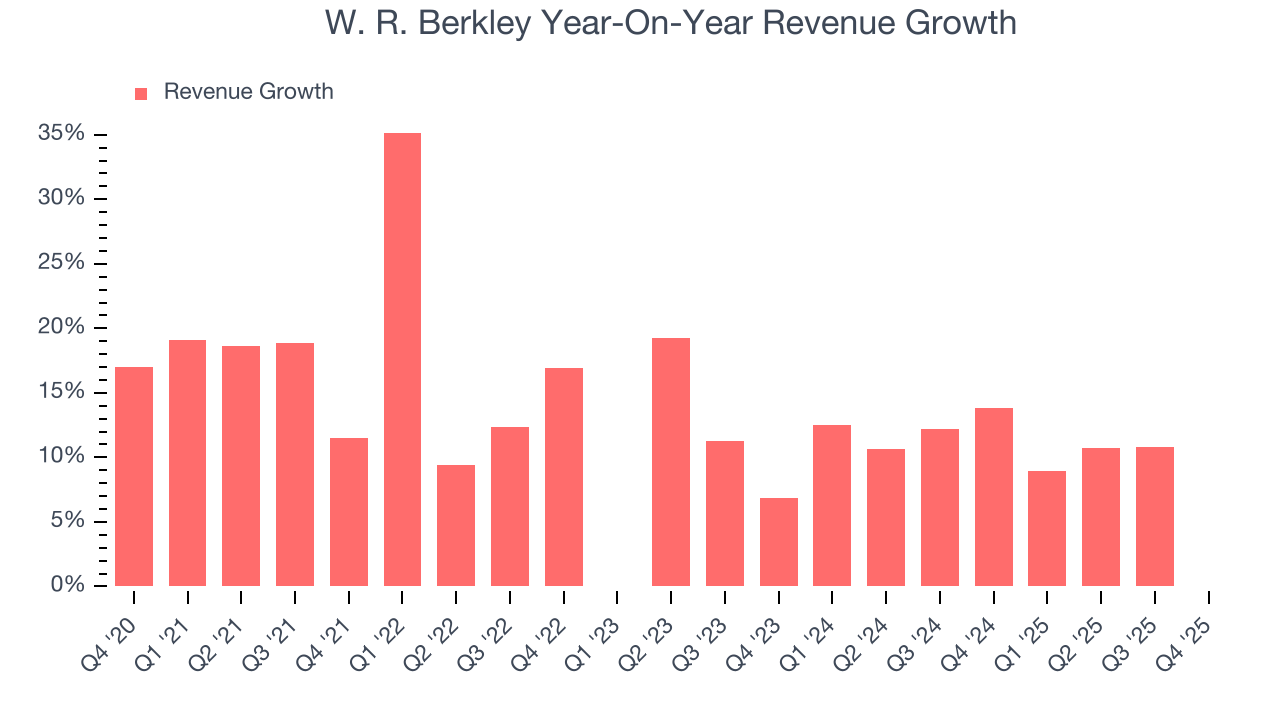 Note: Quarters not shown were determined to be outliers, impacted by outsized investment gains/losses that are not indicative of the recurring fundamentals of the business.
This quarter, W. R. Berkley’s revenue grew by 1.5% year on year to $3.72 billion, falling short of Wall Street’s estimates.
Net premiums earned made up 85.2% of the company’s total revenue during the last five years, meaning W. R. Berkley barely relies on non-insurance activities to drive its overall growth.
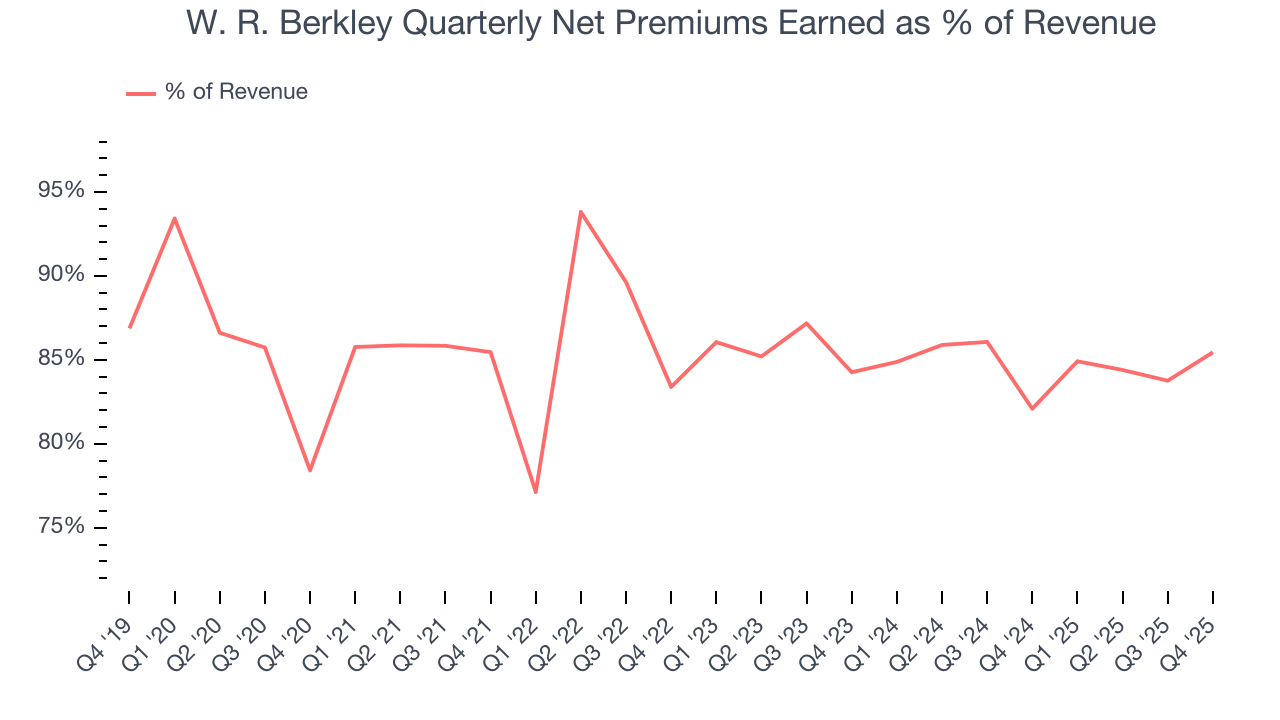
Net premiums earned commands greater market attention due to its reliability and consistency, whereas investment and fee income are often seen as more volatile revenue streams that fluctuate with market conditions.
6. Net Premiums Earned
When insurers sell policies, they protect themselves from extremely large losses or an outsized accumulation of losses with reinsurance (insurance for insurance companies). Net premiums earned are:
- Gross premiums - what’s ceded to reinsurers as a risk mitigation and transfer strategy
W. R. Berkley’s net premiums earned has grown at a 12.4% annualized rate over the last five years, better than the broader insurance industry and in line with its total revenue.
When analyzing W. R. Berkley’s net premiums earned over the last two years, we can see that growth decelerated to 9.4% annually. This performance was similar to its total revenue.
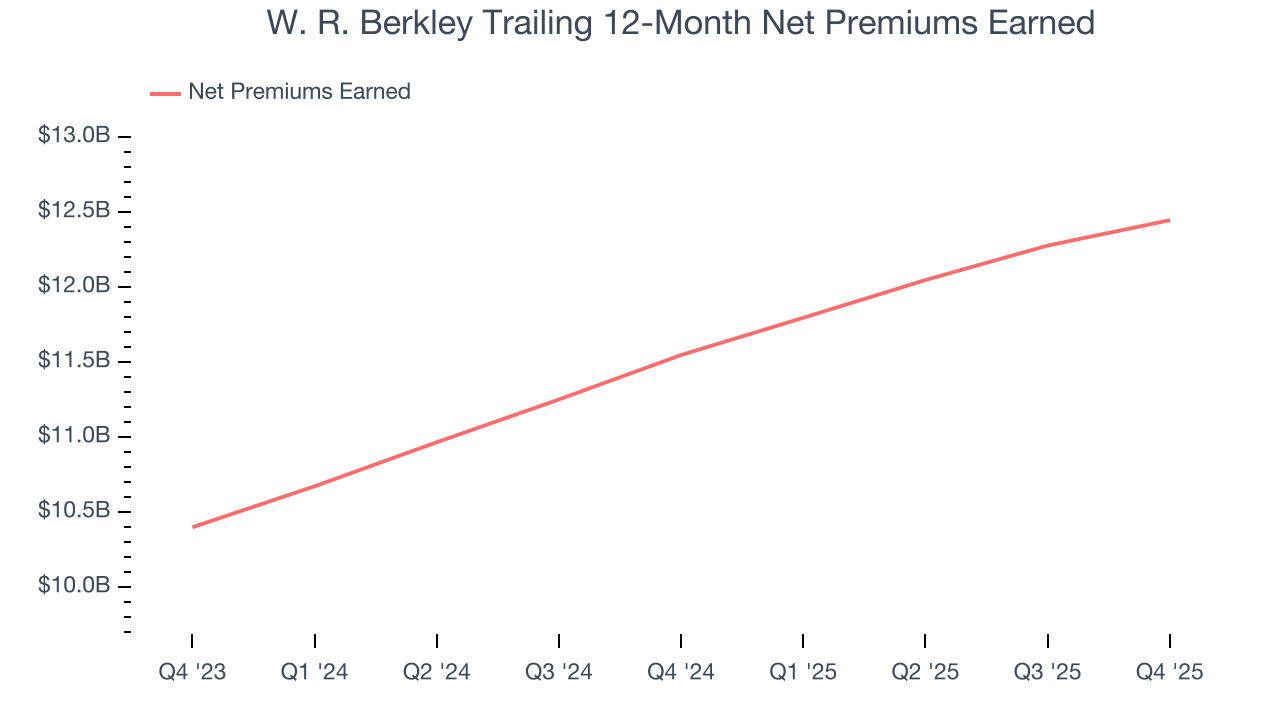
W. R. Berkley’s net premiums earned came in at $3.18 billion this quarter, up 5.6% year on year and in line with Wall Street Consensus estimates.
7. Combined Ratio
Revenue growth is one major determinant of business quality, and the efficiency of operations is another. For insurance companies, we look at the combined ratio rather than the operating expenses and margins that define sectors such as consumer, tech, and industrials.
Combined ratio sums operating costs (salaries, commissions, overhead) with what is paid out in claims (losses) and divides this by net premiums earned. Combined ratios under 100% means profits while ones over 100% mean losses on its core operations of selling insurance policies.
Given the calculation, a lower expense ratio is better. Over the last five years, W. R. Berkley’s combined ratio has swelled by 4.3 percentage points, going from 89.6% to 90.7%. However, fixed cost leverage was muted more recently as the company’s combined ratio was flat on a two-year basis.
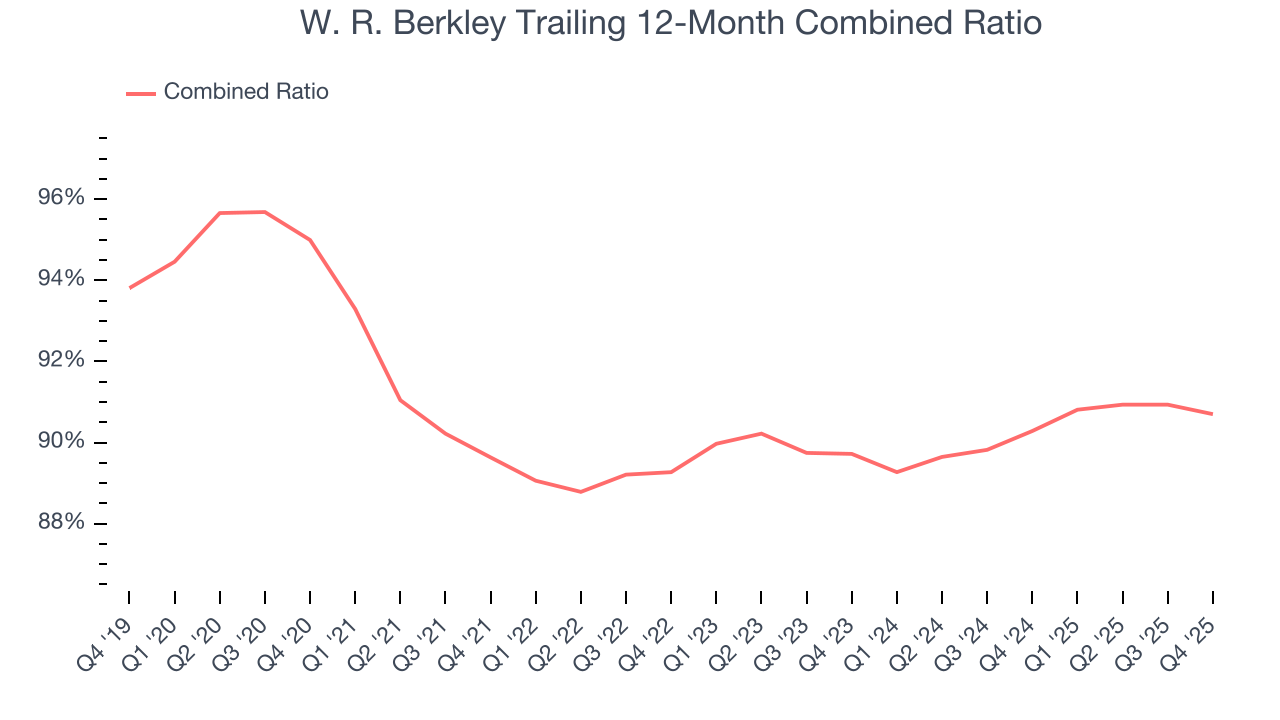
In Q4, W. R. Berkley’s combined ratio was 89.4%, beating analysts’ expectations by 94.3 basis points (100 basis points = 1 percentage point). This result was in line with the same quarter last year.
8. Earnings Per Share
Revenue trends explain a company’s historical growth, but the long-term change in earnings per share (EPS) points to the profitability of that growth – for example, a company could inflate its sales through excessive spending on advertising and promotions.
W. R. Berkley’s EPS grew at an astounding 33% compounded annual growth rate over the last five years, higher than its 12.7% annualized revenue growth. However, this alone doesn’t tell us much about its business quality because its combined ratio didn’t improve.
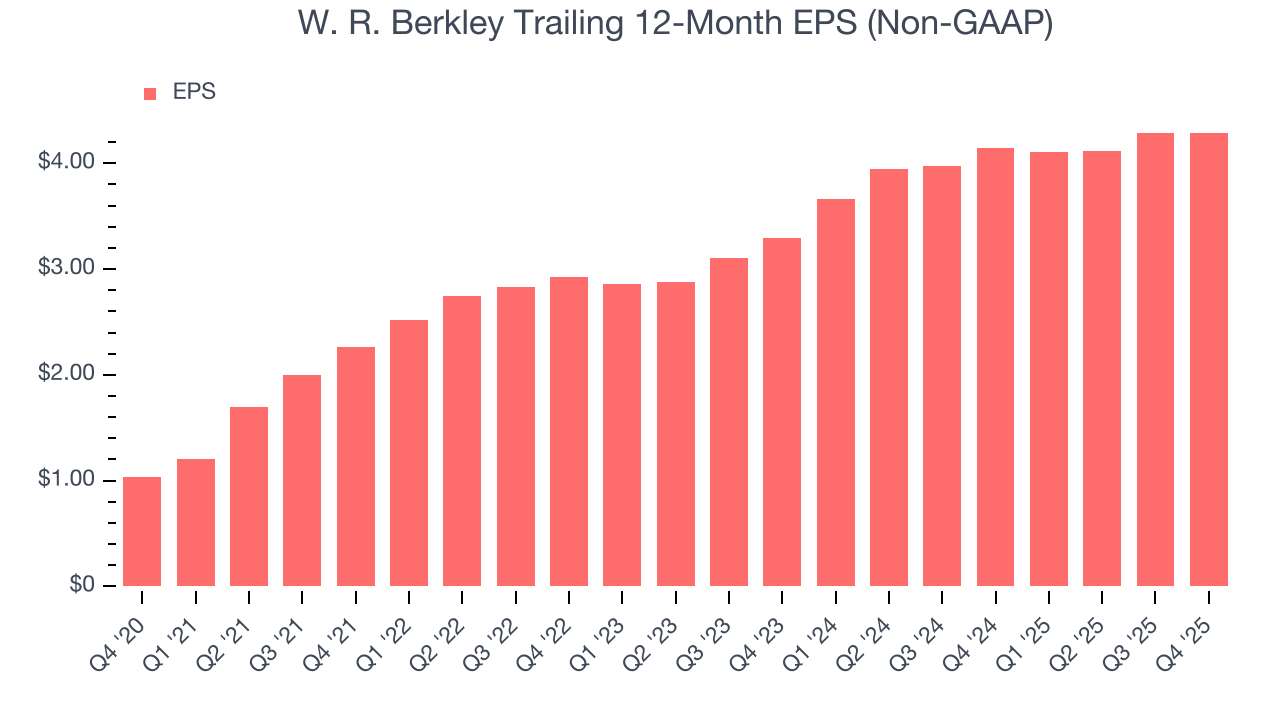
We can take a deeper look into W. R. Berkley’s earnings to better understand the drivers of its performance. As we mentioned earlier, W. R. Berkley’s combined ratio was flat this quarter but improved by 4.3 percentage points over the last five years. On top of that, its share count shrank by 5.2%. These are positive signs for shareholders because improving profitability and share buybacks turbocharge EPS growth relative to revenue growth. 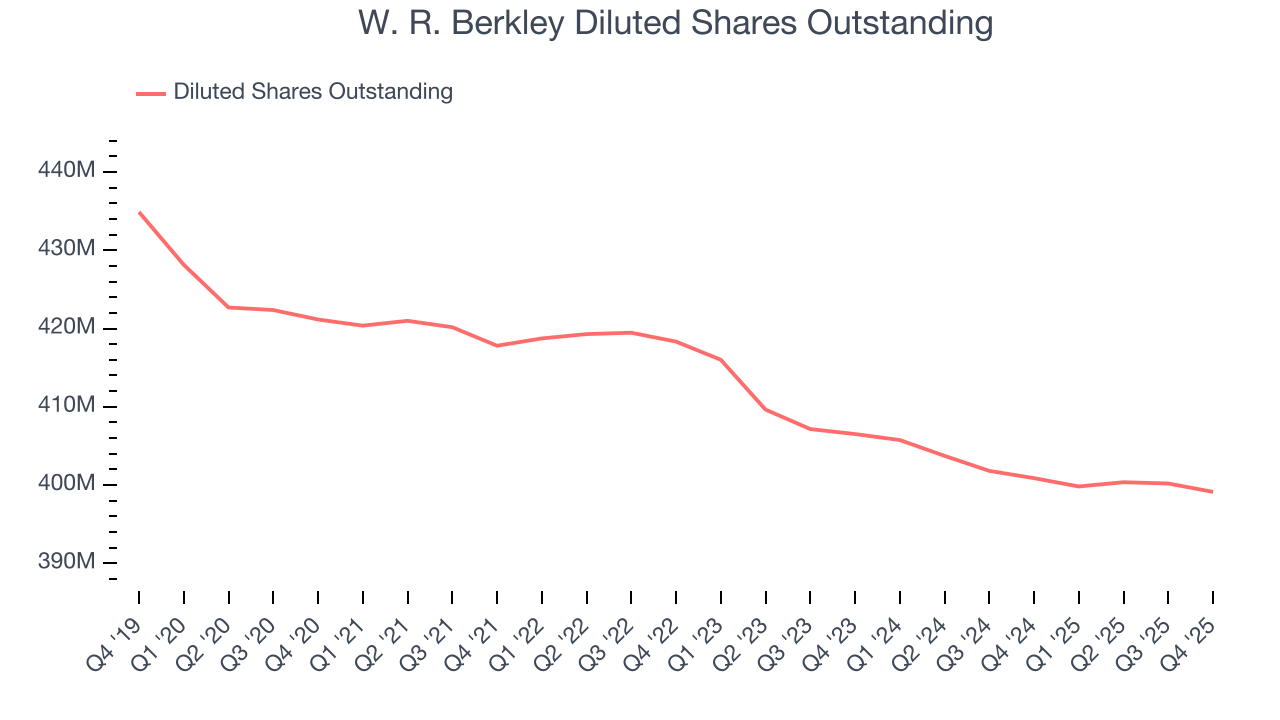
Like with revenue, we analyze EPS over a shorter period to see if we are missing a change in the business.
For W. R. Berkley, its two-year annual EPS growth of 14.1% was lower than its five-year trend. This wasn’t great, but at least the company was successful in other measures of financial health.
In Q4, W. R. Berkley reported adjusted EPS of $1.13, in line with the same quarter last year. This print was close to analysts’ estimates. Over the next 12 months, Wall Street expects W. R. Berkley’s full-year EPS of $4.29 to grow 6.7%.
9. Book Value Per Share (BVPS)
Insurers are balance sheet businesses, collecting premiums upfront and paying out claims over time. Premiums collected but not yet paid out, often referred to as the float, are invested and create an asset base supported by a liability structure. Book value per share (BVPS) captures this dynamic by measuring these assets (investment portfolio, cash, reinsurance recoverables) less liabilities (claim reserves, debt, future policy benefits). BVPS is essentially the residual value for shareholders.
We therefore consider BVPS very important to track for insurers and a metric that sheds light on business quality because it reflects long-term capital growth and is harder to manipulate than more commonly-used metrics like EPS.
W. R. Berkley’s BVPS grew at a solid 10.3% annual clip over the last five years. BVPS growth has also accelerated recently, growing by 15.2% annually over the last two years from $19.37 to $25.72 per share.
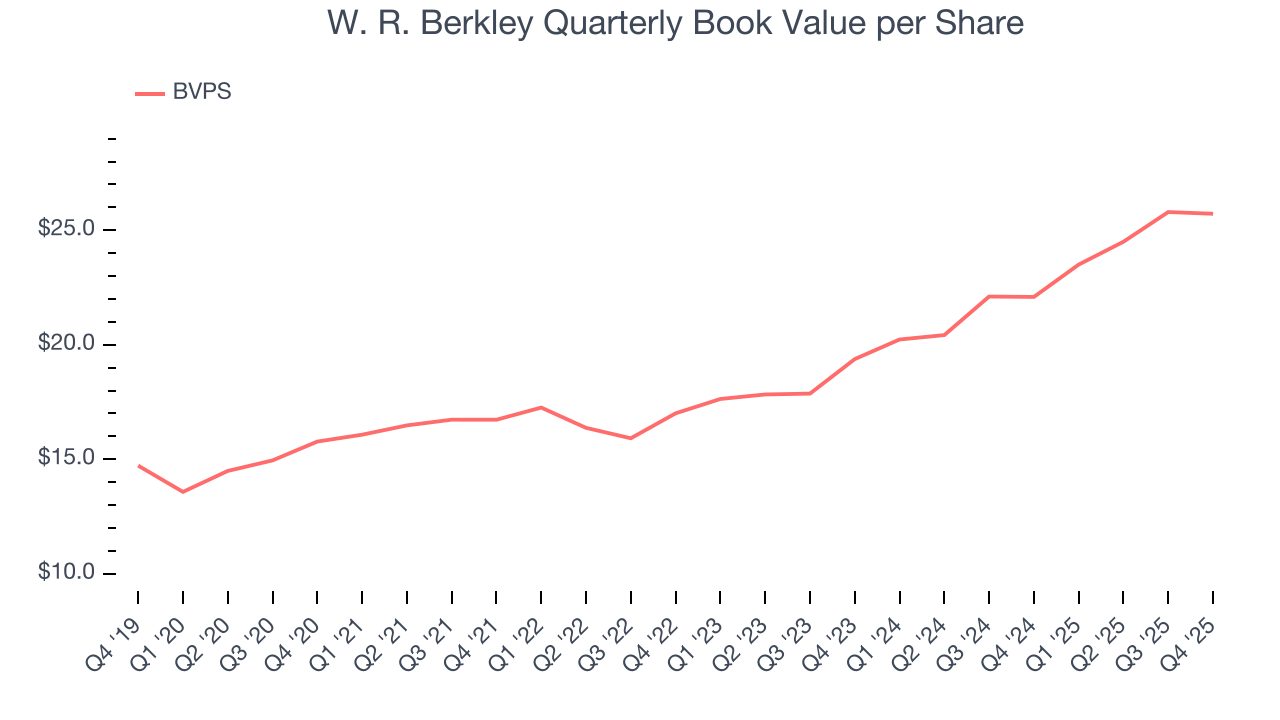
Over the next 12 months, Consensus estimates call for W. R. Berkley’s BVPS to grow by 20% to $27.51, elite growth rate.
10. Balance Sheet Assessment
The debt-to-equity ratio is a widely used measure to assess a company's balance sheet health. A higher ratio means that a business aggressively financed its growth with debt. This can result in higher earnings (if the borrowed funds are invested profitably) but also increases risk.
If debt levels are too high, there could be difficulties in meeting obligations, especially during economic downturns or periods of rising interest rates if the debt has variable-rate payments.
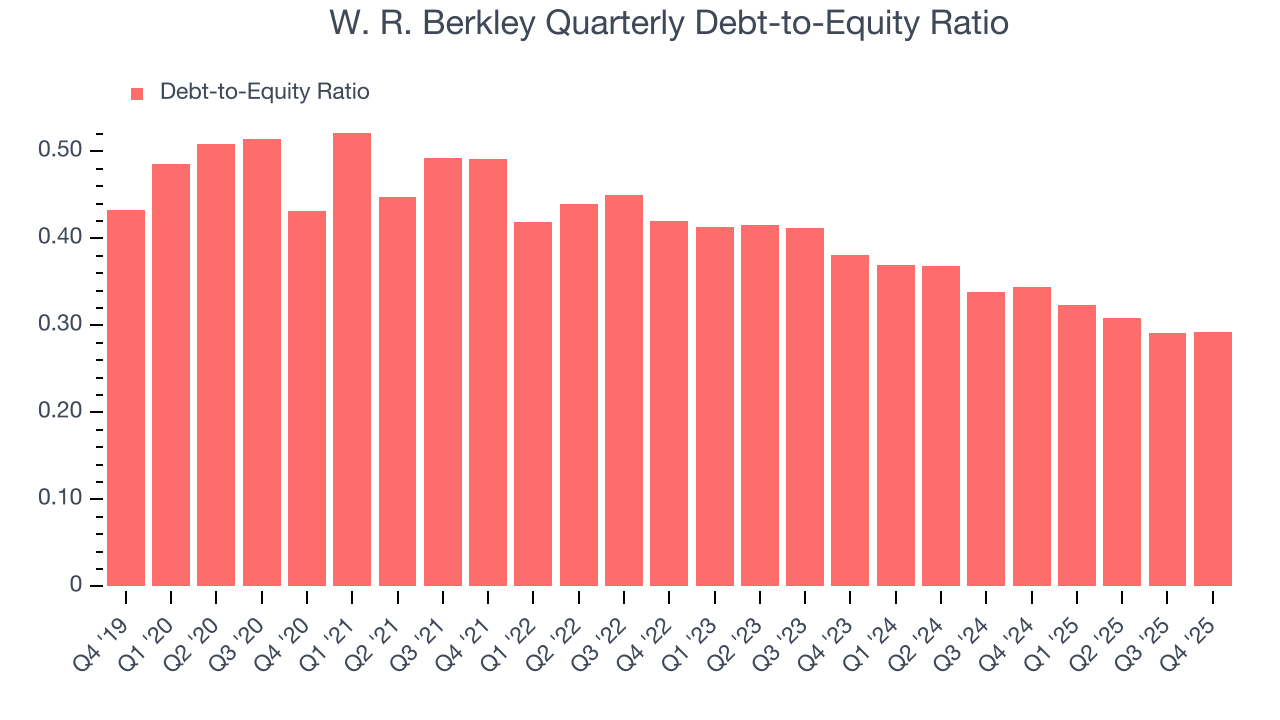
W. R. Berkley currently has $2.84 billion of debt and $9.70 billion of shareholder's equity on its balance sheet, and over the past four quarters, has averaged a debt-to-equity ratio of 0.3×. We think this is safe and raises no red flags. In general, we’re comfortable with any ratio below 1.0× for an insurance business. Anything below 0.5× is a bonus.
11. Return on Equity
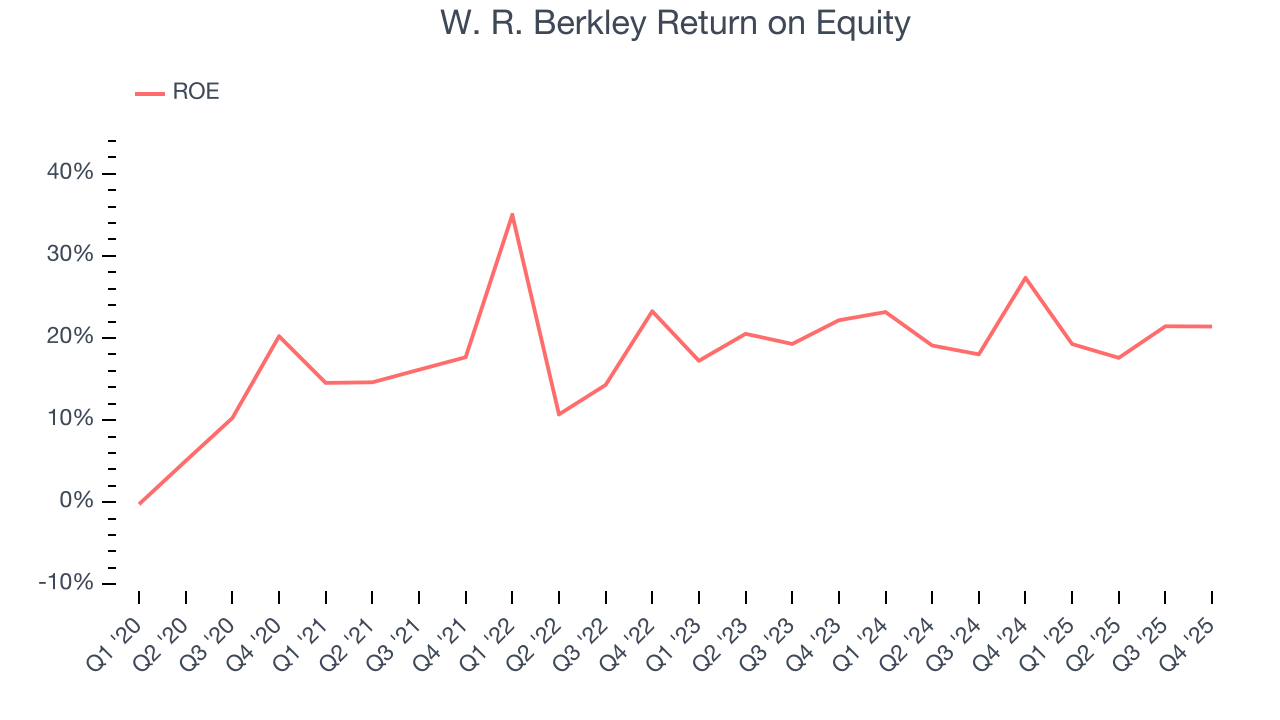
Return on equity (ROE) is a crucial yardstick for insurance companies, measuring their ability to generate returns on the capital provided by shareholders. Insurers that consistently deliver superior ROE tend to create more value for their investors over time through strategic capital allocation and shareholder-friendly policies.
Over the last five years, W. R. Berkley has averaged an ROE of 19.6%, exceptional for a company operating in a sector where the average shakes out around 12.5% and those putting up 20%+ are greatly admired. This shows W. R. Berkley has a strong competitive moat.
12. Key Takeaways from W. R. Berkley’s Q4 Results
We struggled to find many positives in these results. Its book value per share missed and its EPS was in line with Wall Street’s estimates. Overall, this was a softer quarter. The stock remained flat at $67.58 immediately following the results.
13. Is Now The Time To Buy W. R. Berkley?
Updated: March 27, 2026 at 12:42 AM EDT
Before making an investment decision, investors should account for W. R. Berkley’s business fundamentals and valuation in addition to what happened in the latest quarter.
W. R. Berkley possesses a number of positive attributes. First off, its revenue growth was impressive over the last five years. And while its projected EPS for the next year is lacking, its astounding EPS growth over the last five years shows its profits are trickling down to shareholders. On top of that, its stellar ROE suggests it has been a well-run company historically.
W. R. Berkley’s P/B ratio based on the next 12 months is 2.2x. At this valuation, there’s a lot of good news priced in. W. R. Berkley is a good one to add to your watchlist - there are companies featuring superior fundamentals at the moment.
Wall Street analysts have a consensus one-year price target of $68.38 on the company (compared to the current share price of $65.20).