
Universal Display (NASDAQ:OLED) Misses Q1 Sales Targets
Kayode Omotosho /
May 3, 2023
OLED provider Universal Display (NASDAQ:OLED) missed analyst expectations in Q1 FY2023 quarter, with revenue down 13.3% year on year to $130.5 million. Universal Display made a GAAP profit of $39.8 million, down on its profit of $50 million, in the same quarter last year.
Is now the time to buy Universal Display? Access our full analysis of the earnings results here, it's free.
Universal Display (OLED) Q1 FY2023 Highlights:
- Revenue: $130.5 million vs analyst estimates of $135.2 million (3.49% miss)
- EPS: $0.83 vs analyst estimates of $0.81 (2.51% beat)
- The company reconfirmed revenue guidance for the full year, at $575 million at the midpoint
- Free cash flow of $38.5 million, up from negative free cash flow of $8.74 million in previous quarter
- Inventory Days Outstanding: 481, down from 511 previous quarter
- Gross Margin (GAAP): 74.7%, down from 76.7% same quarter last year
“Our first quarter results were in-line with our expectations and we are reaffirming our full year 2023 outlook,” said Brian Millard, Vice President and Chief Financial Officer of Universal Display Corporation.
Serving major consumer electronics manufacturers, Universal Display (NASDAQ:OLED) is a provider of organic light emitting diode (OLED) technologies used in display and lighting applications.
Demand for analog chips is generally linked to the overall level of economic growth, as analog chips serve as the building blocks of most electronic goods and equipment. Unlike digital chip designers, analog chip makers tend to produce the majority of their own chips, as analog chip production does not require expensive leading edge nodes. Less dependent on major secular growth drivers, analog product cycles are much longer, often 5-7 years.
Sales Growth
Universal Display's revenue growth over the last three years has been mediocre, averaging 17.4% annually. But as you can see below, last year quarterly revenue declined from $150.5 million to $130.5 million. Semiconductors are a cyclical industry and long-term investors should be prepared for periods of high growth, followed by periods of revenue contractions (which can sometimes offer opportune times to buy).
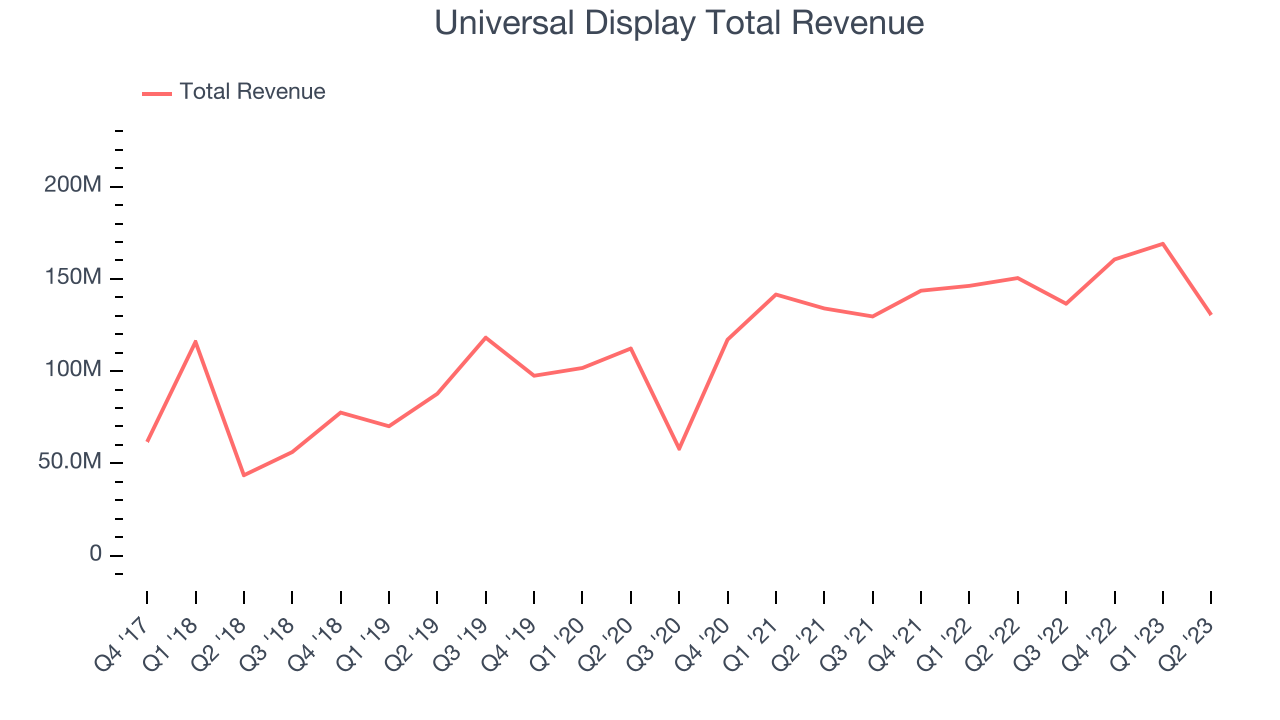
This was a difficult quarter for Universal Display, with revenue declining 13.3%, missing analyst estimates by 3.49%.Universal Display's revenue is continuing to decline, signal that the current downcycle is deepening.
In volatile times like these we look for robust businesses with strong pricing power. Unknown to most investors, this company is one of the highest-quality software companies in the world, and their software products have been the default standard in critical industries for decades. The result is an impressive business that is up an incredible 18,152% since the IPO. You can find it on our platform for free.
Product Demand & Outstanding Inventory
Days Inventory Outstanding (DIO) are an important metric for chipmakers, as it reflects the capital intensity of the business and the cyclical nature of semiconductor supply and demand. In a tight supply environment, inventories tend to be stable, allowing chipmakers to exert pricing power. Steadily increasing DIO can be a warning sign that demand is weak, and if inventories continue to rise the company may have to downsize production.
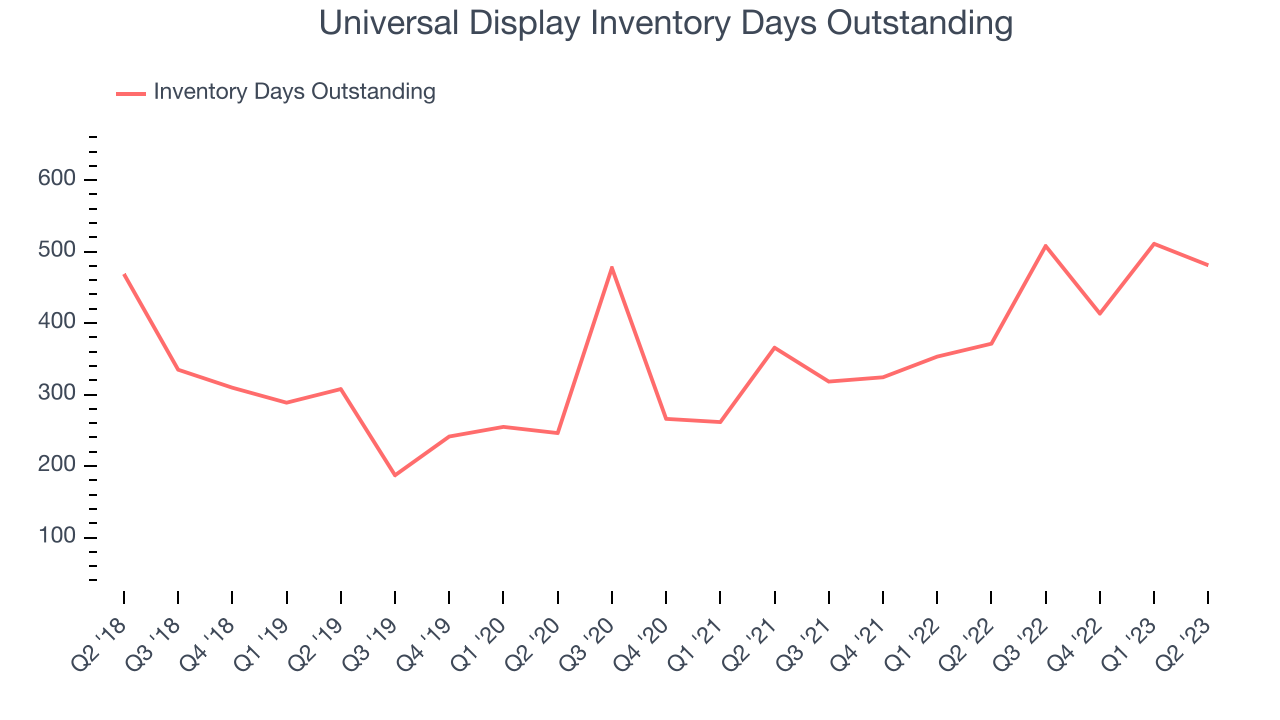
This quarter, Universal Display’s inventory days came in at 481, 140 days above the five year average, suggesting that despite the recent decrease the inventory levels are still higher than what we used to see in the past.
Key Takeaways from Universal Display's Q1 Results
With a market capitalization of $6.2 billion Universal Display is among smaller companies, but its more than $646.1 million in cash and positive free cash flow over the last twelve months give us confidence that Universal Display has the resources it needs to pursue a high growth business strategy.
A strong point from the quarter was Universal Display’s material improvement of its inventory levels and return to free cash flow positive. That feature of these results really stood out as a positive. On the other hand, it was less good to see that the revenue growth was quite weak and it missed analysts' revenue expectations. Overall, it seems to us that this was a complicated quarter for Universal Display. The company is up 2.97% on the results and currently trades at $132.25 per share.
Universal Display may have had a tough quarter, but does that actually create an opportunity to invest right now? It is important that you take into account its valuation and business qualities, as well as what happened in the latest quarter. We look at that in our actionable report which you can read here, it's free.
One way to find opportunities in the market is to watch for generational shifts in the economy. Almost every company is slowly finding itself becoming a technology company and facing cybersecurity risks and as a result, the demand for cloud-native cybersecurity is skyrocketing. This company is leading a massive technological shift in the industry and with revenue growth of 70% year on year and best-in-class SaaS metrics it should definitely be on your radar.
The author has no position in any of the stocks mentioned.