
Interface (TILE)
Interface is interesting. Its skyrocketing ROIC shows its business quality is rising.― StockStory Analyst Team
1. News


2. Summary
Why Interface Is Interesting
Pioneering carbon-neutral flooring since its founding in 1973, Interface (NASDAQ:TILE) is a global manufacturer of modular carpet tiles, luxury vinyl tile (LVT), and rubber flooring that specializes in carbon-neutral and sustainable flooring solutions.
- Additional sales over the last five years increased its profitability as the 11.3% annual growth in its earnings per share outpaced its revenue
- Satisfactory free cash flow margin of 6.7% for the past five years enables it to finance growth initiatives independently, and its improved cash conversion implies it’s becoming a less capital-intensive business
- On a dimmer note, its demand will likely be soft over the next 12 months as Wall Street’s estimates imply tepid growth of 4.3%


Interface shows some promise. If you’re a believer, the price seems fair.
Why Is Now The Time To Buy Interface?


Interface’s stock price of $27.21 implies a valuation ratio of 13.1x forward P/E. Interface’s current multiple might be below that of most business services peers, but we think this valuation is warranted after considering its business quality.
It could be a good time to invest if you see something the market doesn’t.
3. Interface (TILE) Research Report: Q4 CY2025 Update
Modular flooring manufacturer Interface (NASDAQ:TILE) met Wall Street’s revenue expectations in Q4 CY2025, with sales up 4.3% year on year to $349.4 million. The company expects next quarter’s revenue to be around $320 million, slightly above analysts’ estimates. Its non-GAAP profit of $0.49 per share was 21.5% above analysts’ consensus estimates.
Interface (TILE) Q4 CY2025 Highlights:
- Revenue: $349.4 million vs analyst estimates of $348.3 million (4.3% year-on-year growth, in line)
- Adjusted EPS: $0.49 vs analyst estimates of $0.40 (21.5% beat)
- Adjusted EBITDA: $49.8 million vs analyst estimates of $49.86 million (14.3% margin, in line)
- Revenue Guidance for Q1 CY2026 is $320 million at the midpoint, above analyst estimates of $314.6 million
- Operating Margin: 10.1%, up from 8.8% in the same quarter last year
- Market Capitalization: $1.84 billion
Company Overview
Pioneering carbon-neutral flooring since its founding in 1973, Interface (NASDAQ:TILE) is a global manufacturer of modular carpet tiles, luxury vinyl tile (LVT), and rubber flooring that specializes in carbon-neutral and sustainable flooring solutions.
Interface's product portfolio spans three main categories: modular carpet tiles (sold under the Interface and FLOR brands), luxury vinyl tile, and rubber flooring (marketed under the noraplan and norament brands acquired from nora in 2018). The company has developed innovative backing technologies like CQuest, which incorporates bio-based materials and recycled content to create products that are net carbon negative when measured on a standalone basis.
The company serves diverse commercial markets including corporate offices, healthcare facilities, educational institutions, hospitality venues, and retail spaces, as well as residential customers. For example, a hospital might choose Interface's antimicrobial carpet tiles for patient rooms and corridors, while using its durable rubber flooring in operating rooms where chemical resistance is crucial.
Interface generates revenue through two primary channels: direct sales to end users and indirect sales through contractors, installers, and distributors. The company's business model emphasizes customization, with a significant portion of sales being made-to-order products designed to customer specifications. Interface's manufacturing capabilities allow it to produce custom samples in less than five days, giving it a competitive edge in securing projects.
The company operates through two geographical segments: Americas (including the United States, Canada, and Latin America) and EAAA (Europe, Africa, Asia, and Australia). Interface maintains showrooms and design studios across the globe to support its international marketing efforts and showcase its products to architects, designers, and end users.
4. Office & Commercial Furniture
The sector faces a tepid outlook as workplace dynamics continue to evolve. Hybrid work means that enterprise demand for office furniture is lower. Consumer demand for the same products likely will not offset the loss from enterprises, as individual workers tend to have less space and need for the sector's wares. The Trump administration also possesses a high willingness to impose tariffs on key partners, which could result in retaliatory actions, all of which could pressure those selling furniture that may feature components or labor from overseas. Lastly, the COVID-19 pandemic showed that there is always a risk that something disrupts supply chains, and companies need contingency plans for this.
Interface competes with major flooring manufacturers including Mohawk Industries (NYSE:MHK), Shaw Industries (a subsidiary of Berkshire Hathaway, NYSE:BRK.A), Tarkett (EPA:TKTT), Armstrong Flooring, and Milliken & Company (privately held).
5. Revenue Growth
A company’s long-term performance is an indicator of its overall quality. Any business can put up a good quarter or two, but the best consistently grow over the long haul.
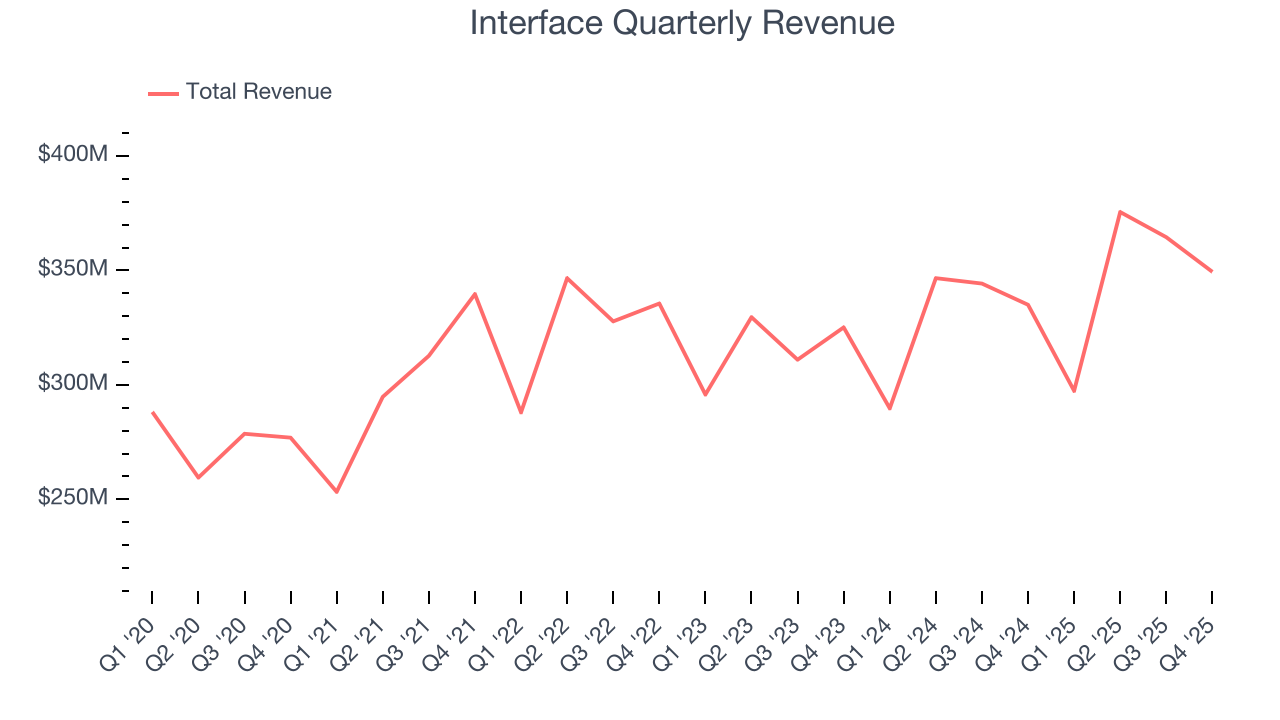
With $1.39 billion in revenue over the past 12 months, Interface is a mid-sized business services company, which sometimes brings disadvantages compared to larger competitors benefiting from better economies of scale.
As you can see below, Interface grew its sales at a mediocre 4.7% compounded annual growth rate over the last five years. This shows it couldn’t generate demand in any major way and is a tough starting point for our analysis.
We at StockStory place the most emphasis on long-term growth, but within business services, a half-decade historical view may miss recent innovations or disruptive industry trends. Interface’s annualized revenue growth of 4.9% over the last two years aligns with its five-year trend, suggesting its demand was consistently weak. 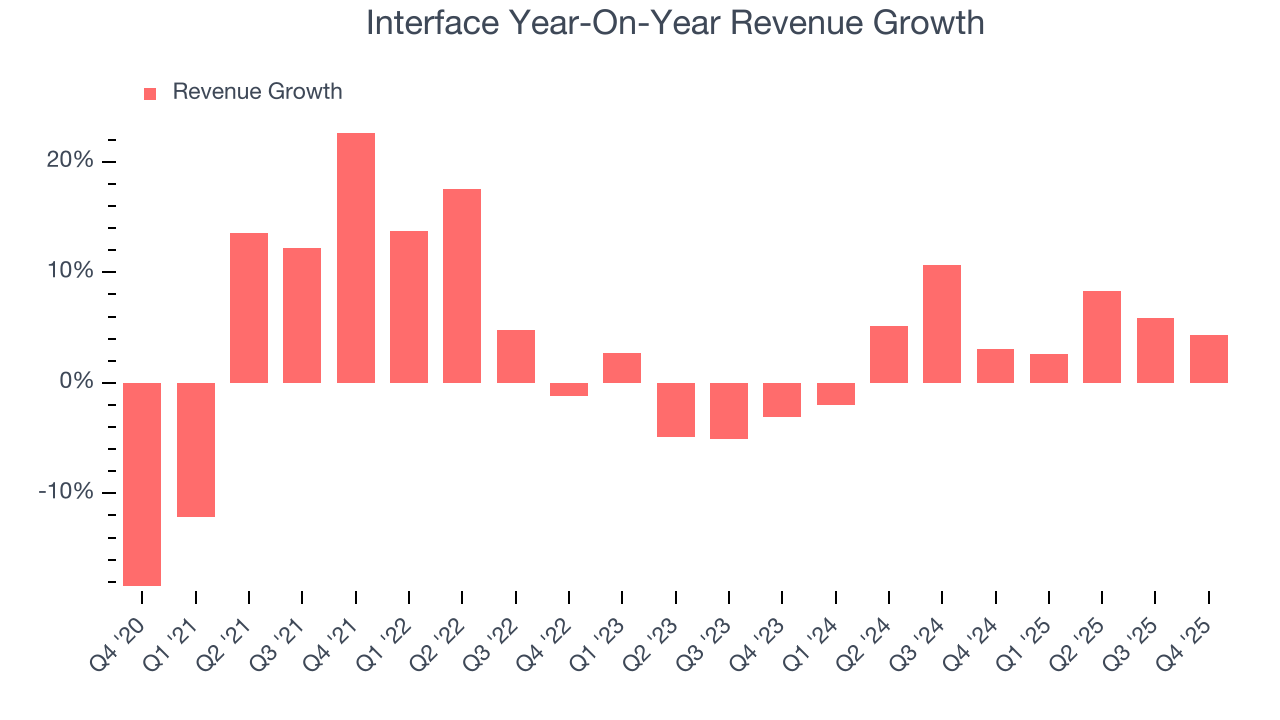
This quarter, Interface grew its revenue by 4.3% year on year, and its $349.4 million of revenue was in line with Wall Street’s estimates. Company management is currently guiding for a 7.6% year-on-year increase in sales next quarter.
Looking further ahead, sell-side analysts expect revenue to grow 4.2% over the next 12 months, similar to its two-year rate. This projection doesn't excite us and indicates its newer products and services will not accelerate its top-line performance yet.
6. Operating Margin
Operating margin is an important measure of profitability as it shows the portion of revenue left after accounting for all core expenses – everything from the cost of goods sold to advertising and wages. It’s also useful for comparing profitability across companies with different levels of debt and tax rates because it excludes interest and taxes.
Interface was profitable over the last five years but held back by its large cost base. Its average operating margin of 9% was weak for a business services business.
On the plus side, Interface’s operating margin rose by 3.1 percentage points over the last five years, as its sales growth gave it operating leverage.
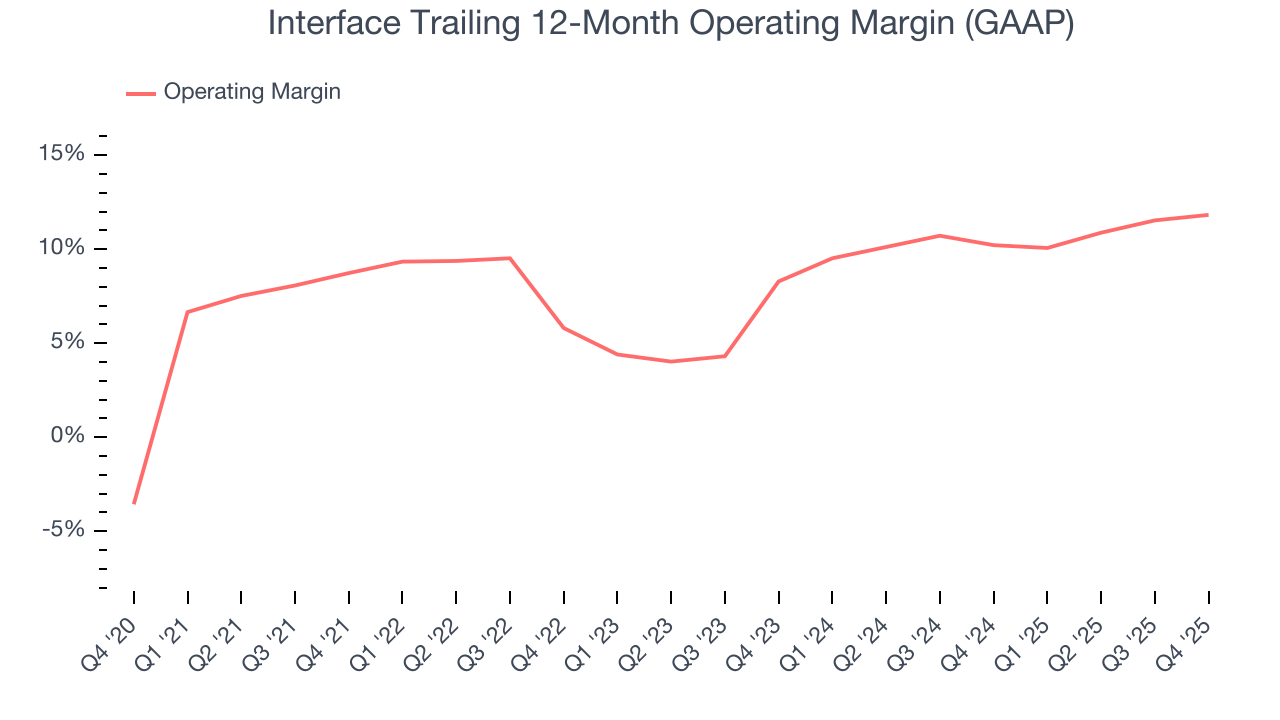
In Q4, Interface generated an operating margin profit margin of 10.1%, up 1.3 percentage points year on year. This increase was a welcome development and shows it was more efficient.
7. Earnings Per Share
We track the long-term change in earnings per share (EPS) for the same reason as long-term revenue growth. Compared to revenue, however, EPS highlights whether a company’s growth is profitable.
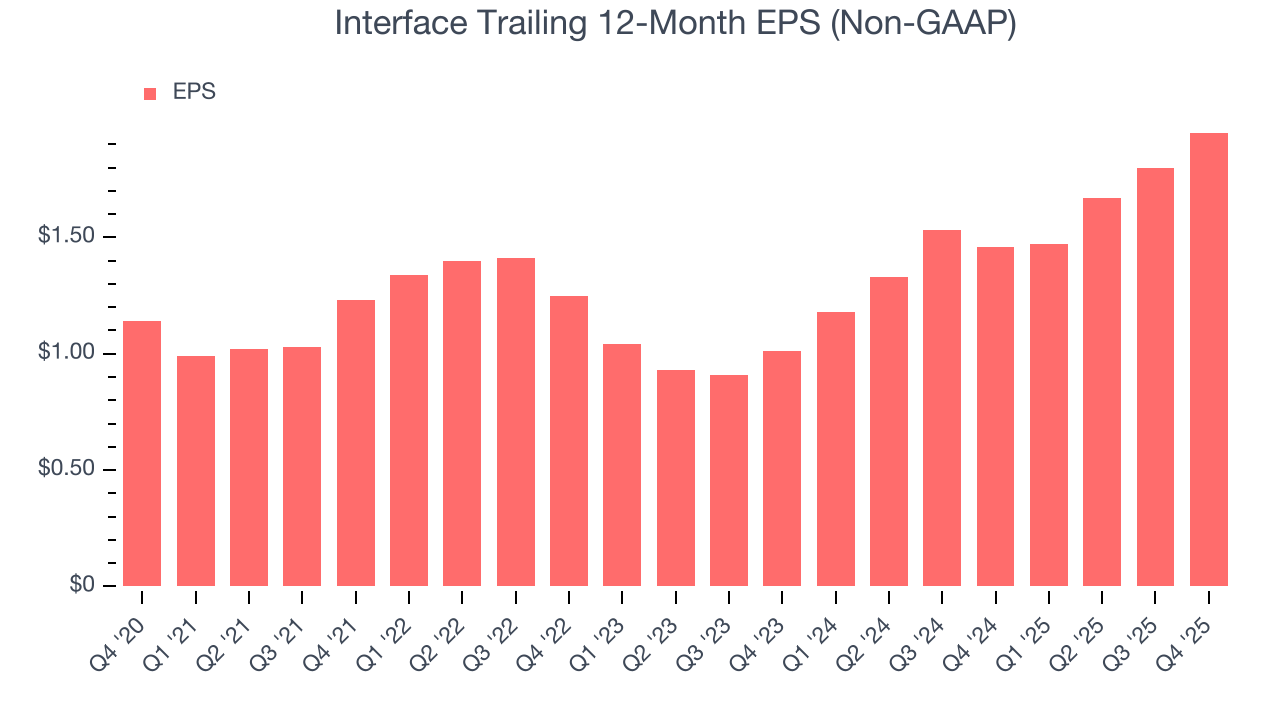
Interface’s EPS grew at a remarkable 11.3% compounded annual growth rate over the last five years, higher than its 4.7% annualized revenue growth. This tells us the company became more profitable on a per-share basis as it expanded.
Diving into the nuances of Interface’s earnings can give us a better understanding of its performance. As we mentioned earlier, Interface’s operating margin expanded by 3.1 percentage points over the last five years. This was the most relevant factor (aside from the revenue impact) behind its higher earnings; interest expenses and taxes can also affect EPS but don’t tell us as much about a company’s fundamentals.
Like with revenue, we analyze EPS over a shorter period to see if we are missing a change in the business.
For Interface, its two-year annual EPS growth of 38.9% was higher than its five-year trend. We love it when earnings growth accelerates, especially when it accelerates off an already high base.
In Q4, Interface reported adjusted EPS of $0.49, up from $0.34 in the same quarter last year. This print easily cleared analysts’ estimates, and shareholders should be content with the results. Over the next 12 months, Wall Street expects Interface’s full-year EPS of $1.95 to grow 3.8%.
8. Cash Is King
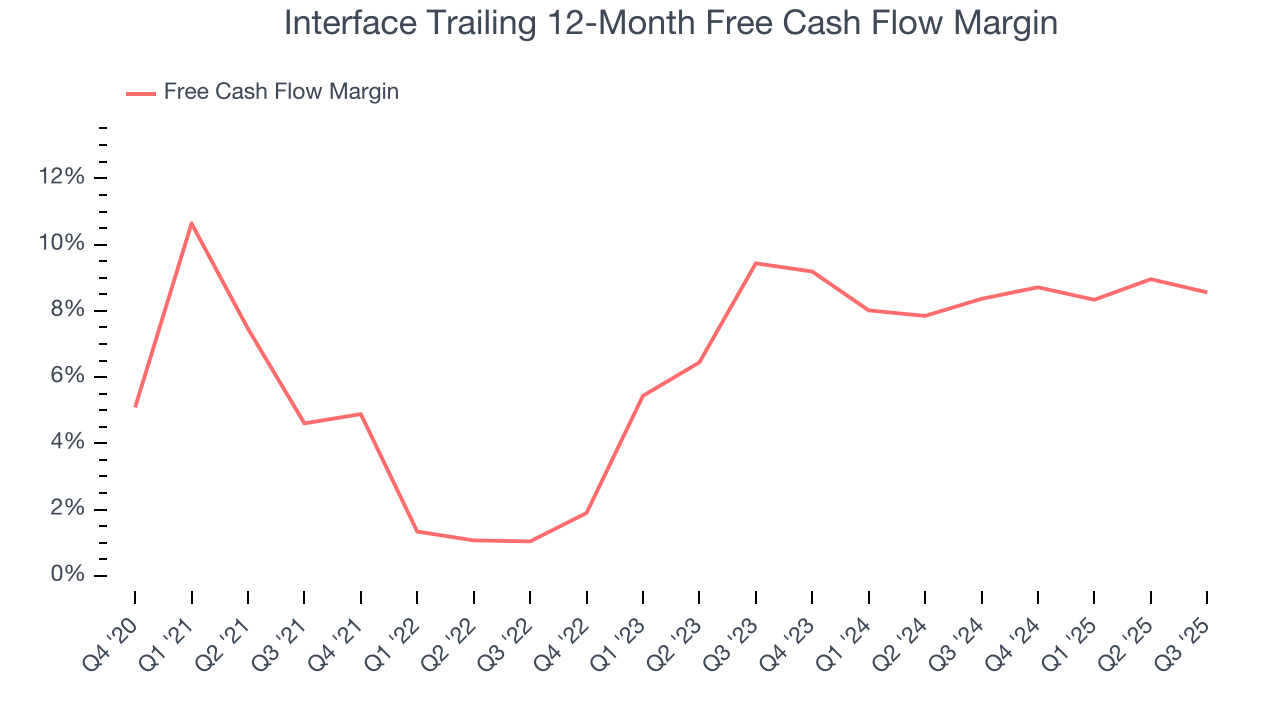
Free cash flow isn't a prominently featured metric in company financials and earnings releases, but we think it's telling because it accounts for all operating and capital expenses, making it tough to manipulate. Cash is king.
Interface has shown decent cash profitability, giving it some flexibility to reinvest or return capital to investors. The company’s free cash flow margin averaged 6.7% over the last five years, slightly better than the broader business services sector.
Taking a step back, we can see that Interface’s margin expanded by 3.6 percentage points during that time. This is encouraging because it gives the company more optionality.
9. Return on Invested Capital (ROIC)
EPS and free cash flow tell us whether a company was profitable while growing its revenue. But was it capital-efficient? Enter ROIC, a metric showing how much operating profit a company generates relative to the money it has raised (debt and equity).
Interface’s management team makes decent investment decisions and generates value for shareholders. Its five-year average ROIC was 11.7%, slightly better than typical business services business.
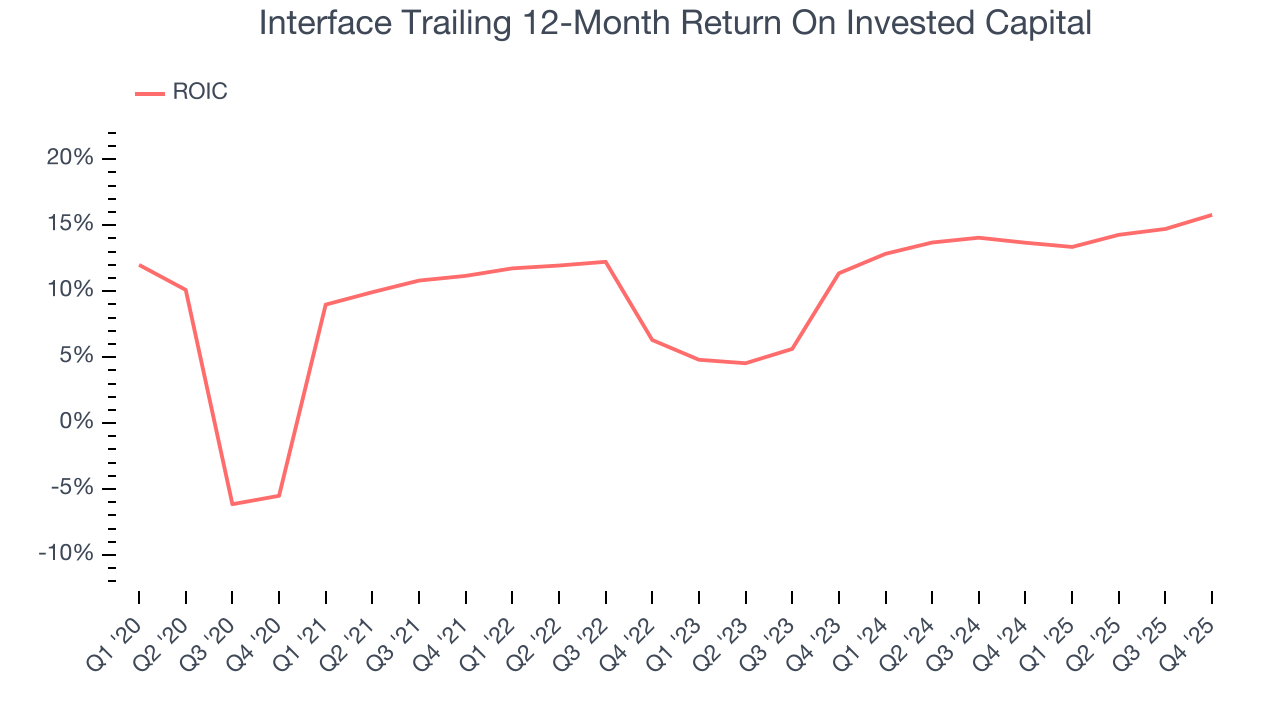
We like to invest in businesses with high returns, but the trend in a company’s ROIC is what often surprises the market and moves the stock price. Fortunately, Interface’s has increased over the last few years. This is a good sign, and if its returns keep rising, there’s a chance it could evolve into an investable business.
10. Balance Sheet Assessment
Interface reported $71.32 million of cash and $264.5 million of debt on its balance sheet in the most recent quarter. As investors in high-quality companies, we primarily focus on two things: 1) that a company’s debt level isn’t too high and 2) that its interest payments are not excessively burdening the business.
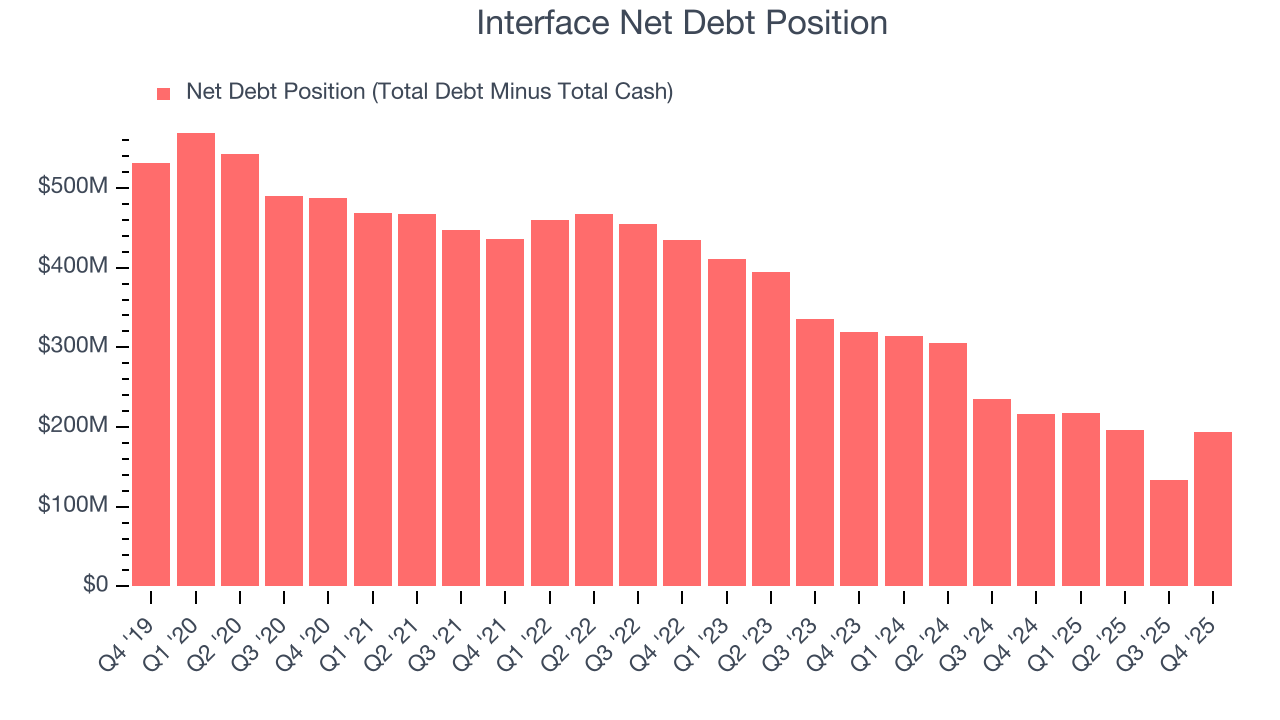
With $217.8 million of EBITDA over the last 12 months, we view Interface’s 0.9× net-debt-to-EBITDA ratio as safe. We also see its $6.59 million of annual interest expenses as appropriate. The company’s profits give it plenty of breathing room, allowing it to continue investing in growth initiatives.
11. Key Takeaways from Interface’s Q4 Results
It was good to see Interface beat analysts’ EPS expectations this quarter. We were also glad its revenue guidance for next quarter exceeded Wall Street’s estimates. On the other hand, its full-year revenue guidance slightly missed. Overall, we think this was a decent quarter with some key metrics above expectations. The stock remained flat at $31.68 immediately after reporting.
12. Is Now The Time To Buy Interface?
Updated: March 16, 2026 at 11:54 PM EDT
Before making an investment decision, investors should account for Interface’s business fundamentals and valuation in addition to what happened in the latest quarter.
In our opinion, Interface is a good company. Although its revenue growth was mediocre over the last five years, its rising returns show management's prior bets are paying off. On top of that, its rising cash profitability gives it more optionality.
Interface’s P/E ratio based on the next 12 months is 13.1x. When scanning the business services space, Interface trades at a fair valuation. For those confident in the business and its management team, this is a good time to invest.
Wall Street analysts have a consensus one-year price target of $36.67 on the company (compared to the current share price of $27.21), implying they see 34.8% upside in buying Interface in the short term.