Best Buy (BBY)
Best Buy faces an uphill battle. Not only is its demand weak but also its falling returns on capital suggest it’s becoming less profitable.― StockStory Analyst Team
1. News
2. Summary
Why We Think Best Buy Will Underperform
With humble beginnings as a stereo equipment seller, Best Buy (NYSE:BBY) now sells a broad selection of consumer electronics, appliances, and home office products.
- Products aren't resonating with the market as its revenue declined by 3.4% annually over the last three years
- Gross margin of 22.5% is an output of its commoditized inventory
- Ongoing store closures and lackluster same-store sales indicate sluggish demand and a focus on consolidation


Best Buy doesn’t meet our quality standards. We’re hunting for superior stocks elsewhere.
Why There Are Better Opportunities Than Best Buy


Best Buy’s stock price of $62.73 implies a valuation ratio of 9.6x forward P/E. This certainly seems like a cheap stock, but we think there are valid reasons why it trades this way.
Cheap stocks can look like great bargains at first glance, but you often get what you pay for. These mediocre businesses often have less earnings power, meaning there is more reliance on a re-rating to generate good returns - an unlikely scenario for low-quality companies.
3. Best Buy (BBY) Research Report: Q4 CY2025 Update
Electronics retailer Best Buy (NYSE:BBY) missed Wall Street’s revenue expectations in Q4 CY2025, with sales flat year on year at $13.81 billion. The company’s full-year revenue guidance of $41.65 billion at the midpoint came in 1.4% below analysts’ estimates. Its non-GAAP profit of $2.61 per share was 5.8% above analysts’ consensus estimates.
Best Buy (BBY) Q4 CY2025 Highlights:
- Revenue: $13.81 billion vs analyst estimates of $13.89 billion (flat year on year, 0.5% miss)
- Adjusted EPS: $2.61 vs analyst estimates of $2.47 (5.8% beat)
- Adjusted EBITDA: $1.06 billion vs analyst estimates of $892.8 million (7.7% margin, 19.1% beat)
- Adjusted EPS guidance for the upcoming financial year 2027 is $6.45 at the midpoint, missing analyst estimates by 3%
- Operating Margin: 5.2%, up from 1.6% in the same quarter last year
- Free Cash Flow Margin: 8%, down from 9.7% in the same quarter last year
- Same-Store Sales were flat year on year (0.5% in the same quarter last year)
- Market Capitalization: $12.91 billion
Company Overview
With humble beginnings as a stereo equipment seller, Best Buy (NYSE:BBY) now sells a broad selection of consumer electronics, appliances, and home office products.
Whether you need a new gaming headset, a speaker for your home audio system, or a blender for making smoothies, Best Buy has you covered. The company can serve the tech savvy consumer, who appreciates Best Buy’s selection and competitive pricing. Best Buy can also serve the electronics novice providing expert service and advice through its knowledgeable sales associates, who can recommend products and help with technical support and installation. These sales associates, famously known as the ‘Geek Squad’, are one key way the company can compete effectively with larger competitors.
The size of an average Best Buy store is around 40,000 square feet and is typically located in high-traffic areas, such as shopping centers and malls. The stores are typically organized by product categories such as TVs, laptops and computers, home theater/audio, and home appliances among others. The mid-sized footprint, straightforward layout, and displays allow those who know what they want to easily find it but also encourage discovery among those who may be browsing. Best Buy has an e-commerce presence, launched in 1998, that allows customers to purchase products for home delivery or to pick up in-store.
4. Electronics & Gaming Retailer
After a long day, some of us want to just watch TV, play video games, listen to music, or scroll through our phones; electronics and gaming retailers sell the technology that makes this possible, plus more. Shoppers can find everything from surround-sound speakers to gaming controllers to home appliances in their stores. Competitive prices and helpful store associates that can talk through topics like the latest technology in gaming and installation keep customers coming back. This is a category that has moved rapidly online over the last few decades, so these electronics and gaming retailers have needed to be nimble and aggressive with their e-commerce and omnichannel investments.
Retailers offering consumer electronics and home appliances include Walmart (NYSE:WMT), Target (NYSE:TGT), and Amazon.com (NASDAQ:AMZN).
5. Revenue Growth
A company’s long-term sales performance can indicate its overall quality. Any business can put up a good quarter or two, but the best consistently grow over the long haul.
With $41.69 billion in revenue over the past 12 months, Best Buy is larger than most consumer retail companies and benefits from economies of scale, enabling it to gain more leverage on its fixed costs than smaller competitors. This also gives it the flexibility to offer lower prices. However, its scale is a double-edged sword because there is only so much real estate to build new stores, placing a ceiling on its growth. To expand meaningfully, Best Buy likely needs to tweak its prices or enter new markets.
As you can see below, Best Buy’s revenue declined by 3.4% per year over the last three years as it closed stores and observed lower sales at existing, established locations.
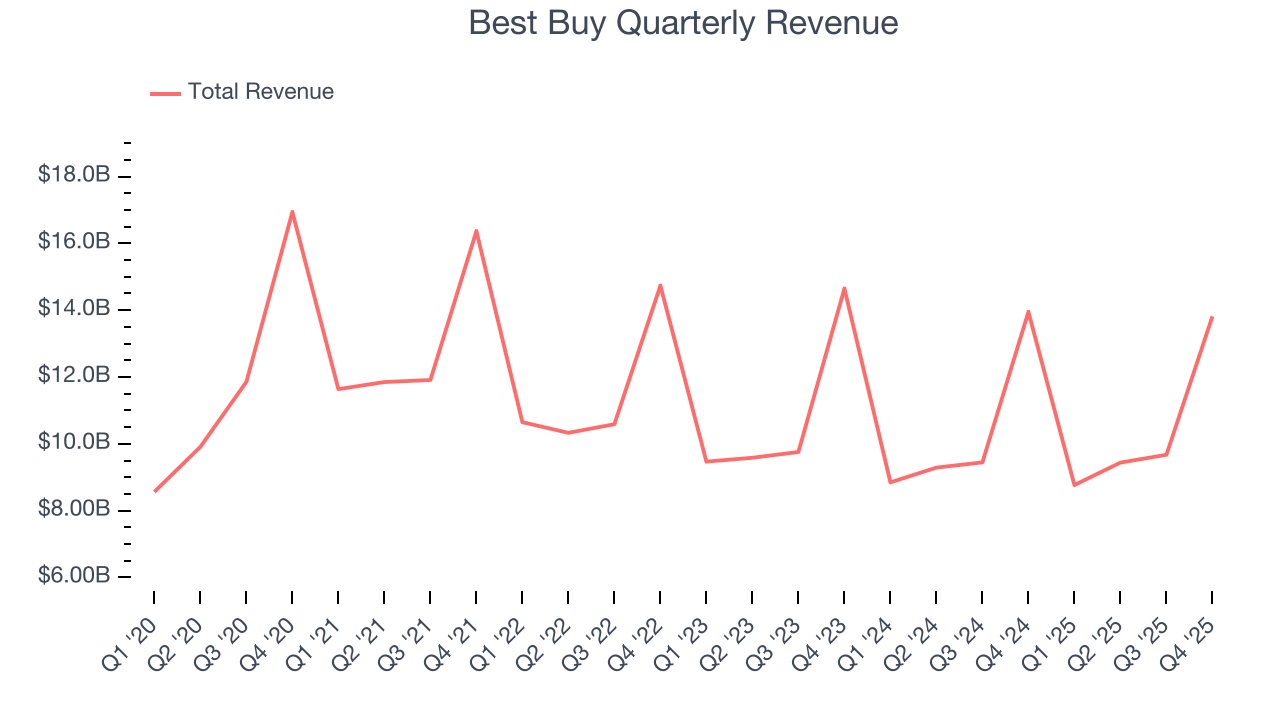
This quarter, Best Buy missed Wall Street’s estimates and reported a rather uninspiring 1% year-on-year revenue decline, generating $13.81 billion of revenue.
Looking ahead, sell-side analysts expect revenue to grow 1.2% over the next 12 months. While this projection implies its newer products will catalyze better top-line performance, it is still below the sector average.
6. Store Performance
Number of Stores
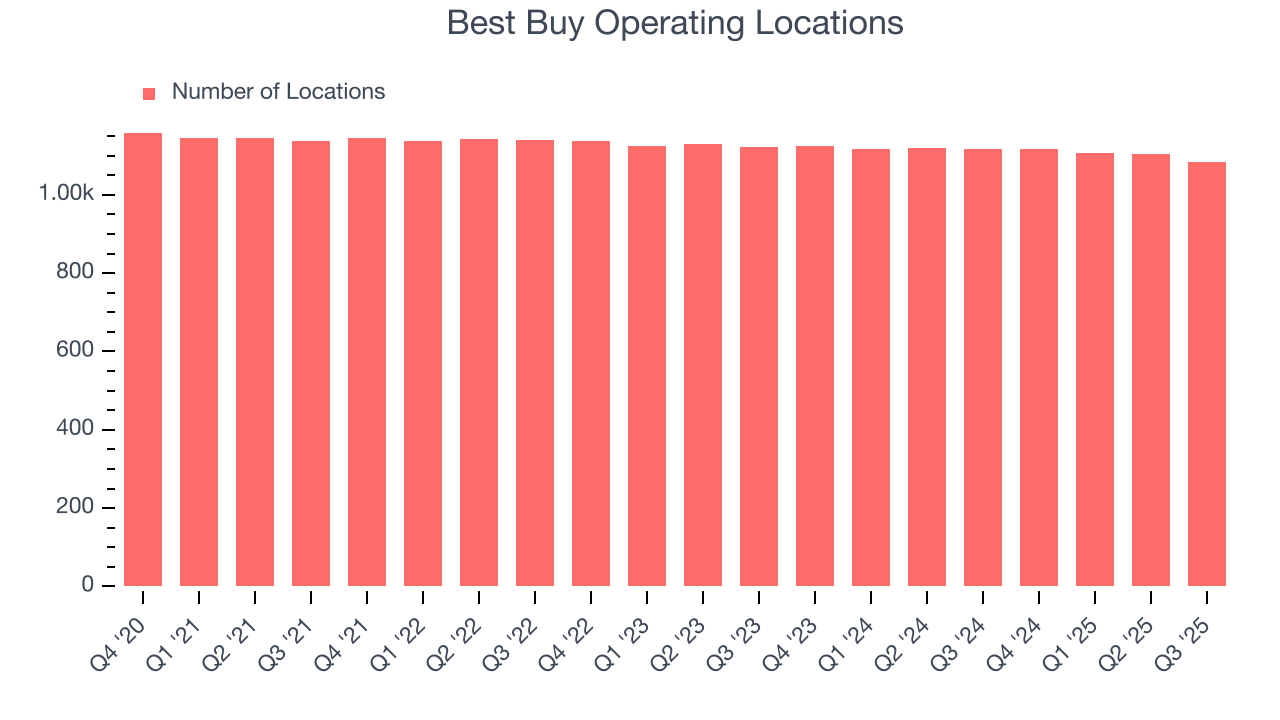
A retailer’s store count influences how much it can sell and how quickly revenue can grow.
Over the last two years, Best Buy has generally closed its stores, averaging 1.1% annual declines.
When a retailer shutters stores, it usually means that brick-and-mortar demand is less than supply, and it is responding by closing underperforming locations to improve profitability.
Note that Best Buy reports its store count intermittently, so some data points are missing in the chart below.
Same-Store Sales
The change in a company's store base only tells one side of the story. The other is the performance of its existing locations and e-commerce sales, which informs management teams whether they should expand or downsize their physical footprints. Same-store sales gives us insight into this topic because it measures organic growth for a retailer's e-commerce platform and brick-and-mortar shops that have existed for at least a year.
Best Buy’s demand has been shrinking over the last two years as its same-store sales have averaged 1% annual declines. This performance isn’t ideal, and Best Buy is attempting to boost same-store sales by closing stores (fewer locations sometimes lead to higher same-store sales).
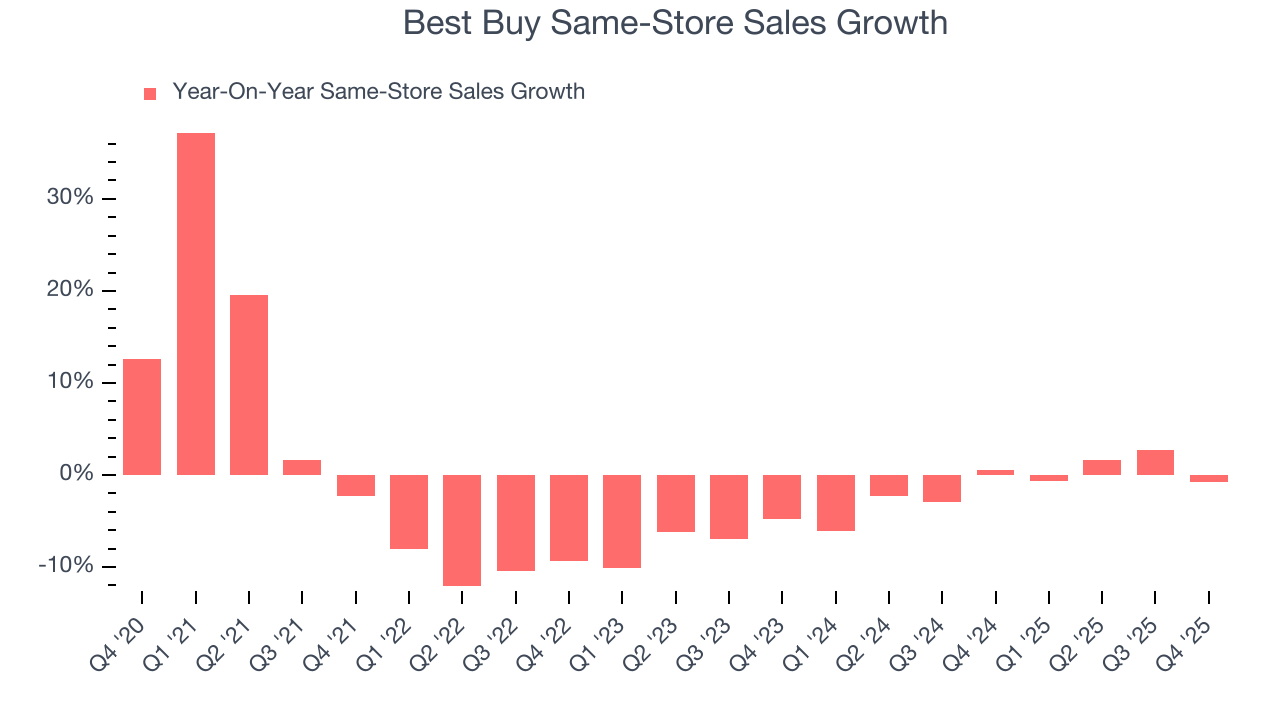
In the latest quarter, Best Buy’s year on year same-store sales were flat. This performance was a well-appreciated turnaround from its historical levels, showing the business is improving.
7. Gross Margin & Pricing Power
Best Buy has bad unit economics for a retailer, signaling it operates in a competitive market and lacks pricing power because its inventory is sold in many places. As you can see below, it averaged a 22.5% gross margin over the last two years. Said differently, Best Buy had to pay a chunky $77.46 to its suppliers for every $100 in revenue. 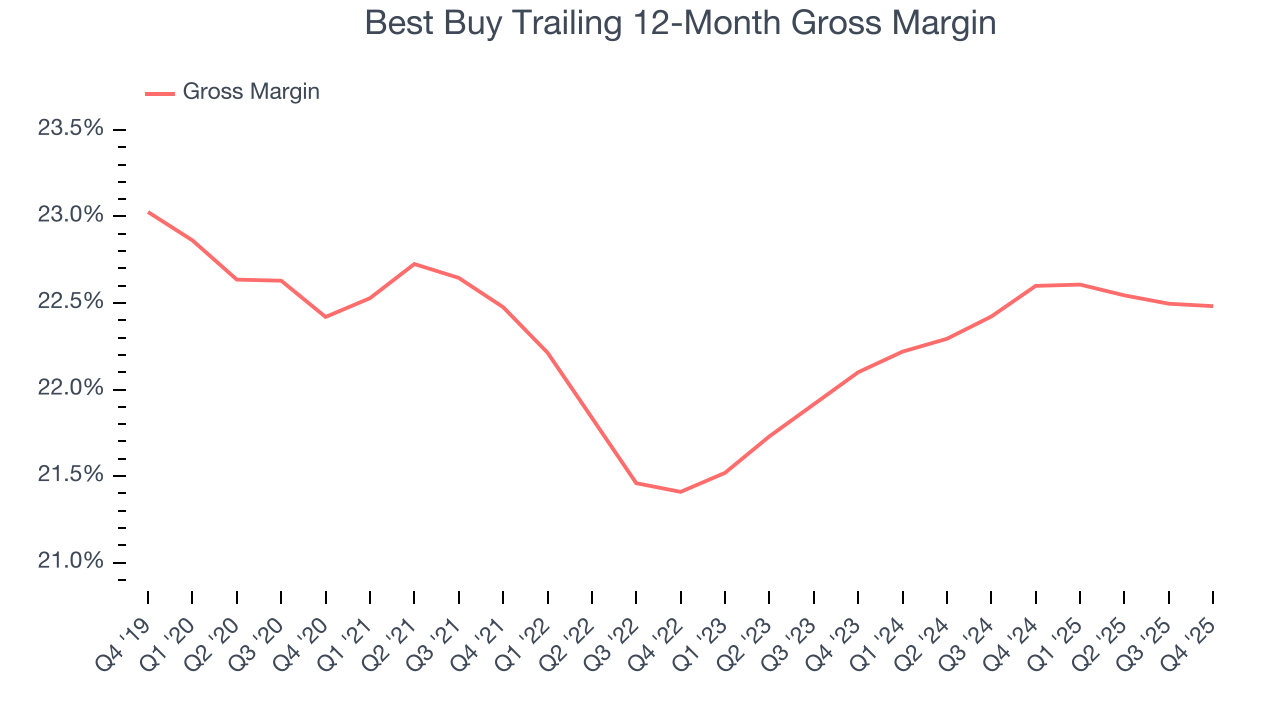
This quarter, Best Buy’s gross profit margin was 20.9%, in line with the same quarter last year. On a wider time horizon, the company’s full-year margin has remained steady over the past four quarters, suggesting it strives to keep prices low for customers and has stable input costs (such as labor and freight expenses to transport goods).
8. Operating Margin
Best Buy’s operating margin might fluctuated slightly over the last 12 months but has generally stayed the same, averaging 3.2% over the last two years. This profitability was lousy for a consumer retail business and caused by its suboptimal cost structureand low gross margin.
Looking at the trend in its profitability, Best Buy’s operating margin might fluctuated slightly but has generally stayed the same over the last year, meaning it will take a fundamental shift in the business model to change.
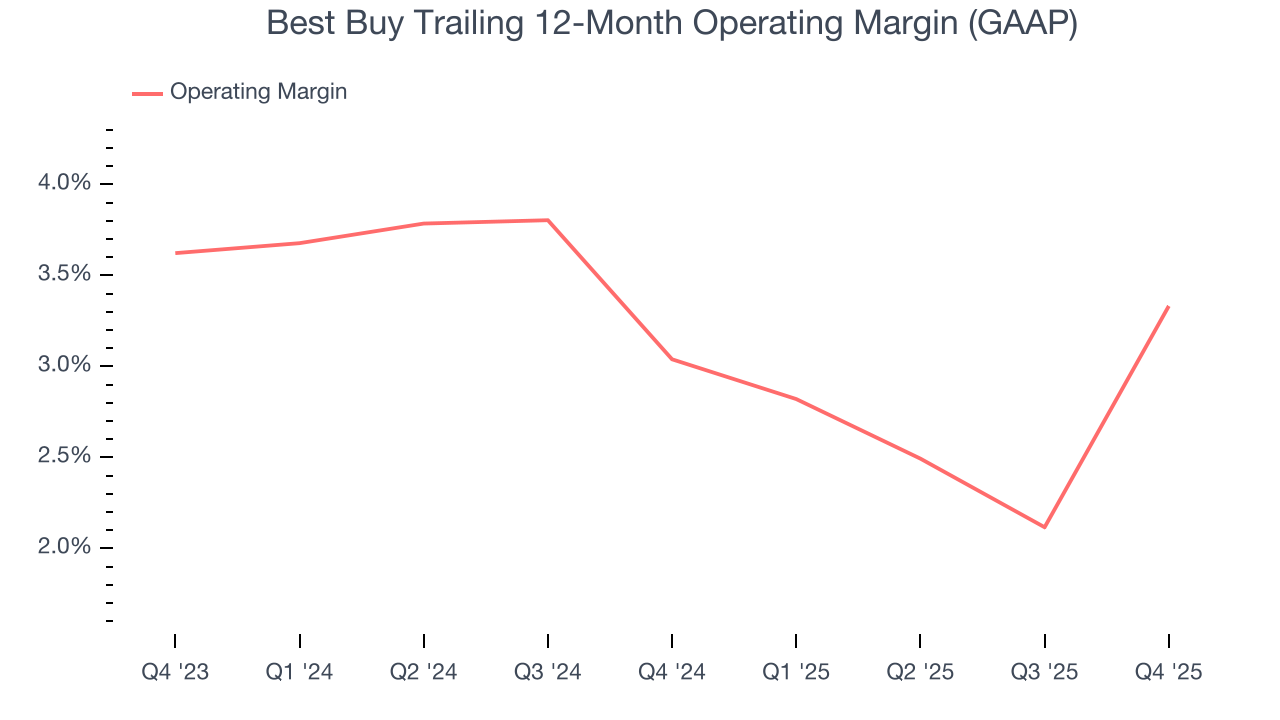
This quarter, Best Buy generated an operating margin profit margin of 5.2%, up 3.7 percentage points year on year. The increase was encouraging, and because its operating margin rose more than its gross margin, we can infer it was more efficient with expenses such as marketing, and administrative overhead.
9. Earnings Per Share
We track the long-term change in earnings per share (EPS) for the same reason as long-term revenue growth. Compared to revenue, however, EPS highlights whether a company’s growth is profitable.
Sadly for Best Buy, its EPS and revenue declined by 3.2% and 3.4% annually over the last three years. In a mature sector such as consumer retail, we tend to steer our readers away from companies with falling EPS because it could imply changing secular trends and preferences. If the tide turns unexpectedly, Best Buy’s low margin of safety could leave its stock price susceptible to large downswings.
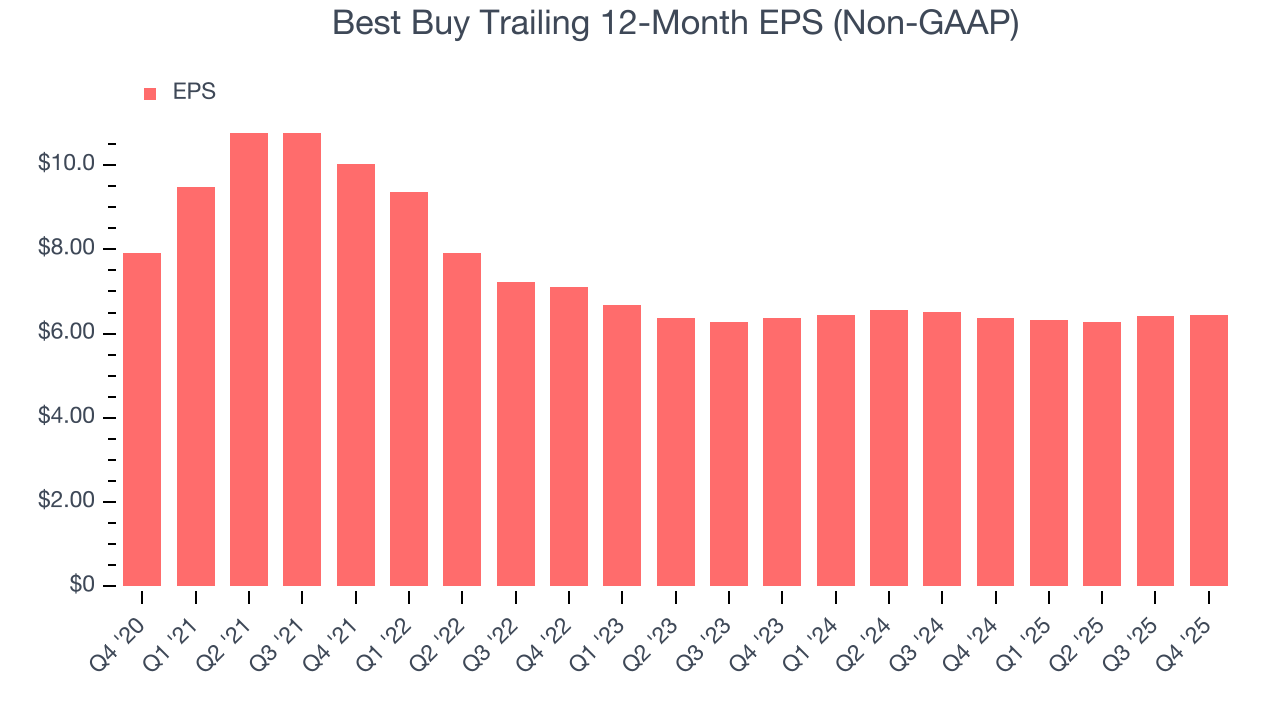
In Q4, Best Buy reported adjusted EPS of $2.61, up from $2.58 in the same quarter last year. This print beat analysts’ estimates by 5.8%. Over the next 12 months, Wall Street expects Best Buy’s full-year EPS of $6.44 to grow 3.7%.
10. Cash Is King
If you’ve followed StockStory for a while, you know we emphasize free cash flow. Why, you ask? We believe that in the end, cash is king, and you can’t use accounting profits to pay the bills.
Best Buy has shown decent cash profitability, giving it some flexibility to reinvest or return capital to investors. The company’s free cash flow margin averaged 3.2% over the last two years, slightly better than the broader consumer retail sector.
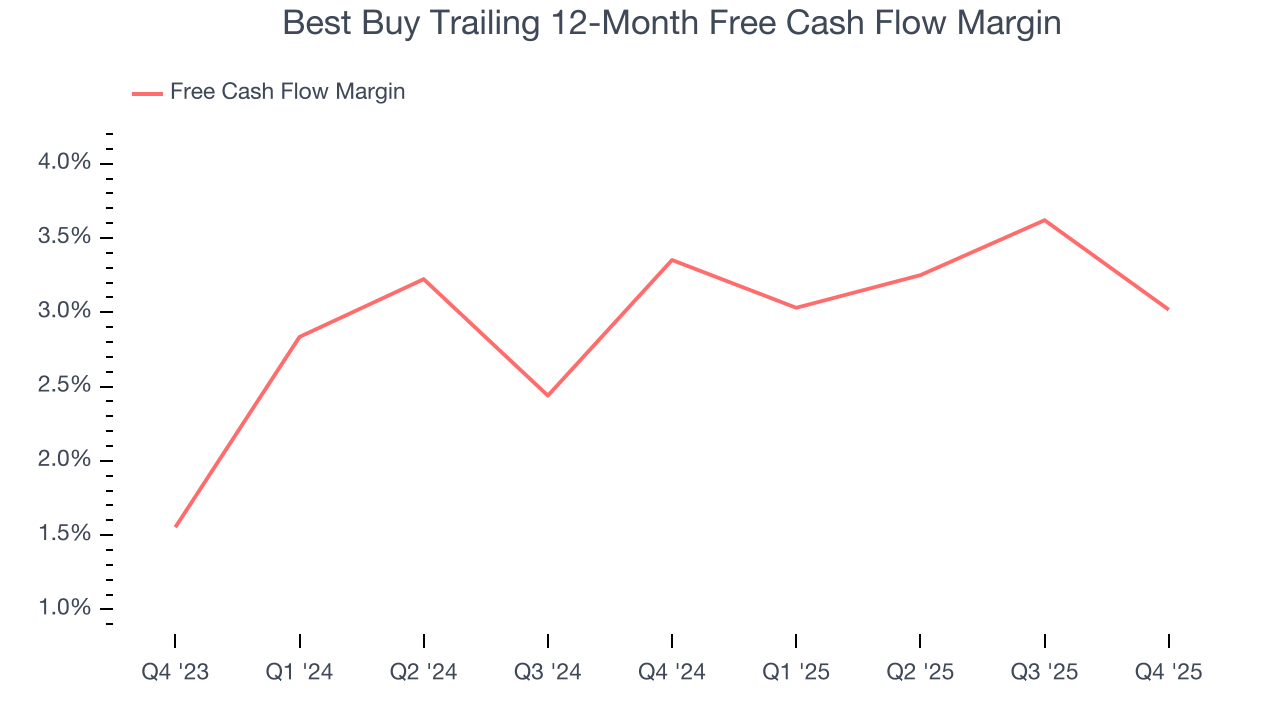
Best Buy’s free cash flow clocked in at $1.10 billion in Q4, equivalent to a 8% margin. The company’s cash profitability regressed as it was 1.8 percentage points lower than in the same quarter last year, but it’s still above its two-year average. We wouldn’t read too much into this quarter’s decline because investment needs can be seasonal, leading to short-term swings. Long-term trends trump temporary fluctuations.
11. Return on Invested Capital (ROIC)
EPS and free cash flow tell us whether a company was profitable while growing its revenue. But was it capital-efficient? Enter ROIC, a metric showing how much operating profit a company generates relative to the money it has raised (debt and equity).
Although Best Buy hasn’t been the highest-quality company lately because of its poor top-line performance, it found a few growth initiatives in the past that worked out wonderfully. Its five-year average ROIC was 27%, splendid for a consumer retail business.
12. Balance Sheet Assessment
Best Buy reported $1.74 billion of cash and $4.13 billion of debt on its balance sheet in the most recent quarter. As investors in high-quality companies, we primarily focus on two things: 1) that a company’s debt level isn’t too high and 2) that its interest payments are not excessively burdening the business.
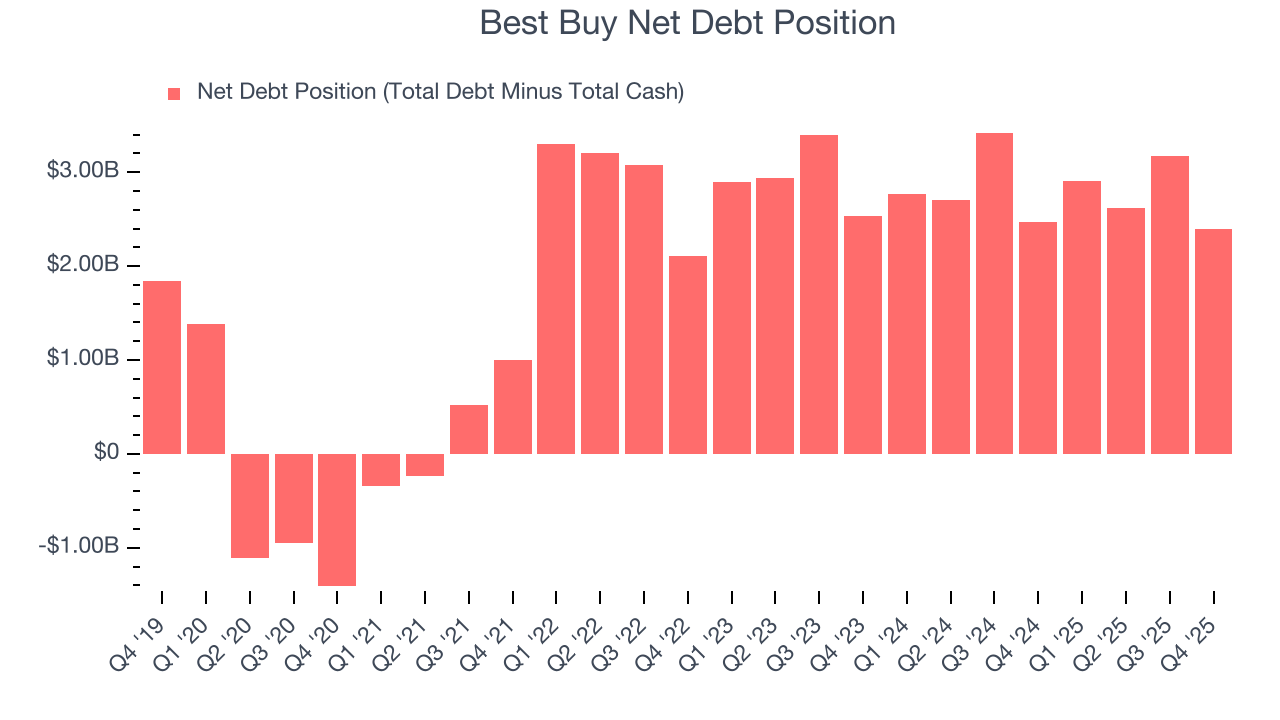
With $2.78 billion of EBITDA over the last 12 months, we view Best Buy’s 0.9× net-debt-to-EBITDA ratio as safe. We also see its $11 million of annual interest expenses as appropriate. The company’s profits give it plenty of breathing room, allowing it to continue investing in growth initiatives.
13. Key Takeaways from Best Buy’s Q4 Results
We were impressed by how significantly Best Buy blew past analysts’ EBITDA expectations this quarter. We were also glad its EPS outperformed Wall Street’s estimates. On the other hand, its full-year EPS guidance missed and its full-year revenue guidance fell slightly short of Wall Street’s estimates. Zooming out, we think this was a mixed quarter, but it seems expectations were low. The stock traded up 13.3% to $69.80 immediately following the results.
14. Is Now The Time To Buy Best Buy?
Updated: March 15, 2026 at 10:28 PM EDT
We think that the latest earnings result is only one piece of the bigger puzzle. If you’re deciding whether to own Best Buy, you should also grasp the company’s longer-term business quality and valuation.
We cheer for all companies serving everyday consumers, but in the case of Best Buy, we’ll be cheering from the sidelines. First off, its revenue has declined over the last three years. While its popular brand gives it meaningful influence over consumers’ purchasing decisions, the downside is its gross margins make it more challenging to reach positive operating profits compared to other consumer retail businesses. On top of that, its shrinking same-store sales tell us it will need to change its strategy to succeed.
Best Buy’s P/E ratio based on the next 12 months is 9.6x. While this valuation is optically cheap, the potential downside is huge given its shaky fundamentals. There are more exciting stocks to buy at the moment.
Wall Street analysts have a consensus one-year price target of $74.35 on the company (compared to the current share price of $62.73).
Although the price target is bullish, readers should exercise caution because analysts tend to be overly optimistic. The firms they work for, often big banks, have relationships with companies that extend into fundraising, M&A advisory, and other rewarding business lines. As a result, they typically hesitate to say bad things for fear they will lose out. We at StockStory do not suffer from such conflicts of interest, so we’ll always tell it like it is.