
Dycom (DY)
Dycom is an exciting business. Its revenue and EPS are soaring, showing it can grow quickly and become more profitable as it scales.― StockStory Analyst Team
1. News


2. Summary
Why We Like Dycom
Working alongside some of the most popular mobile carriers in the world, Dycom (NYSE:DY) builds and maintains telecommunications infrastructure.
- Annual revenue growth of 15.2% over the last two years was superb and indicates its market share increased during this cycle
- Performance over the past five years shows its incremental sales were extremely profitable, as its annual earnings per share growth of 33.7% outpaced its revenue gains
- Market share is on track to rise over the next 12 months as its 26.8% projected revenue growth implies demand will accelerate from its two-year trend


We have an affinity for Dycom. The price looks reasonable based on its quality, so this could be a favorable time to invest in some shares.
Why Is Now The Time To Buy Dycom?

At $361.55 per share, Dycom trades at 25.3x forward P/E. This valuation is fair - even cheap depending on how much you like the story - for the quality you get.
Entry price matters much less than business quality when investing for the long term, but hey, it certainly doesn’t hurt to get in at an attractive price.
3. Dycom (DY) Research Report: Q4 CY2025 Update
Telecommunications company Dycom (NYSE:DY) reported revenue ahead of Wall Street’s expectations in Q4 CY2025, with sales up 34.4% year on year to $1.46 billion. Guidance for next quarter’s revenue was optimistic at $1.68 billion at the midpoint, 2.3% above analysts’ estimates. Its non-GAAP profit of $2.03 per share was 14% above analysts’ consensus estimates.
Dycom (DY) Q4 CY2025 Highlights:
- Revenue: $1.46 billion vs analyst estimates of $1.36 billion (34.4% year-on-year growth, 6.9% beat)
- Adjusted EPS: $2.03 vs analyst estimates of $1.78 (14% beat)
- Adjusted EBITDA: $162.4 million vs analyst estimates of $152.4 million (11.1% margin, 6.5% beat)
- Revenue Guidance for Q1 CY2026 is $1.68 billion at the midpoint, above analyst estimates of $1.64 billion
- Adjusted EPS guidance for Q1 CY2026 is $2.74 at the midpoint, below analyst estimates of $2.79
- EBITDA guidance for Q1 CY2026 is $210 million at the midpoint, below analyst estimates of $216.3 million
- Operating Margin: 9.4%, up from 4.9% in the same quarter last year
- Backlog: $9.54 billion at quarter end
- Market Capitalization: $12.09 billion
Company Overview
Working alongside some of the most popular mobile carriers in the world, Dycom (NYSE:DY) builds and maintains telecommunications infrastructure.
Dycom was founded in 1969 and began as a small engineering firm as a small electrical contracting business in Florida. The company began its transformation towards telecommunications by acquiring companies that provided capabilities in network construction and maintenance. It primarily targeted smaller companies in the telecommunications industry, looking to buy out its competitors to reduce competition and decrease its costs.
Dycom builds telecommunication networks for phones, internet, and TV using technologies like fiber optics which are strands of glass or plastic that can transmit data. The company helps erect poles, towers, and equipment above ground which is crucial for modern communication. The company also manages underground infrastructure, planning and installing components like cables and conduits (tubes used to protect and route electrical wires or cables).
After installation, the networks require constant monitoring and maintenance which generates additional revenue streams for the company. Monitoring of the networks also allows Dycom to identify opportunities for network upgrades and expansions. When potential issues are detected early, it can propose and implement additional services.
Its clients include large carriers like AT&T and government entities, engaging in long-term contracts which typically involve large-scale projects such as network expansions, upgrades, and maintenance services. These commitments can span anywhere from a couple of years to over a decade depending on the scale of the project.
4. Engineering and Design Services
Companies providing engineering and design services boast ever-evolving technical expertise. Compared to their counterparts who manufacture and sell physical products, these companies can also pivot faster to more trending areas due to their smaller physical asset bases. Green energy and water conservation, for example, are current themes driving incremental demand in this space. On the other hand, those providing engineering and design services are at the whim of construction and infrastructure project volumes, which tend to be cyclical and can be impacted heavily by economic factors such as interest rates.
Competitors offering similar services include Quanta (NYSE:PWR), AECOM (NYSE:ACM), and MYR (NASDAQ:MYRG).
5. Revenue Growth
A company’s long-term sales performance can indicate its overall quality. Any business can put up a good quarter or two, but the best consistently grow over the long haul. Over the last five years, Dycom grew its sales at an impressive 11.6% compounded annual growth rate. Its growth surpassed the average industrials company and shows its offerings resonate with customers, a great starting point for our analysis.
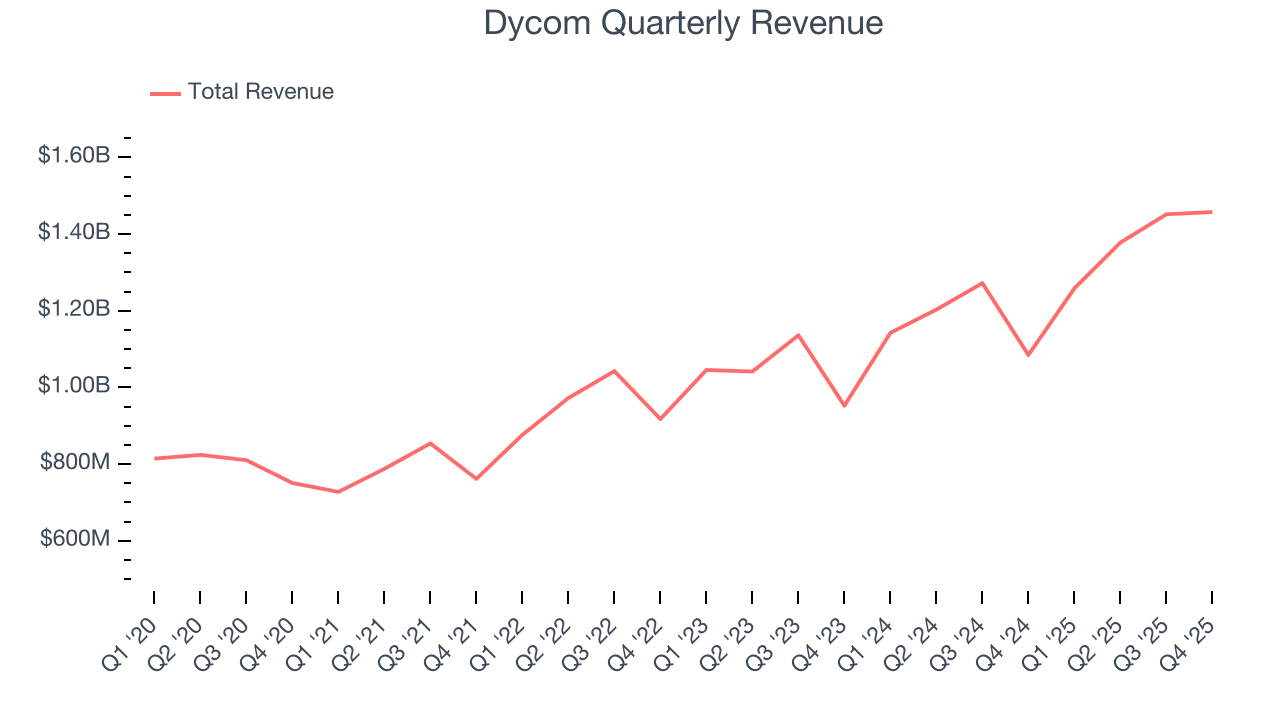
We at StockStory place the most emphasis on long-term growth, but within industrials, a half-decade historical view may miss cycles, industry trends, or a company capitalizing on catalysts such as a new contract win or a successful product line. Dycom’s annualized revenue growth of 15.2% over the last two years is above its five-year trend, suggesting its demand was strong and recently accelerated. 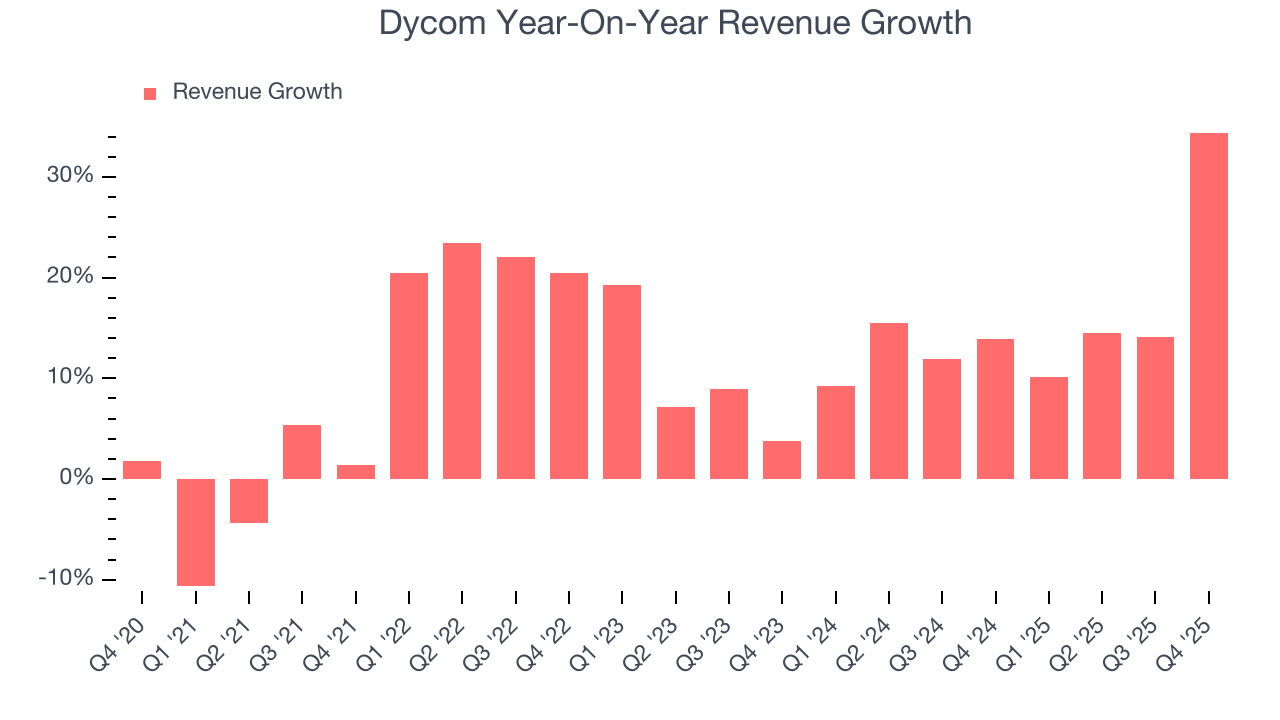
This quarter, Dycom reported wonderful year-on-year revenue growth of 34.4%, and its $1.46 billion of revenue exceeded Wall Street’s estimates by 6.9%. Company management is currently guiding for a 33.1% year-on-year increase in sales next quarter.
Looking further ahead, sell-side analysts expect revenue to grow 26% over the next 12 months, an improvement versus the last two years. This projection is eye-popping and suggests its newer products and services will catalyze better top-line performance.
6. Gross Margin & Pricing Power
All else equal, we prefer higher gross margins because they make it easier to generate more operating profits and indicate that a company commands pricing power by offering more differentiated products.
Dycom has bad unit economics for an industrials business, signaling it operates in a competitive market. As you can see below, it averaged a 18.9% gross margin over the last five years. Said differently, Dycom had to pay a chunky $81.13 to its suppliers for every $100 in revenue. 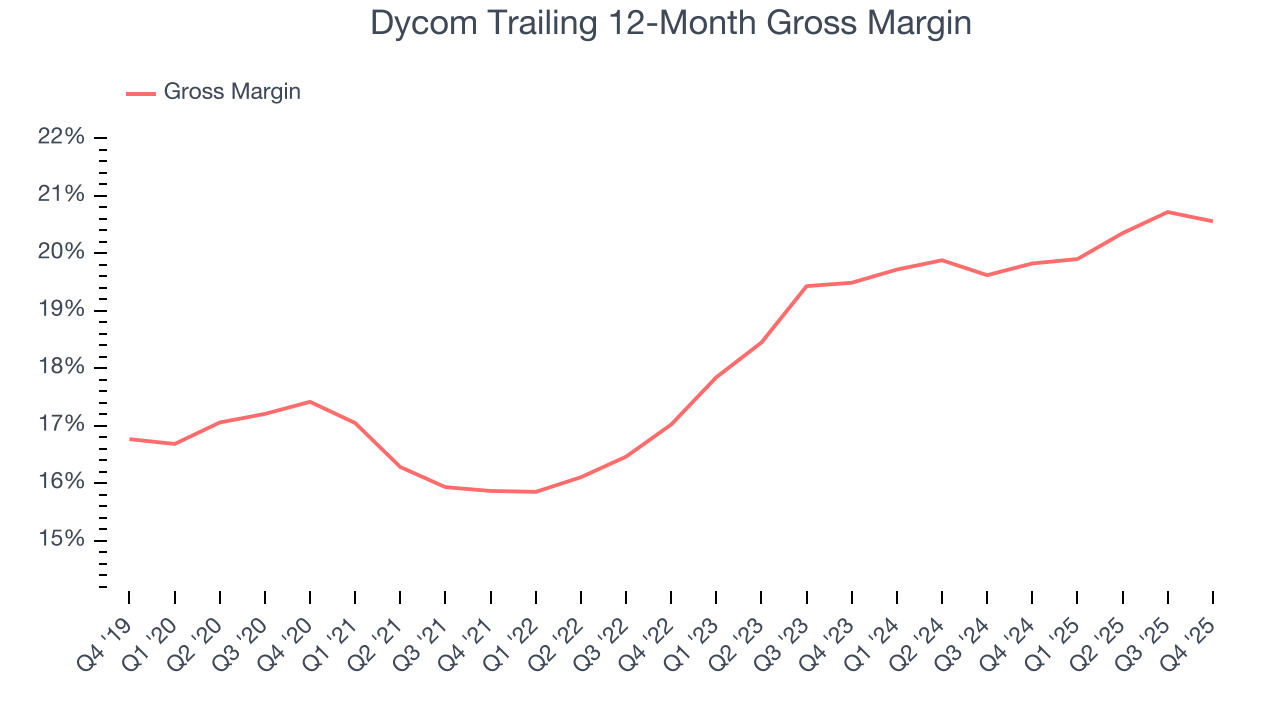
Dycom’s gross profit margin came in at 18.2% this quarter, in line with the same quarter last year. Zooming out, the company’s full-year margin has remained steady over the past 12 months, suggesting its input costs (such as raw materials and manufacturing expenses) have been stable and it isn’t under pressure to lower prices.
7. Operating Margin
Operating margin is an important measure of profitability as it shows the portion of revenue left after accounting for all core expenses – everything from the cost of goods sold to advertising and wages. It’s also useful for comparing profitability across companies with different levels of debt and tax rates because it excludes interest and taxes.
Dycom was profitable over the last five years but held back by its large cost base. Its average operating margin of 6.9% was weak for an industrials business. This result isn’t too surprising given its low gross margin as a starting point.
On the plus side, Dycom’s operating margin rose by 6.6 percentage points over the last five years, as its sales growth gave it immense operating leverage.
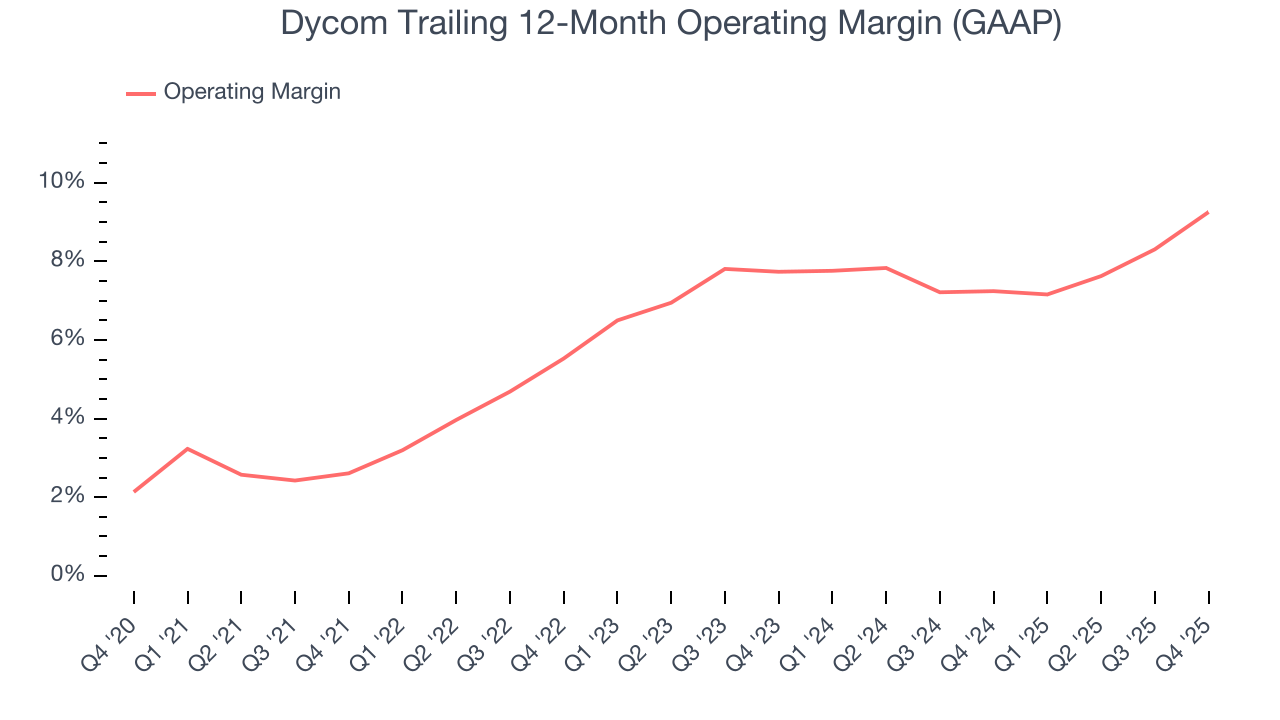
In Q4, Dycom generated an operating margin profit margin of 9.4%, up 4.5 percentage points year on year. The increase was encouraging, and because its operating margin rose more than its gross margin, we can infer it was more efficient with expenses such as marketing, R&D, and administrative overhead.
8. Earnings Per Share
We track the long-term change in earnings per share (EPS) for the same reason as long-term revenue growth. Compared to revenue, however, EPS highlights whether a company’s growth is profitable.
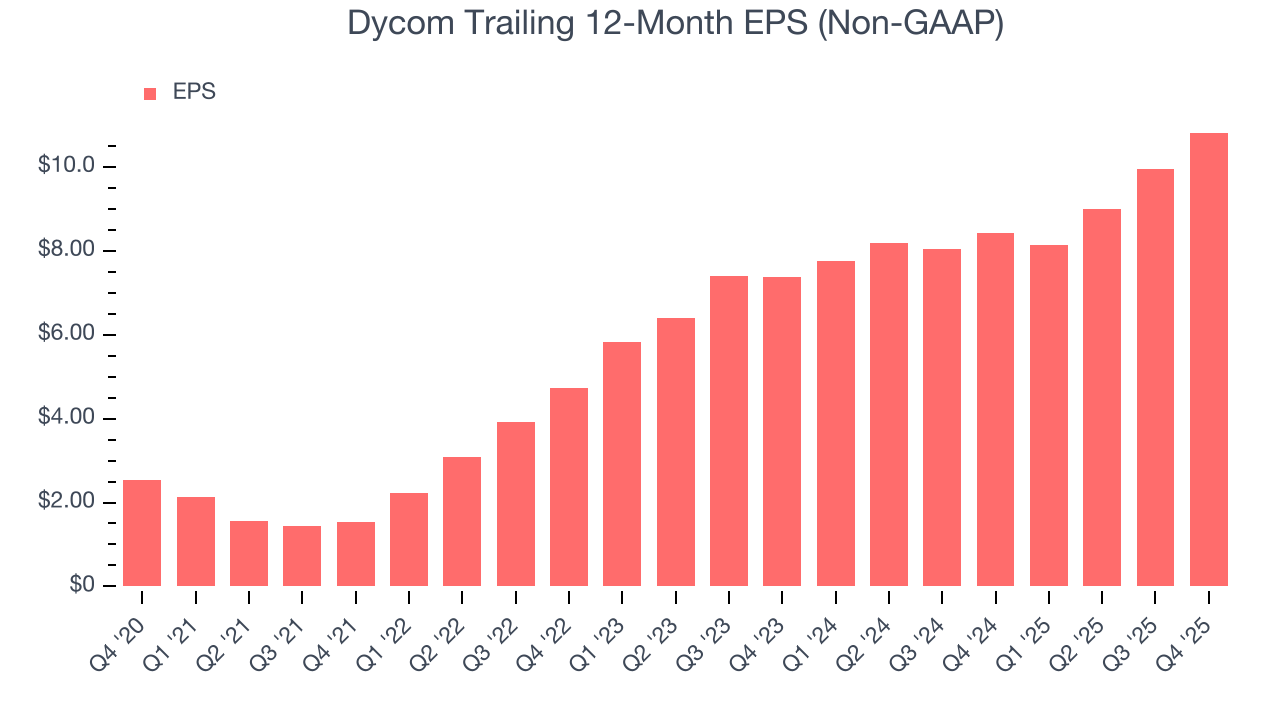
Dycom’s EPS grew at 33.7% compounded annual growth rate over the last five years, higher than its 11.6% annualized revenue growth. This tells us the company became more profitable on a per-share basis as it expanded.
We can take a deeper look into Dycom’s earnings to better understand the drivers of its performance. As we mentioned earlier, Dycom’s operating margin expanded by 6.6 percentage points over the last five years. On top of that, its share count shrank by 5.1%. These are positive signs for shareholders because improving profitability and share buybacks turbocharge EPS growth relative to revenue growth. 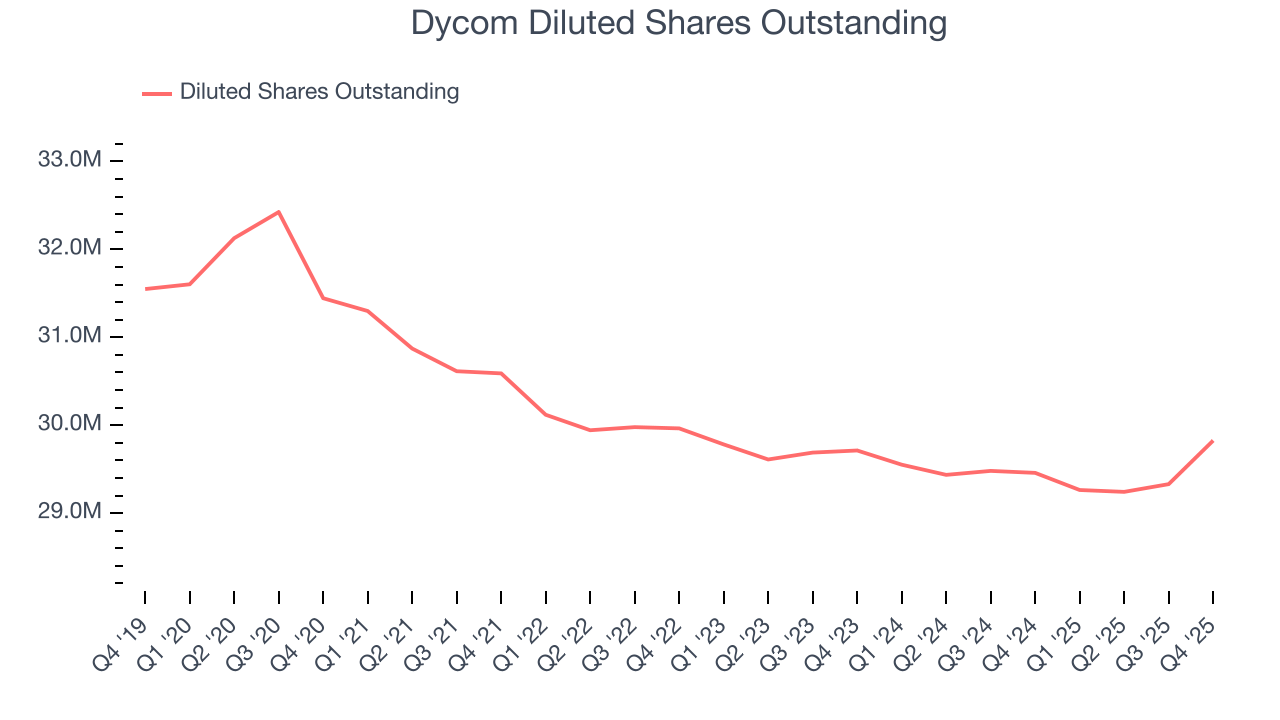
Like with revenue, we analyze EPS over a more recent period because it can provide insight into an emerging theme or development for the business.
For Dycom, its two-year annual EPS growth of 21.1% was lower than its five-year trend. We still think its growth was good and hope it can accelerate in the future.
In Q4, Dycom reported adjusted EPS of $2.03, up from $1.17 in the same quarter last year. This print easily cleared analysts’ estimates, and shareholders should be content with the results. Over the next 12 months, Wall Street expects Dycom’s full-year EPS of $10.82 to grow 32.3%.
9. Cash Is King
Although earnings are undoubtedly valuable for assessing company performance, we believe cash is king because you can’t use accounting profits to pay the bills.
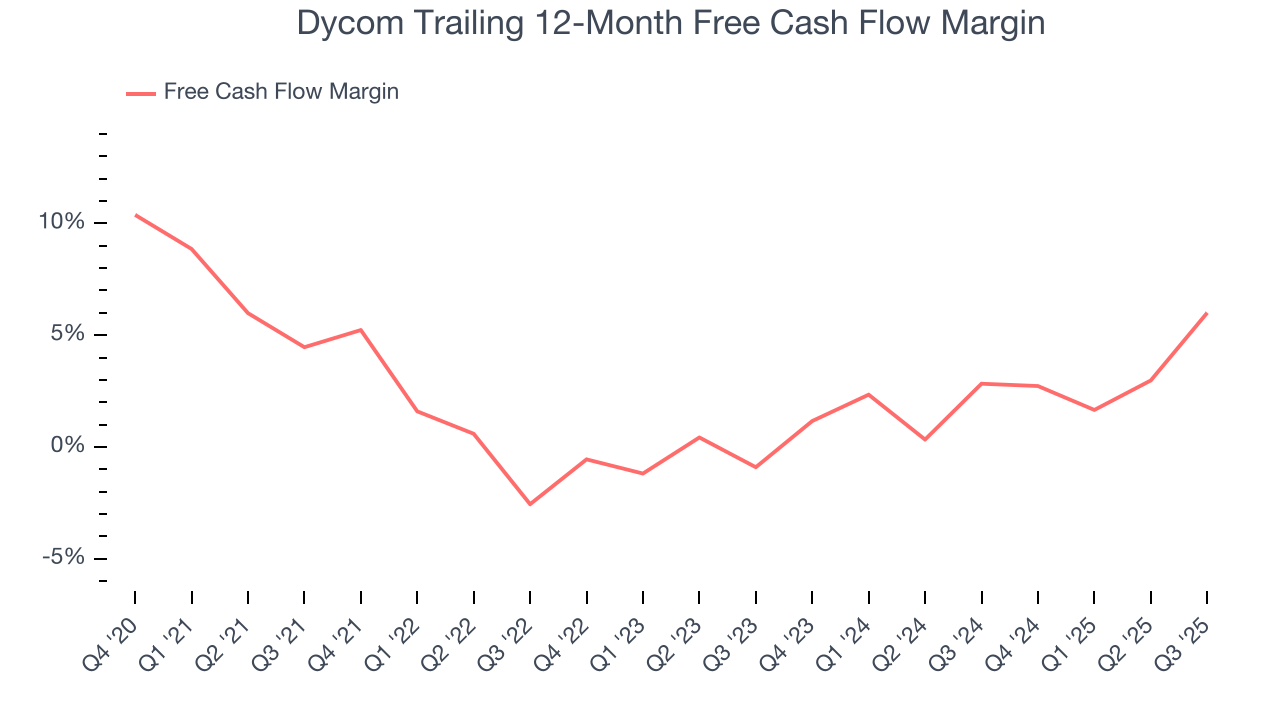
Dycom has shown poor cash profitability relative to peers over the last five years, giving the company fewer opportunities to return capital to shareholders. Its free cash flow margin averaged 1.8%, below what we’d expect for an industrials business.
Taking a step back, we can see that Dycom’s margin dropped by 1.2 percentage points during that time. If the trend continues, it could signal it’s in the middle of an investment cycle.
10. Return on Invested Capital (ROIC)
EPS and free cash flow tell us whether a company was profitable while growing its revenue. But was it capital-efficient? Enter ROIC, a metric showing how much operating profit a company generates relative to the money it has raised (debt and equity).
Dycom’s management team makes decent investment decisions and generates value for shareholders. Its five-year average ROIC was 11.6%, slightly better than typical industrials business.
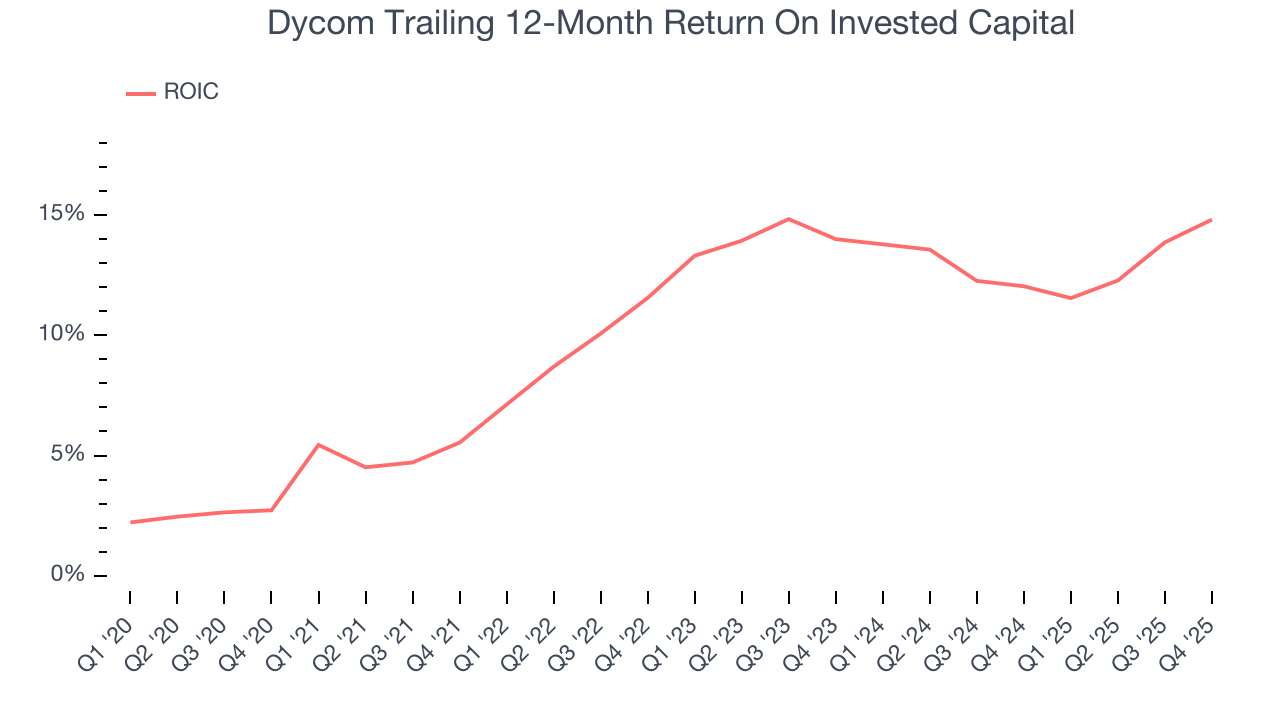
We like to invest in businesses with high returns, but the trend in a company’s ROIC is what often surprises the market and moves the stock price. On average, Dycom’s ROIC increased by 4.9 percentage points annually each year over the last few years. This is a great sign when paired with its already strong returns. It could suggest its competitive advantage or profitable growth opportunities are expanding.
11. Balance Sheet Assessment
Dycom reported $709.2 million of cash and $2.81 billion of debt on its balance sheet in the most recent quarter. As investors in high-quality companies, we primarily focus on two things: 1) that a company’s debt level isn’t too high and 2) that its interest payments are not excessively burdening the business.
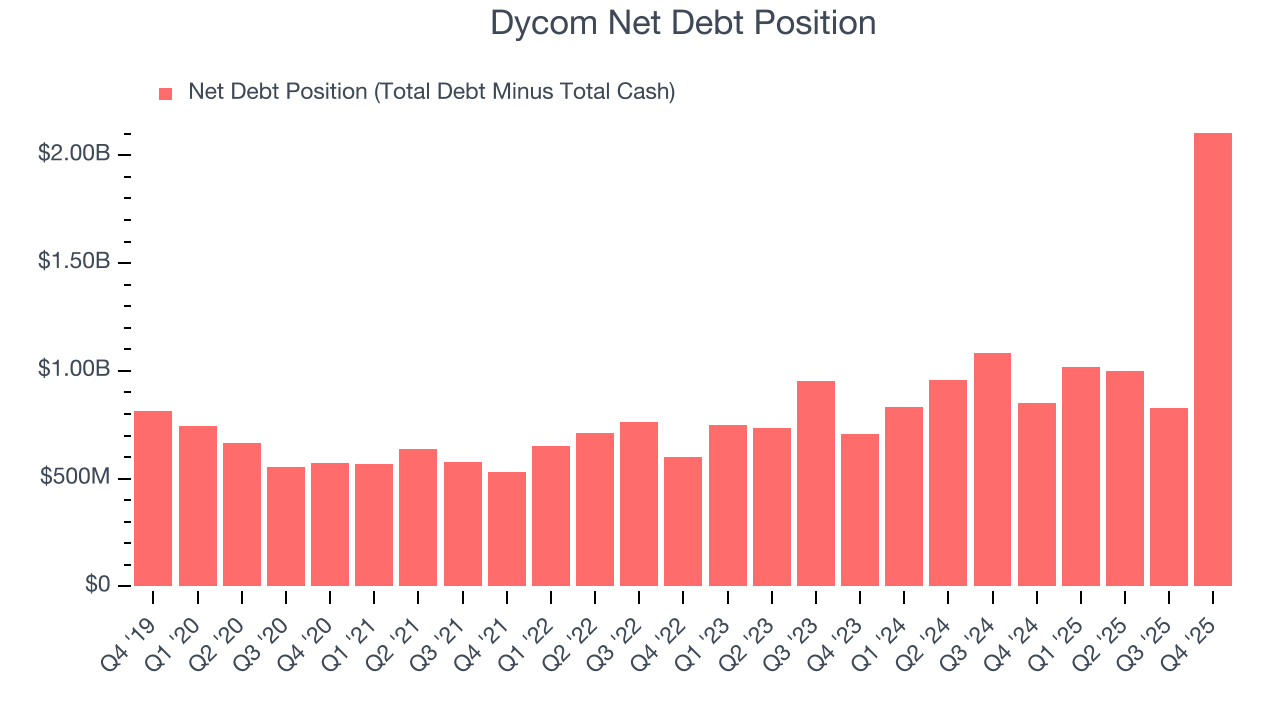
With $737.7 million of EBITDA over the last 12 months, we view Dycom’s 2.9× net-debt-to-EBITDA ratio as safe. We also see its $66.51 million of annual interest expenses as appropriate. The company’s profits give it plenty of breathing room, allowing it to continue investing in growth initiatives.
12. Key Takeaways from Dycom’s Q4 Results
We were impressed by how significantly Dycom blew past analysts’ revenue expectations this quarter. We were also glad its EBITDA outperformed Wall Street’s estimates. On the other hand, its EBITDA guidance for next quarter missed. Zooming out, we think this was a good print with some key areas of upside. The stock traded up 3.1% to $415.89 immediately following the results.
13. Is Now The Time To Buy Dycom?
Updated: March 17, 2026 at 11:28 PM EDT
Before making an investment decision, investors should account for Dycom’s business fundamentals and valuation in addition to what happened in the latest quarter.
Dycom is a high-quality business worth owning. To begin with, its revenue growth was impressive over the last five years, and its growth over the next 12 months is expected to accelerate. And while its low gross margins indicate some combination of competitive pressures and high production costs, its expanding operating margin shows the business has become more efficient. On top of that, Dycom’s astounding EPS growth over the last five years shows its profits are trickling down to shareholders.
Dycom’s P/E ratio based on the next 12 months is 25.3x. Looking across the spectrum of industrials companies today, Dycom’s fundamentals shine bright. We like the stock at this price.
Wall Street analysts have a consensus one-year price target of $461.42 on the company (compared to the current share price of $361.55), implying they see 27.6% upside in buying Dycom in the short term.