
Hayward (HAYW)
Hayward doesn’t impress us. Its weak sales growth and low returns on capital show it struggled to generate demand and profits.― StockStory Analyst Team
1. News


2. Summary
Why Hayward Is Not Exciting
Credited with introducing the first variable-speed pool pump, Hayward (NYSE:HAYW) makes residential and commercial pool equipment and accessories.
- Falling earnings per share over the last four years has some investors worried as stock prices ultimately follow EPS over the long term
- Estimated sales growth of 4.5% for the next 12 months implies demand will slow from its two-year trend
- On the bright side, its offerings are difficult to replicate at scale and result in a best-in-class gross margin of 47.9%


Hayward is in the penalty box. Better businesses are for sale in the market.
Why There Are Better Opportunities Than Hayward


Hayward’s stock price of $15.67 implies a valuation ratio of 19.2x forward P/E. This multiple is lower than most industrials companies, but for good reason.
Cheap stocks can look like a great deal at first glance, but they can be value traps. They often have less earnings power, meaning there is more reliance on a re-rating to generate good returns - an unlikely scenario for low-quality companies.
3. Hayward (HAYW) Research Report: Q4 CY2025 Update
Pool equipment and automation systems manufacturer Hayward Holdings (NYSE:HAYW) beat Wall Street’s revenue expectations in Q4 CY2025, with sales up 6.8% year on year to $349.4 million. Its non-GAAP profit of $0.29 per share was in line with analysts’ consensus estimates.
Hayward (HAYW) Q4 CY2025 Highlights:
- Revenue: $349.4 million vs analyst estimates of $332.7 million (6.8% year-on-year growth, 5% beat)
- Adjusted EPS: $0.29 vs analyst estimates of $0.28 (in line)
- Adjusted EBITDA: $102.9 million vs analyst estimates of $99.44 million (29.4% margin, 3.5% beat)
- Adjusted EPS guidance for the upcoming financial year 2026 is $0.84 at the midpoint, missing analyst estimates by 0.7%
- Operating Margin: 25%, up from 23.4% in the same quarter last year
- Free Cash Flow was -$34.26 million compared to -$70.43 million in the same quarter last year
- Market Capitalization: $3.40 billion
Company Overview
Credited with introducing the first variable-speed pool pump, Hayward (NYSE:HAYW) makes residential and commercial pool equipment and accessories.
Founded in 1925, the company has become a leader in the pool industry with one of the largest installed bases of pool equipment worldwide. Hayward operates in two reportable segments: North America (NAM) and Europe & Rest of World (E&RW). The NAM segment, consists of operations in the United States and Canada. The E&RW segment, covers all countries outside of North America, with Europe and Australia making up a significant portion.
The company offers a wide range of pool equipment, including pumps, filters, cleaners, heaters, sanitizers, LED lighting solutions, and automation systems. Hayward's products cater to both in-ground and above-ground pools, serving entry-level to premium markets. A significant portion of the company's sales comes from aftermarket replacements and upgrades, which provides a stable revenue stream.
Hayward sells its products through various channels, of which majority of sales are through specialty distributors, who then sell to pool builders and servicers. The company also sells directly to large retailers, pool builders, and buying groups.
The company maintains relationships with 700+ suppliers, primarily purchasing assembled components and raw materials. The company has long-standing relationships with many of its key suppliers, with an average relationship of over 15 years across its top 30 suppliers.
4. Home Construction Materials
Traditionally, home construction materials companies have built economic moats with expertise in specialized areas, brand recognition, and strong relationships with contractors. More recently, advances to address labor availability and job site productivity have spurred innovation that is driving incremental demand. However, these companies are at the whim of residential construction volumes, which tend to be cyclical and can be impacted heavily by economic factors such as interest rates. Additionally, the costs of raw materials can be driven by a myriad of worldwide factors and greatly influence the profitability of home construction materials companies.
Competitors in the pool equipment and accessories industry include Pool Corp (NASDAQ:POOL), Leslie’s (NASDAQ:LESL), and (Pentair (NYSE:PNR).
5. Revenue Growth
A company’s long-term performance is an indicator of its overall quality. Even a bad business can shine for one or two quarters, but a top-tier one grows for years. Unfortunately, Hayward’s 5.1% annualized revenue growth over the last five years was tepid. This was below our standard for the industrials sector and is a tough starting point for our analysis.
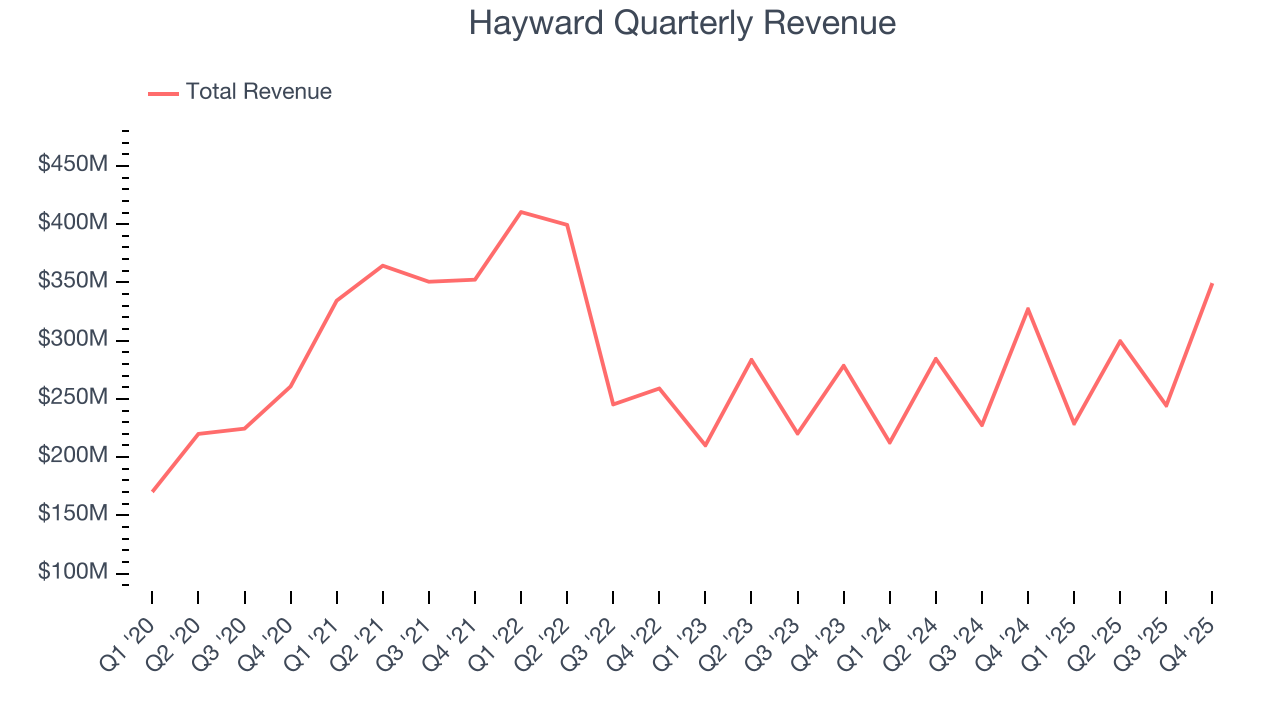
We at StockStory place the most emphasis on long-term growth, but within industrials, a half-decade historical view may miss cycles, industry trends, or a company capitalizing on catalysts such as a new contract win or a successful product line. Hayward’s annualized revenue growth of 6.3% over the last two years is above its five-year trend, which is encouraging. 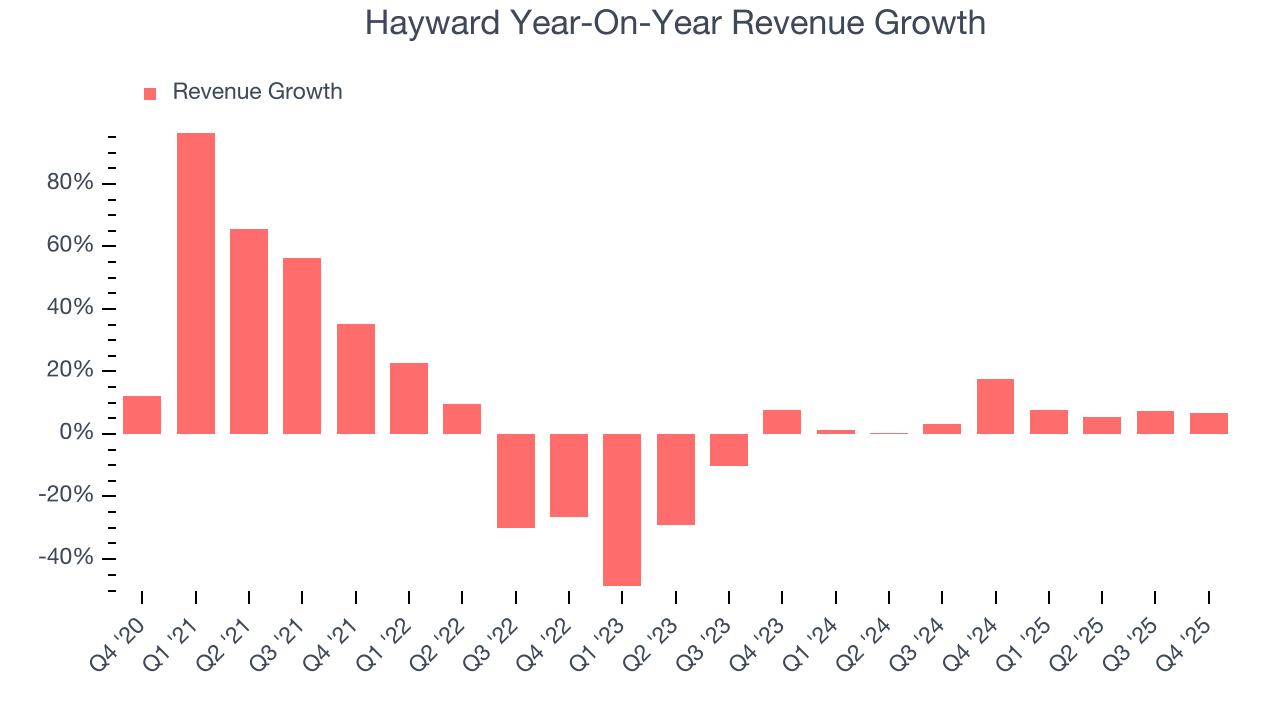
This quarter, Hayward reported year-on-year revenue growth of 6.8%, and its $349.4 million of revenue exceeded Wall Street’s estimates by 5%.
Looking ahead, sell-side analysts expect revenue to grow 3.8% over the next 12 months, a slight deceleration versus the last two years. This projection doesn't excite us and implies its products and services will see some demand headwinds.
6. Gross Margin & Pricing Power
Cost of sales for an industrials business is usually comprised of the direct labor, raw materials, and supplies needed to offer a product or service. These costs can be impacted by inflation and supply chain dynamics.
Hayward has best-in-class unit economics for an industrials company, enabling it to invest in areas such as research and development. Its margin also signals it sells differentiated products, not commodities. As you can see below, it averaged an elite 48% gross margin over the last five years. Said differently, roughly $48.05 was left to spend on selling, marketing, R&D, and general administrative overhead for every $100 in revenue. 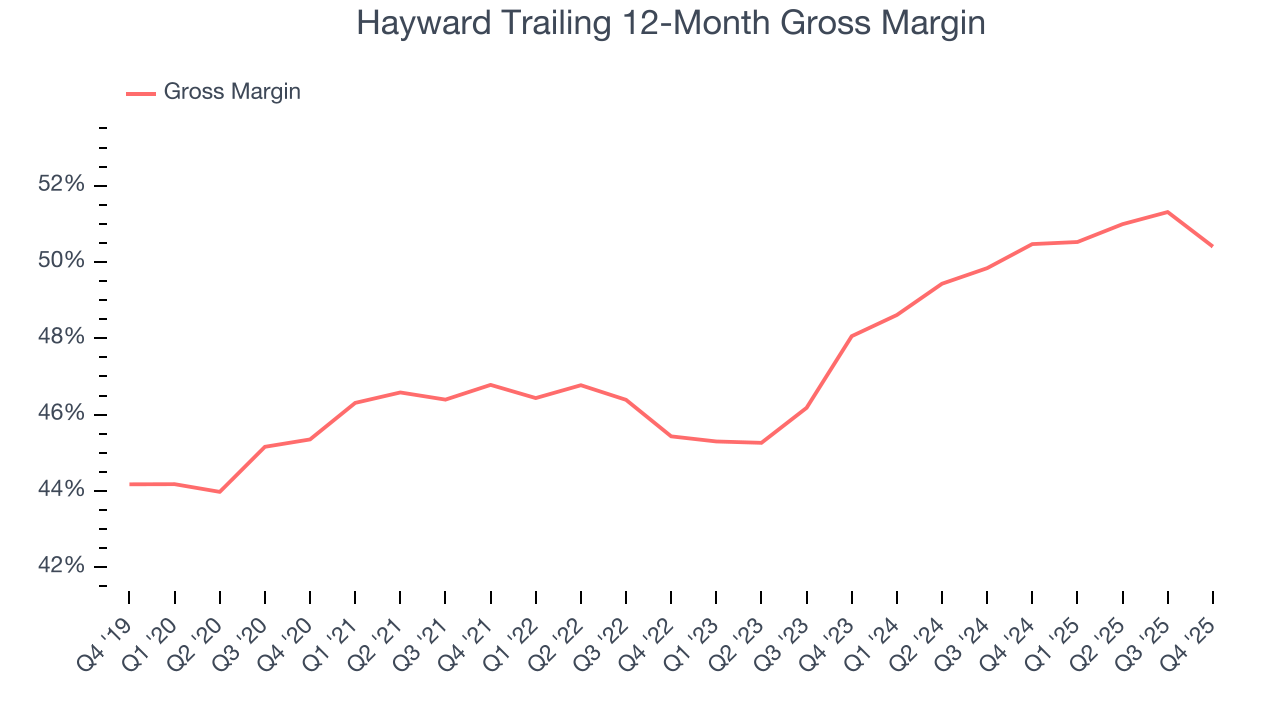
This quarter, Hayward’s gross profit margin was 48.5% , marking a 2.9 percentage point decrease from 51.4% in the same quarter last year. Zooming out, the company’s full-year margin has remained steady over the past 12 months, suggesting its input costs (such as raw materials and manufacturing expenses) have been stable and it isn’t under pressure to lower prices.
7. Operating Margin
Operating margin is one of the best measures of profitability because it tells us how much money a company takes home after procuring and manufacturing its products, marketing and selling those products, and most importantly, keeping them relevant through research and development.
Hayward has been a well-oiled machine over the last five years. It demonstrated elite profitability for an industrials business, boasting an average operating margin of 20.8%. This result isn’t surprising as its high gross margin gives it a favorable starting point.
Analyzing the trend in its profitability, Hayward’s operating margin decreased by 1.9 percentage points over the last five years. This raises questions about the company’s expense base because its revenue growth should have given it leverage on its fixed costs, resulting in better economies of scale and profitability.
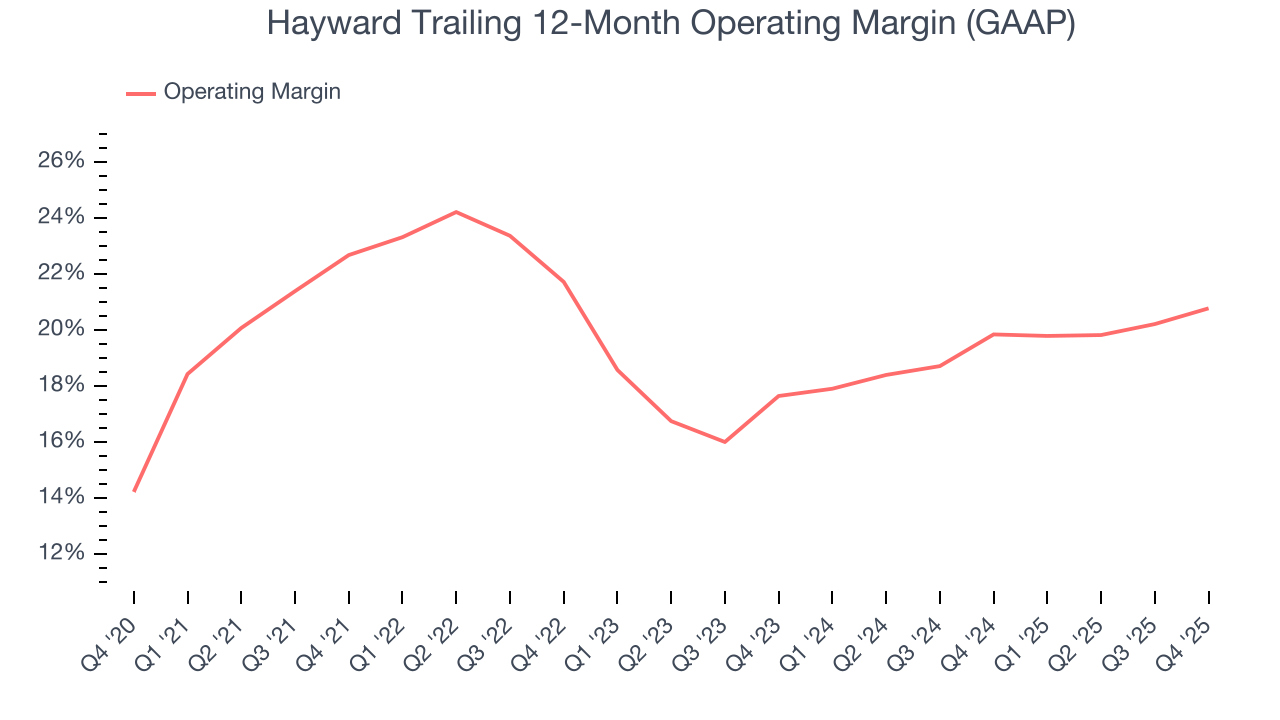
In Q4, Hayward generated an operating margin profit margin of 25%, up 1.6 percentage points year on year. The increase was encouraging, and because its gross margin actually decreased, we can assume it was more efficient because its operating expenses like marketing, R&D, and administrative overhead grew slower than its revenue.
8. Earnings Per Share
We track the long-term change in earnings per share (EPS) for the same reason as long-term revenue growth. Compared to revenue, however, EPS highlights whether a company’s growth is profitable.
Hayward’s full-year EPS dropped 113%, or 20.8% annually, over the last four years. We’ll keep a close eye on the company as diminishing earnings could imply changing secular trends and preferences.
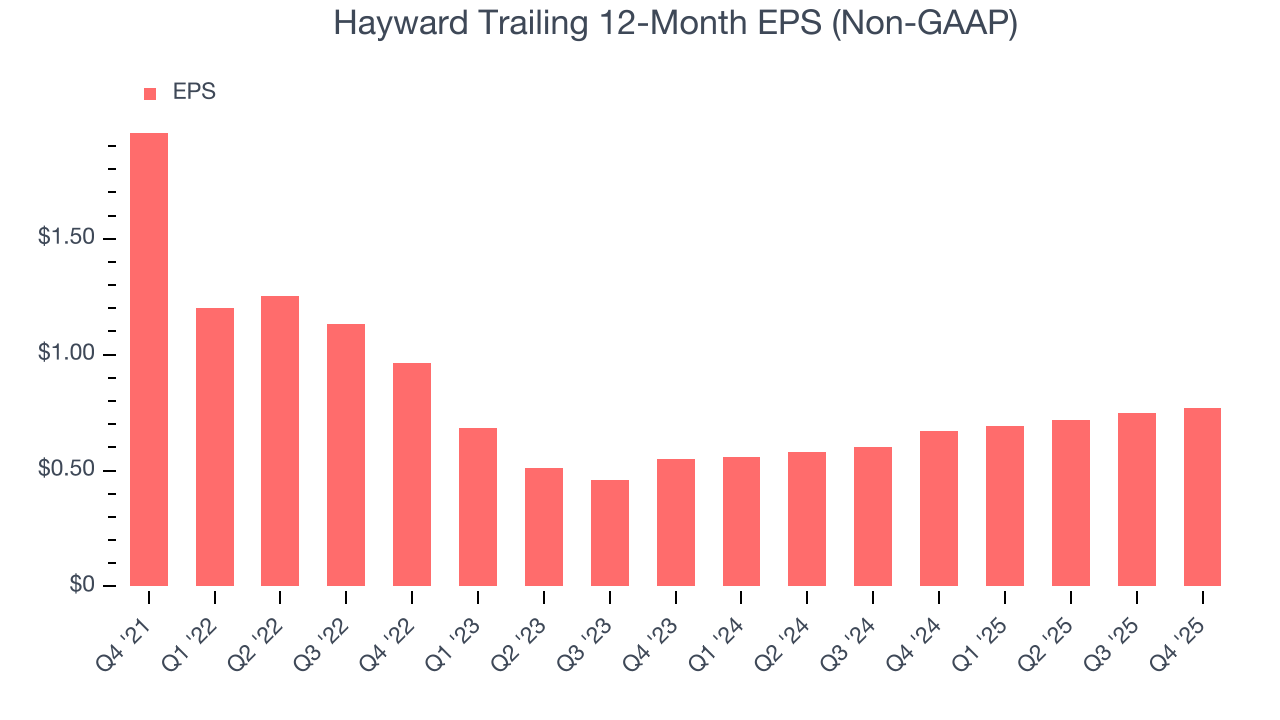
Like with revenue, we analyze EPS over a shorter period to see if we are missing a change in the business.
Hayward’s EPS grew at an astounding 18.3% compounded annual growth rate over the last two years, higher than its 6.3% annualized revenue growth. This tells us the company became more profitable on a per-share basis as it expanded.
Diving into the nuances of Hayward’s earnings can give us a better understanding of its performance. Hayward’s operating margin has expanded over the last two years. This was the most relevant factor (aside from the revenue impact) behind its higher earnings; interest expenses and taxes can also affect EPS but don’t tell us as much about a company’s fundamentals.
In Q4, Hayward reported adjusted EPS of $0.29, up from $0.27 in the same quarter last year. This print beat analysts’ estimates by 3.1%. Over the next 12 months, Wall Street expects Hayward’s full-year EPS of $0.77 to grow 10.7%.
9. Cash Is King
Free cash flow isn't a prominently featured metric in company financials and earnings releases, but we think it's telling because it accounts for all operating and capital expenses, making it tough to manipulate. Cash is king.
Hayward has shown terrific cash profitability, putting it in an advantageous position to invest in new products, return capital to investors, and consolidate the market during industry downturns. The company’s free cash flow margin was among the best in the industrials sector, averaging 13.9% over the last five years.
Taking a step back, we can see that Hayward’s margin expanded by 8.8 percentage points during that time. This is encouraging, and we can see it became a less capital-intensive business because its free cash flow profitability rose while its operating profitability fell.
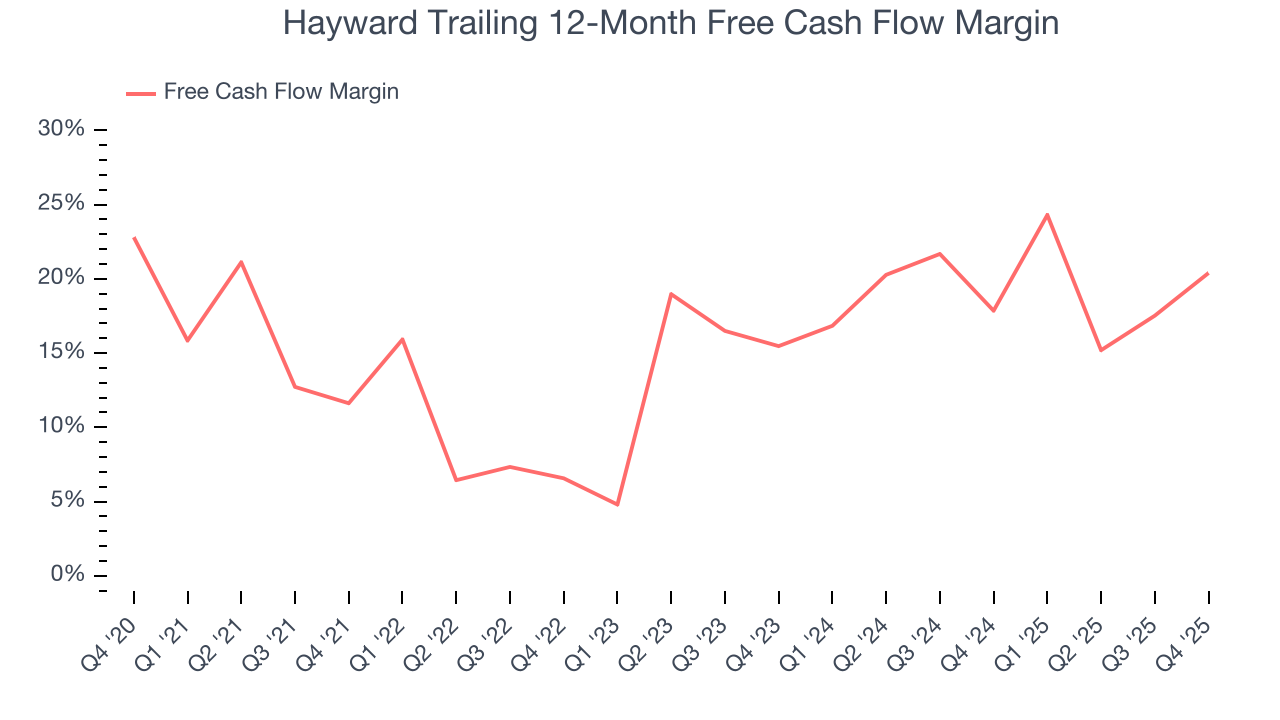
Hayward burned through $34.26 million of cash in Q4, equivalent to a negative 9.8% margin. The company’s cash burn slowed from $70.43 million of lost cash in the same quarter last year. These numbers deviate from its longer-term margin, indicating it is a seasonal business that must build up inventory during certain quarters.
10. Return on Invested Capital (ROIC)
EPS and free cash flow tell us whether a company was profitable while growing its revenue. But was it capital-efficient? Enter ROIC, a metric showing how much operating profit a company generates relative to the money it has raised (debt and equity).
Hayward historically did a mediocre job investing in profitable growth initiatives. Its five-year average ROIC was 8.7%, somewhat low compared to the best industrials companies that consistently pump out 20%+.
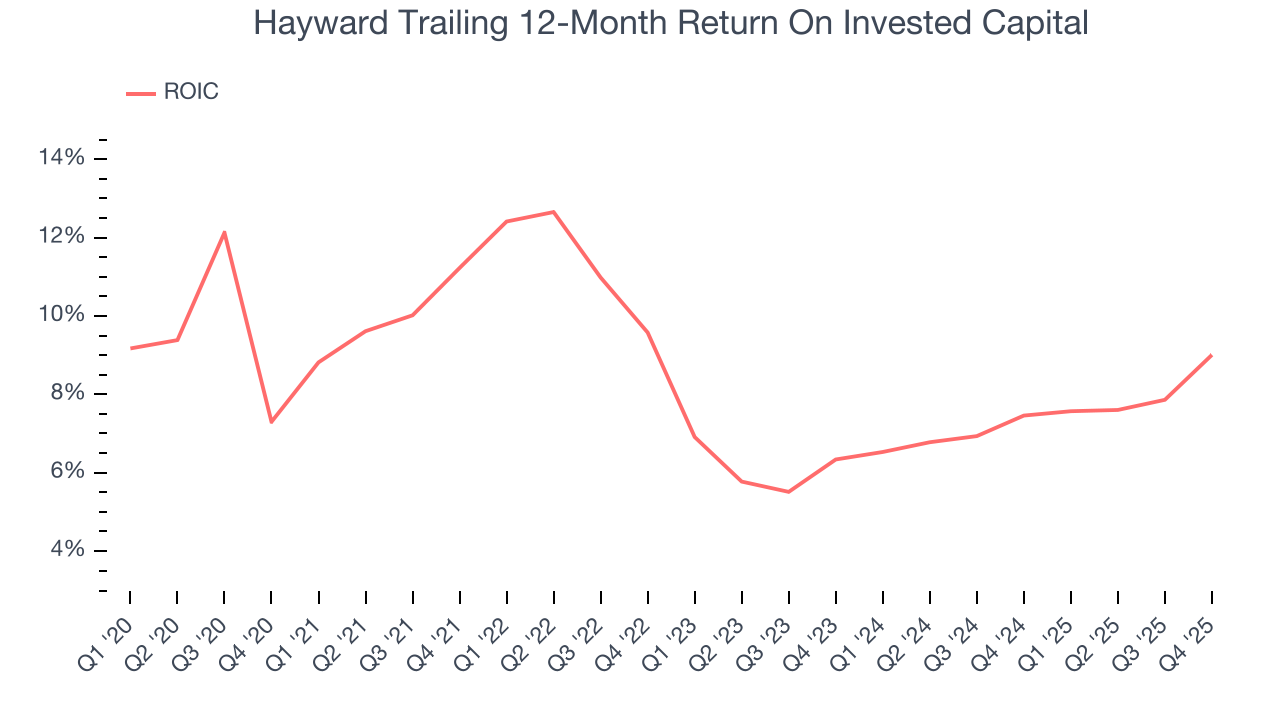
We like to invest in businesses with high returns, but the trend in a company’s ROIC is what often surprises the market and moves the stock price. Unfortunately, Hayward’s ROIC averaged 2.2 percentage point decreases each year over the last few years. Paired with its already low returns, these declines suggest its profitable growth opportunities are few and far between.
11. Balance Sheet Assessment
Hayward reported $399.1 million of cash and $956.8 million of debt on its balance sheet in the most recent quarter. As investors in high-quality companies, we primarily focus on two things: 1) that a company’s debt level isn’t too high and 2) that its interest payments are not excessively burdening the business.
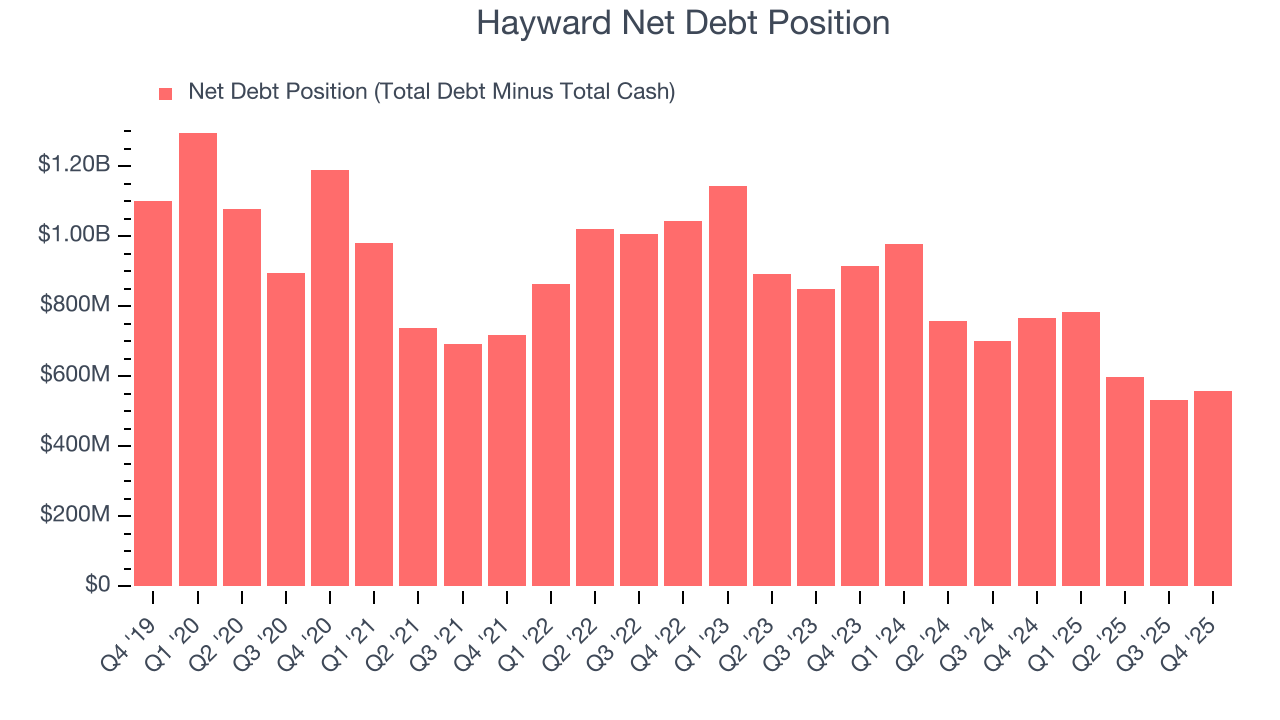
With $299.3 million of EBITDA over the last 12 months, we view Hayward’s 1.9× net-debt-to-EBITDA ratio as safe. We also see its $26.95 million of annual interest expenses as appropriate. The company’s profits give it plenty of breathing room, allowing it to continue investing in growth initiatives.
12. Key Takeaways from Hayward’s Q4 Results
We were impressed by how significantly Hayward blew past analysts’ revenue expectations this quarter. We were also happy its EBITDA outperformed Wall Street’s estimates. On the other hand, its full-year EPS guidance slightly missed. Overall, we think this was a decent quarter with some key metrics above expectations. The stock remained flat at $15.67 immediately following the results.
13. Is Now The Time To Buy Hayward?
Updated: February 25, 2026 at 7:17 AM EST
We think that the latest earnings result is only one piece of the bigger puzzle. If you’re deciding whether to own Hayward, you should also grasp the company’s longer-term business quality and valuation.
Hayward has some positive attributes, but it isn’t one of our picks. Although its revenue growth was uninspiring over the last five years and analysts expect growth to slow over the next 12 months, its admirable gross margins indicate the mission-critical nature of its offerings. We advise investors to be cautious with this one, however, as its declining EPS over the last four years makes it a less attractive asset to the public markets.
Hayward’s P/E ratio based on the next 12 months is 18.4x. This valuation is reasonable, but the company’s shakier fundamentals present too much downside risk. We're pretty confident there are superior stocks to buy right now.
Wall Street analysts have a consensus one-year price target of $18 on the company (compared to the current share price of $15.67).