Procter & Gamble (PG)
Procter & Gamble catches our eye. Its high free cash flow margin and returns on capital show it can produce cash and invest it wisely.― StockStory Analyst Team
1. News


2. Summary
Why Procter & Gamble Is Interesting
Founded by candle maker William Procter and soap maker James Gamble, Proctor & Gamble (NYSE:PG) is a consumer products behemoth whose product portfolio spans everything from facial tissues to laundry detergent to feminine care to men’s grooming.
- Disciplined cost controls and effective management have materialized in a strong operating margin
- Robust free cash flow profile gives it the flexibility to invest in growth initiatives or return capital to shareholders
- One risk is its large revenue base makes it harder to increase sales quickly, and its annual revenue growth of 2% over the last three years was below our standards for the consumer staples sector


Procter & Gamble has some noteworthy aspects. This company is certainly worth watching.
Why Should You Watch Procter & Gamble


Procter & Gamble’s stock price of $150.32 implies a valuation ratio of 21.1x forward P/E. Procter & Gamble’s valuation is richer than that of other consumer staples companies, on average.
If Procter & Gamble strings together a few solid quarters and proves it can be a high-quality company, we’d be more open to investing.
3. Procter & Gamble (PG) Research Report: Q4 CY2025 Update
Consumer products behemoth Proctor & Gamble (NYSE:PG) met Wall Streets revenue expectations in Q4 CY2025, with sales up 1.5% year on year to $22.21 billion. Its non-GAAP profit of $1.88 per share was 1.2% above analysts’ consensus estimates.
Procter & Gamble (PG) Q4 CY2025 Highlights:
- Revenue: $22.21 billion vs analyst estimates of $22.29 billion (1.5% year-on-year growth, in line)
- Adjusted EPS: $1.88 vs analyst estimates of $1.86 (1.2% beat)
- Adjusted EBITDA: $6.39 billion vs analyst estimates of $6.46 billion (28.8% margin, 1% miss)
- Management reiterated its full-year Adjusted EPS guidance of $6.96 at the midpoint
- Operating Margin: 24.2%, down from 27.2% in the same quarter last year
- Free Cash Flow Margin: 17.1%, similar to the same quarter last year
- Organic Revenue was flat year on year
- Sales Volumes fell 1% year on year (1% in the same quarter last year)
- Market Capitalization: $341.3 billion
Company Overview
Founded by candle maker William Procter and soap maker James Gamble, Proctor & Gamble (NYSE:PG) is a consumer products behemoth whose product portfolio spans everything from facial tissues to laundry detergent to feminine care to men’s grooming.
You’ve probably heard of Bounty paper towels, Pampers diapers, Tide laundry detergent, Gillette razors, and Crest toothpaste–these are some of the company’s powerhouse brands. These brands are both household mainstays as well as innovators that help steer the direction of these categories. For example, Tide introduced the first synthetic laundry detergent (made from petrochemicals) in the 1940s, moving the industry away from traditional soaps (lye and fats). Additionally, Gillette was a pioneer in multi-blade technology that resulted in a closer shave with less irritation.
Given its vast portfolio, Gillette’s core customer is nearly everyone who shops for the personal care or hygiene needs of themselves or their family members. These customers seek a brand that’s familiar and trusted, first and foremost. Additionally, these customers want cost-effective products, although many are willing to pay a reasonable premium to buy established brands rather than lesser-known or private-label brands.
It’s probably harder to avoid Gillette products rather than to find them. They drive traffic and are prominently featured on the shelves of grocery stores, mass merchandise retailers, drug stores, and specialty retailers.
4. Household Products
Household products stocks are generally stable investments, as many of the industry's products are essential for a comfortable and functional living space. Recently, there's been a growing emphasis on eco-friendly and sustainable offerings, reflecting the evolving consumer preferences for environmentally conscious options. These trends can be double-edged swords that benefit companies who innovate quickly to take advantage of them and hurt companies that don't invest enough to meet consumers where they want to be with regards to trends.
Competitors that offer a wide range of household and personal care products include Kimberly-Clark (NYSE:KMB), Unilever (LSE:ULVR), Colgate-Palmolive (NYSE:CL), and Church & Dwight (NYSE:CHD).
5. Revenue Growth
Reviewing a company’s long-term sales performance reveals insights into its quality. Any business can put up a good quarter or two, but many enduring ones grow for years.
With $85.26 billion in revenue over the past 12 months, Procter & Gamble is one of the most widely recognized consumer staples companies. Its influence over consumers gives it negotiating leverage with distributors, enabling it to pick and choose where it sells its products (a luxury many don’t have). However, its scale is a double-edged sword because it’s harder to find incremental growth when your existing brands have penetrated most of the market. For Procter & Gamble to boost its sales, it likely needs to adjust its prices, launch new offerings, or lean into foreign markets.
As you can see below, Procter & Gamble’s sales grew at a sluggish 2% compounded annual growth rate over the last three years. This shows it failed to generate demand in any major way and is a rough starting point for our analysis.
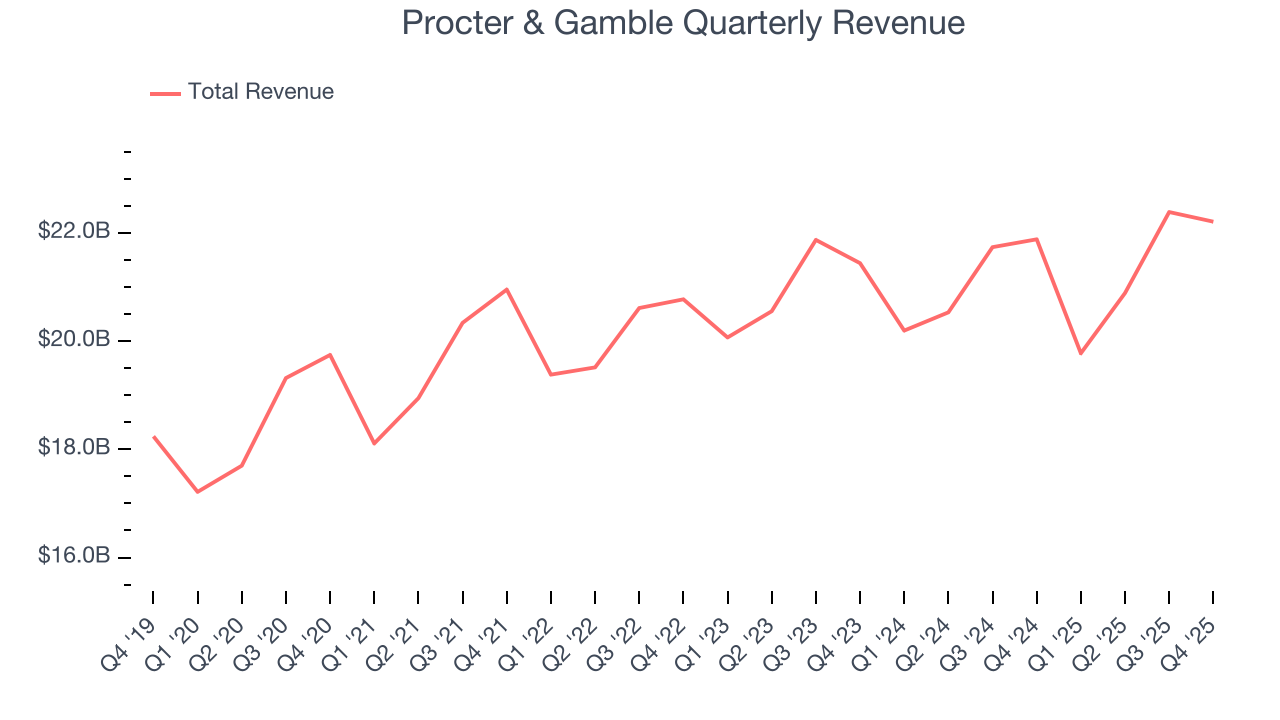
This quarter, Procter & Gamble grew its revenue by 1.5% year on year, and its $22.21 billion of revenue was in line with Wall Street’s estimates.
Looking ahead, sell-side analysts expect revenue to grow 3.3% over the next 12 months, similar to its three-year rate. While this projection indicates its newer products will spur better top-line performance, it is still below the sector average.
6. Volume Growth
Revenue growth can be broken down into changes in price and volume (the number of units sold). While both are important, volume is the lifeblood of a successful staples business as there’s a ceiling to what consumers will pay for everyday goods; they can always trade down to non-branded products if the branded versions are too expensive.
Procter & Gamble’s quarterly sales volumes have, on average, stayed about the same over the last two years. This stability is normal because the quantity demanded for consumer staples products typically doesn’t see much volatility. 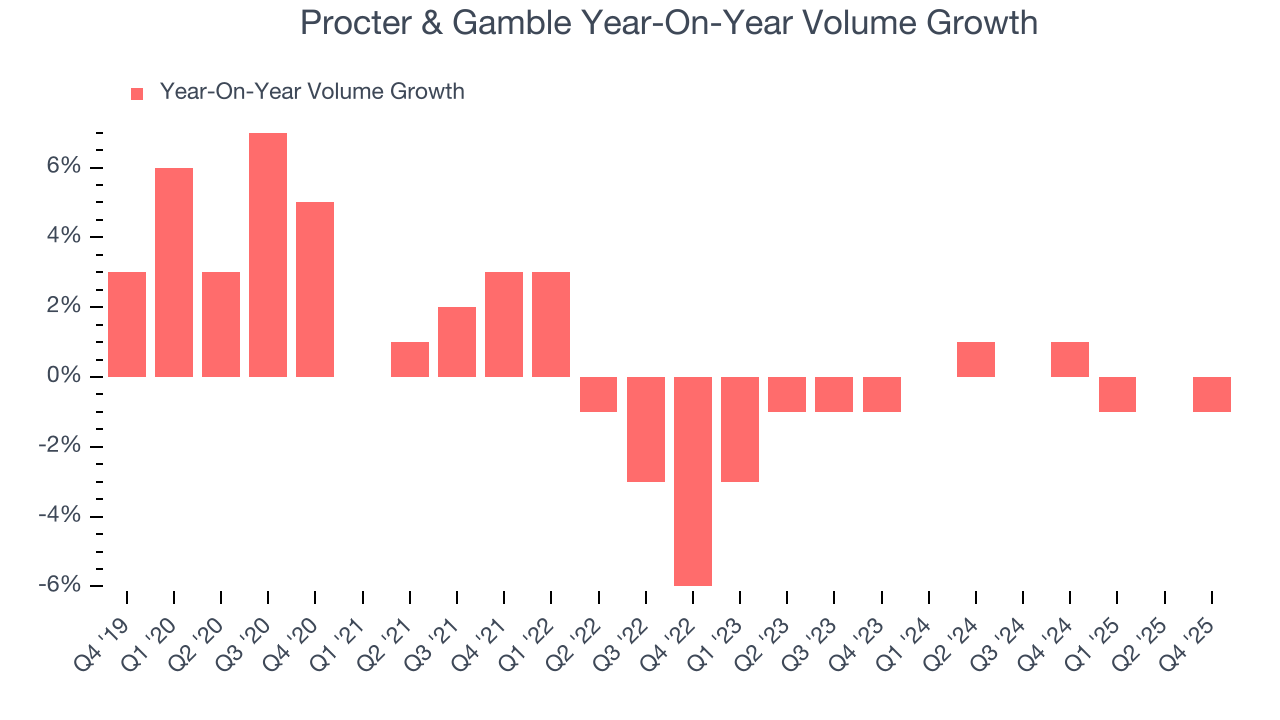
In Procter & Gamble’s Q4 2026, sales volumes dropped 1% year on year.
7. Gross Margin & Pricing Power
Procter & Gamble has great unit economics for a consumer staples company, giving it ample room to invest in areas such as marketing and talent to grow its brand. As you can see below, it averaged an excellent 51.3% gross margin over the last two years. That means Procter & Gamble only paid its suppliers $48.72 for every $100 in revenue. 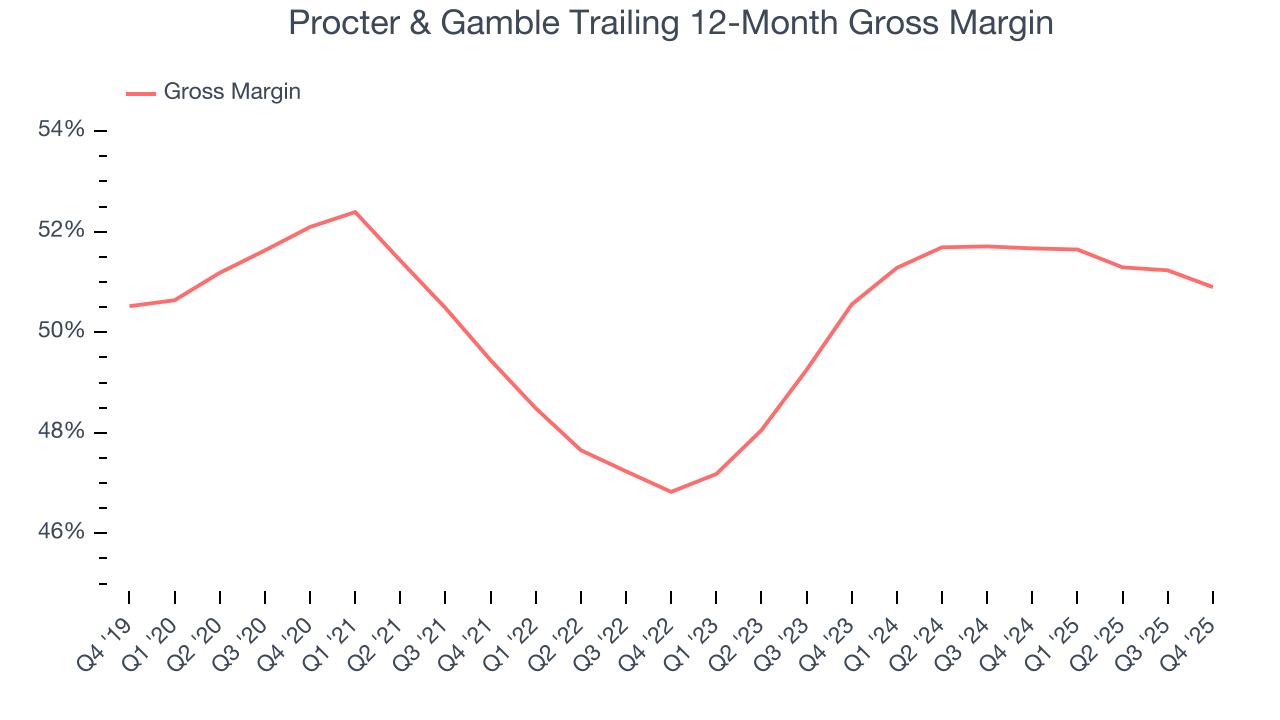
This quarter, Procter & Gamble’s gross profit margin was 51.2%, marking a 1.3 percentage point decrease from 52.5% in the same quarter last year. Zooming out, the company’s full-year margin has remained steady over the past 12 months, suggesting its input costs (such as raw materials and manufacturing expenses) have been stable and it isn’t under pressure to lower prices.
8. Operating Margin
Operating margin is a key profitability metric because it accounts for all expenses enabling a business to operate smoothly, including marketing and advertising, IT systems, wages, and other administrative costs.
Procter & Gamble’s operating margin might fluctuated slightly over the last 12 months but has generally stayed the same, averaging 25.2% over the last two years. This profitability was elite for a consumer staples business thanks to its efficient cost structure and economies of scale. This result isn’t surprising as its high gross margin gives it a favorable starting point.
Analyzing the trend in its profitability, Procter & Gamble’s operating margin might fluctuated slightly but has generally stayed the same over the last year. This raises questions about the company’s expense base because its revenue growth should have given it leverage on its fixed costs, resulting in better economies of scale and profitability.
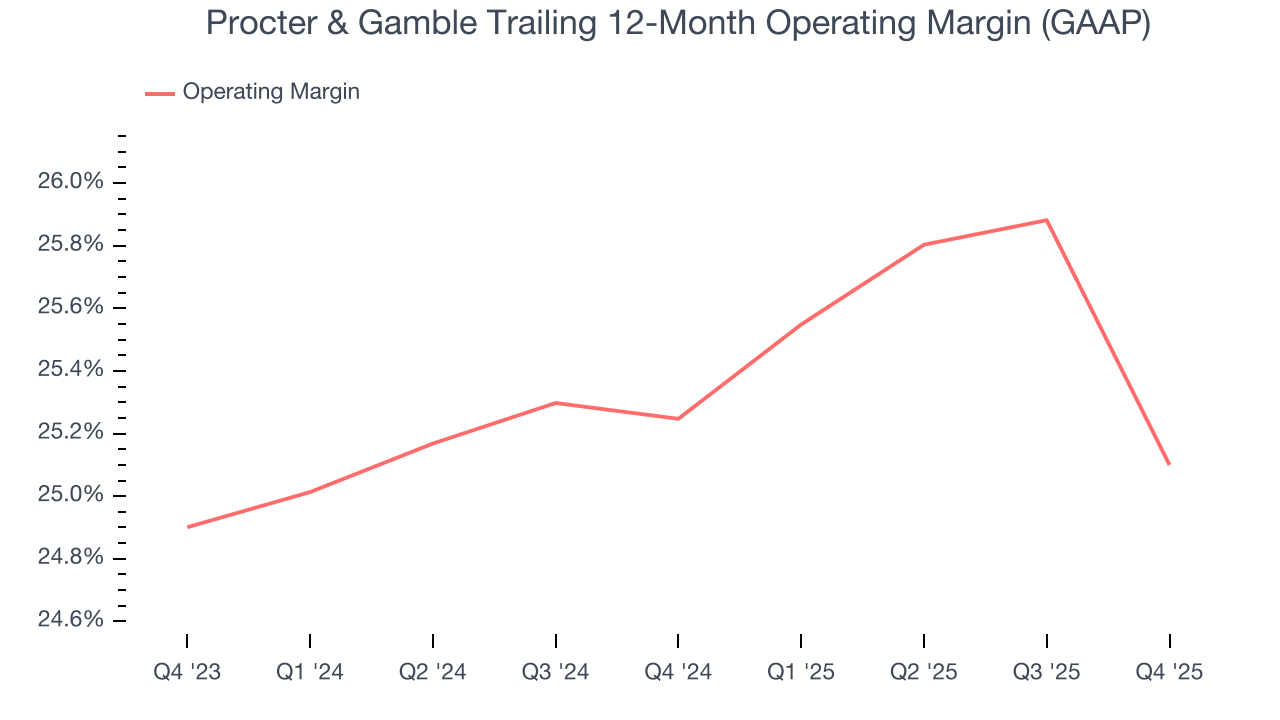
This quarter, Procter & Gamble generated an operating margin profit margin of 24.2%, down 3 percentage points year on year. Since Procter & Gamble’s operating margin decreased more than its gross margin, we can assume it was less efficient because expenses such as marketing, and administrative overhead increased.
9. Earnings Per Share
Revenue trends explain a company’s historical growth, but the long-term change in earnings per share (EPS) points to the profitability of that growth – for example, a company could inflate its sales through excessive spending on advertising and promotions.
Procter & Gamble’s EPS grew at a decent 6.5% compounded annual growth rate over the last three years, higher than its 2% annualized revenue growth. However, this alone doesn’t tell us much about its business quality because its operating margin didn’t improve.
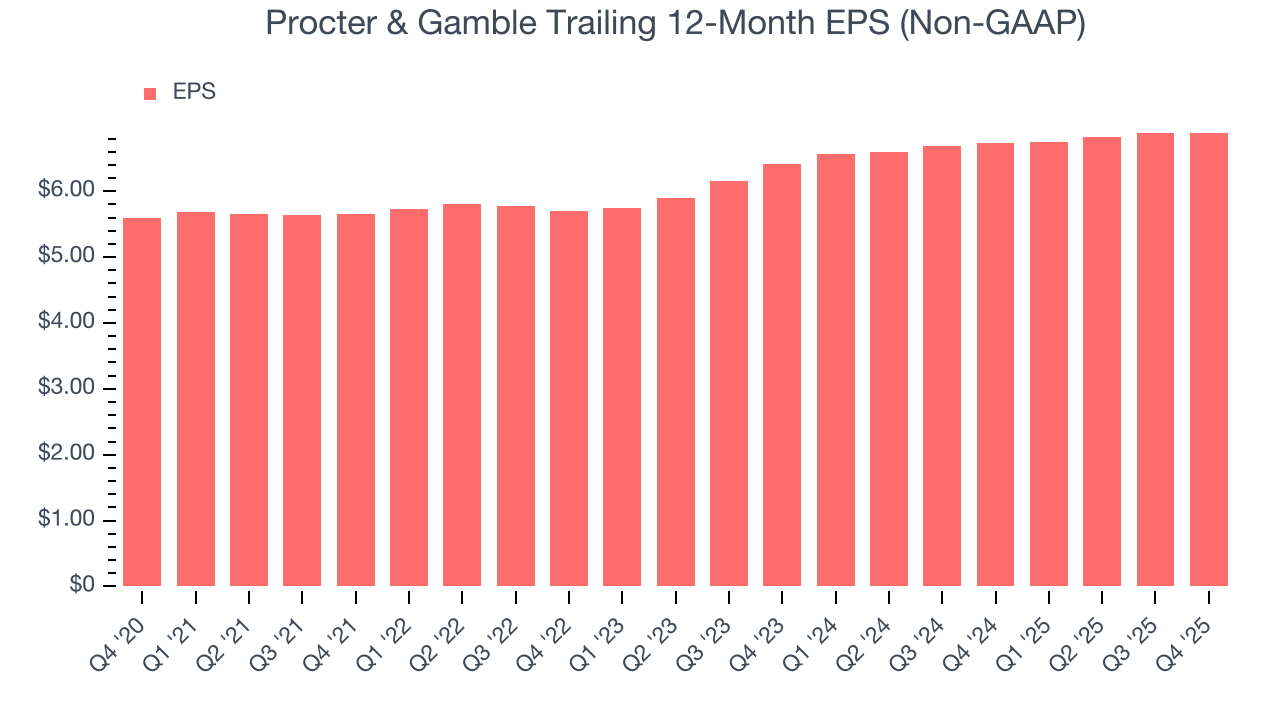
In Q4, Procter & Gamble reported adjusted EPS of $1.88, in line with the same quarter last year. This print beat analysts’ estimates by 1.2%. Over the next 12 months, Wall Street expects Procter & Gamble’s full-year EPS of $6.89 to grow 3.6%.
10. Cash Is King
If you’ve followed StockStory for a while, you know we emphasize free cash flow. Why, you ask? We believe that in the end, cash is king, and you can’t use accounting profits to pay the bills.
Procter & Gamble has shown terrific cash profitability, driven by its lucrative business model that enables it to reinvest, return capital to investors, and stay ahead of the competition. The company’s free cash flow margin was among the best in the consumer staples sector, averaging 18.3% over the last two years.
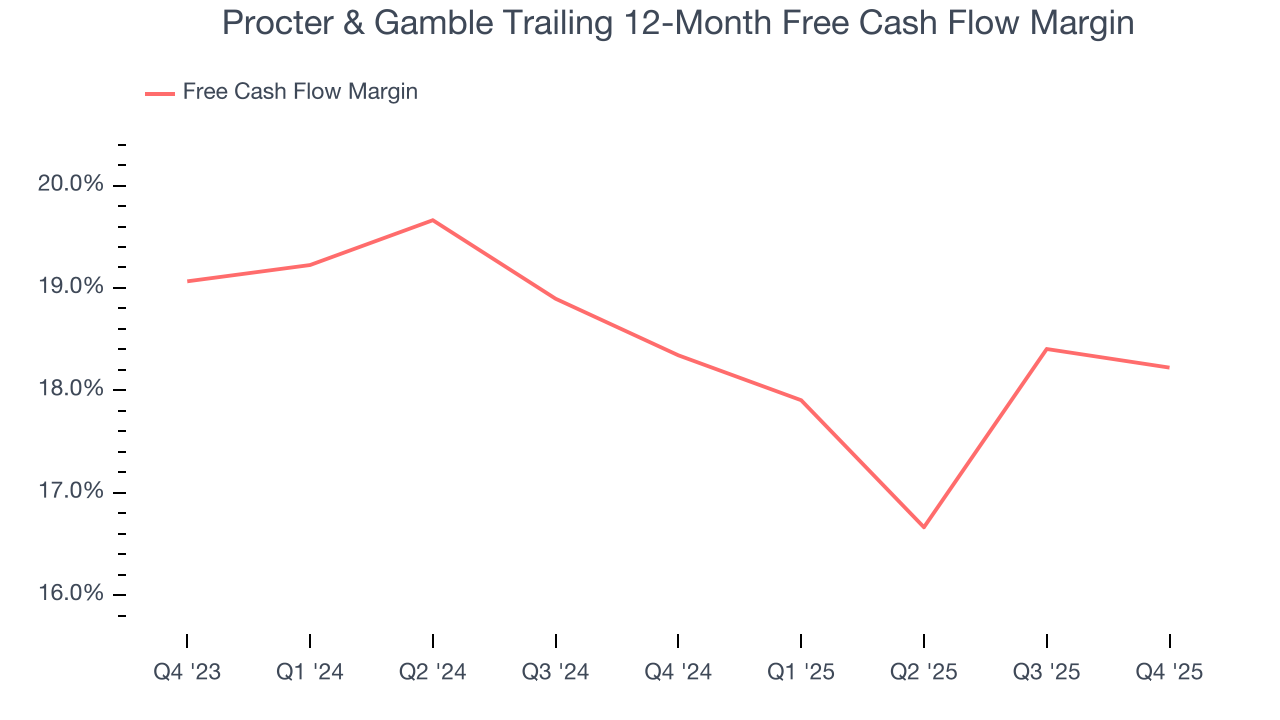
Procter & Gamble’s free cash flow clocked in at $3.81 billion in Q4, equivalent to a 17.1% margin. This cash profitability was in line with the comparable period last year but below its two-year average. We wouldn’t read too much into it because investment needs can be seasonal, causing short-term swings. Long-term trends trump temporary fluctuations.
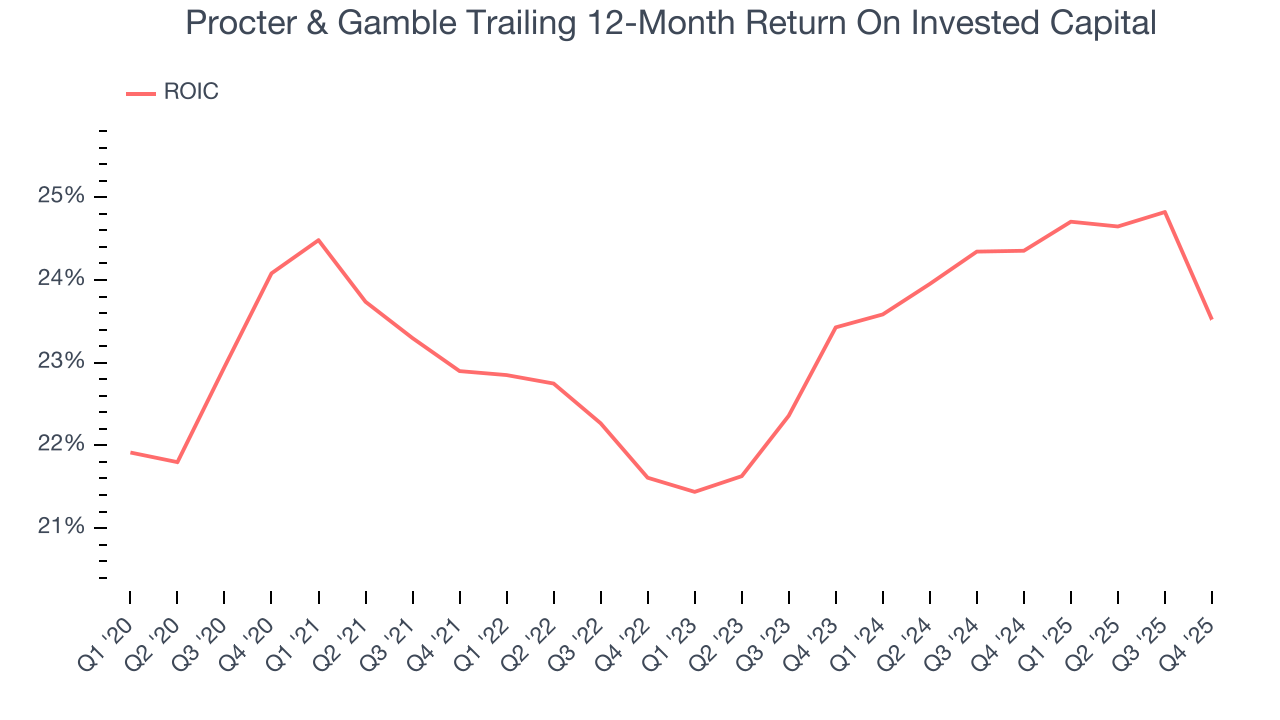
11. Return on Invested Capital (ROIC)
EPS and free cash flow tell us whether a company was profitable while growing its revenue. But was it capital-efficient? A company’s ROIC explains this by showing how much operating profit it makes compared to the money it has raised (debt and equity).
Although Procter & Gamble hasn’t been the highest-quality company lately because of its poor top-line performance, it historically found a few growth initiatives that worked out well. Its five-year average ROIC was 23.2%, impressive for a consumer staples business.
12. Balance Sheet Assessment
Procter & Gamble reported $10.83 billion of cash and $36.64 billion of debt on its balance sheet in the most recent quarter. As investors in high-quality companies, we primarily focus on two things: 1) that a company’s debt level isn’t too high and 2) that its interest payments are not excessively burdening the business.
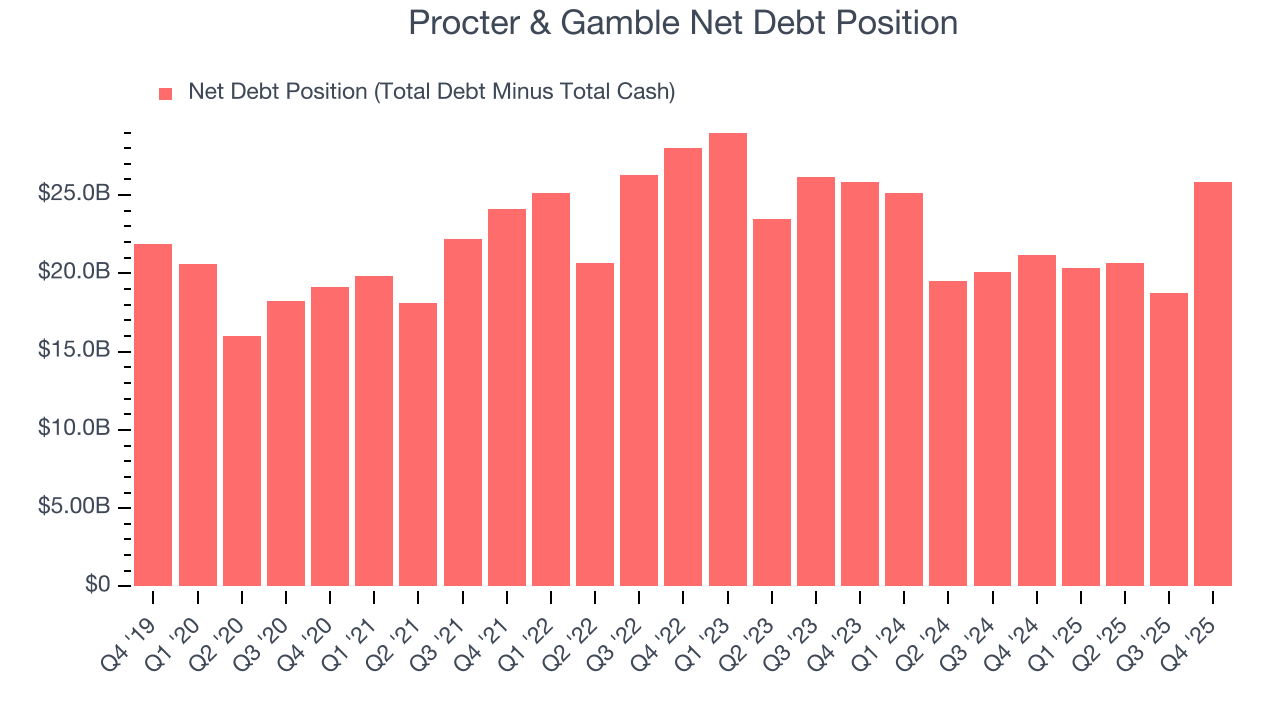
With $24.72 billion of EBITDA over the last 12 months, we view Procter & Gamble’s 1.0× net-debt-to-EBITDA ratio as safe. We also see its $198 million of annual interest expenses as appropriate. The company’s profits give it plenty of breathing room, allowing it to continue investing in growth initiatives.
13. Key Takeaways from Procter & Gamble’s Q4 Results
We struggled to find many positives in these results. Volumes shrank year-on-year. Its gross margin missed and EBITDA also both fell slightly short of Wall Street’s estimates. Overall, this was a weaker quarter. The stock traded down 1.9% to $143.31 immediately after reporting.
14. Is Now The Time To Buy Procter & Gamble?
Updated: March 14, 2026 at 10:50 PM EDT
Before deciding whether to buy Procter & Gamble or pass, we urge investors to consider business quality, valuation, and the latest quarterly results.
There are things to like about Procter & Gamble. Although its revenue growth was uninspiring over the last three years, its growth over the next 12 months is expected to be higher. And while Procter & Gamble’s projected EPS for the next year is lacking, its impressive operating margins show it has a highly efficient business model. On top of that, its powerful free cash flow generation enables it to stay ahead of the competition through consistent reinvestment of profits.
Procter & Gamble’s P/E ratio based on the next 12 months is 21.1x. This multiple tells us that a lot of good news is priced in. This is a good one to add to your watchlist - there are better opportunities elsewhere at the moment.
Wall Street analysts have a consensus one-year price target of $168 on the company (compared to the current share price of $150.32).