
Kimberly-Clark (KMB)
We’re skeptical of Kimberly-Clark. Its sales and profitability have plummeted, suggesting it struggled to scale down its costs as demand faded.― StockStory Analyst Team
1. News


2. Summary
Why Kimberly-Clark Is Not Exciting
Originally founded as a Wisconsin paper mill in 1872, Kimberly-Clark (NYSE:KMB) is now a household products powerhouse known for personal care and tissue products.
- Products aren't resonating with the market as its revenue declined by 6.6% annually over the last three years
- Organic sales performance over the past two years indicates the company may need to make strategic adjustments or rely on M&A to catalyze faster growth
- A consolation is that its economies of scale give it more fixed cost leverage than its smaller competitors


Kimberly-Clark doesn’t fulfill our quality requirements. There are more rewarding stocks elsewhere.
Why There Are Better Opportunities Than Kimberly-Clark


At $98.72 per share, Kimberly-Clark trades at 12.9x forward P/E. Kimberly-Clark’s valuation may seem like a bargain, especially when stacked up against other consumer staples companies. We remind you that you often get what you pay for, though.
Cheap stocks can look like a great deal at first glance, but they can be value traps. They often have less earnings power, meaning there is more reliance on a re-rating to generate good returns - an unlikely scenario for low-quality companies.
3. Kimberly-Clark (KMB) Research Report: Q4 CY2025 Update
Household products company Kimberly-Clark (NYSE:KMB) met Wall Streets revenue expectations in Q4 CY2025, but sales were flat year on year at $4.08 billion. Its non-GAAP profit of $1.86 per share was 2.7% above analysts’ consensus estimates.
Kimberly-Clark (KMB) Q4 CY2025 Highlights:
- Revenue: $4.08 billion vs analyst estimates of $4.09 billion (flat year on year, in line)
- Adjusted EPS: $1.86 vs analyst estimates of $1.81 (2.7% beat)
- Operating Margin: 12.4%, up from 10.2% in the same quarter last year
- Free Cash Flow Margin: 14.1%, similar to the same quarter last year
- Organic Revenue rose 2.1% year on year (in line)
- Market Capitalization: $33.57 billion
Company Overview
Originally founded as a Wisconsin paper mill in 1872, Kimberly-Clark (NYSE:KMB) is now a household products powerhouse known for personal care and tissue products.
Huggies, Pull-Ups, Kleenex, Scott, and Depends are some of the company’s iconic brands in baby care, tissue and paper products, and adult hygiene. Kimberly-Clark also has a robust professional business that sells products such as paper towels to large enterprises and business customers.
Kimberly-Clark uniquely serves customers throughout their entire lives. From the moment they’re born, infants and babies rely on the company’s diapers and pull-ups. Children and adults alike are consumers of Kimberly-Clark’s tissues, toilet paper, and paper towels. In their advanced age, many older folks are users of the company’s adult diapers. No matter their age, core customers want cost-effective products, although many are willing to pay a reasonable premium to buy established brands rather than lesser-known or private-label brands.
Kimberly-Clark products are almost ubiquitous. Grocery stores, mass merchandise retailers, drug stores, and specialty retailers typically all sell the company’s products. Given Kimberly-Clark’s scale in its categories and traffic-driving brands, the company often enjoys advantaged placement on retailer shelves.
4. Household Products
Household products stocks are generally stable investments, as many of the industry's products are essential for a comfortable and functional living space. Recently, there's been a growing emphasis on eco-friendly and sustainable offerings, reflecting the evolving consumer preferences for environmentally conscious options. These trends can be double-edged swords that benefit companies who innovate quickly to take advantage of them and hurt companies that don't invest enough to meet consumers where they want to be with regards to trends.
Competitors that offer a wide range of household and personal care products include Proctor & Gamble (NYSE:PG), Unilever (LSE:ULVR), and Church & Dwight (NYSE:CHD).
5. Revenue Growth
Reviewing a company’s long-term sales performance reveals insights into its quality. Even a bad business can shine for one or two quarters, but a top-tier one grows for years.
With $16.45 billion in revenue over the past 12 months, Kimberly-Clark is one of the larger consumer staples companies and benefits from a well-known brand that influences purchasing decisions. However, its scale is a double-edged sword because there are only so many big store chains to sell into, making it harder to find incremental growth. To accelerate sales, Kimberly-Clark likely needs to optimize its pricing or lean into new products and international expansion.
As you can see below, Kimberly-Clark struggled to generate demand over the last three years. Its sales dropped by 6.6% annually despite consumers buying more of its products. We’ll explore what this means in the "Volume Growth" section.
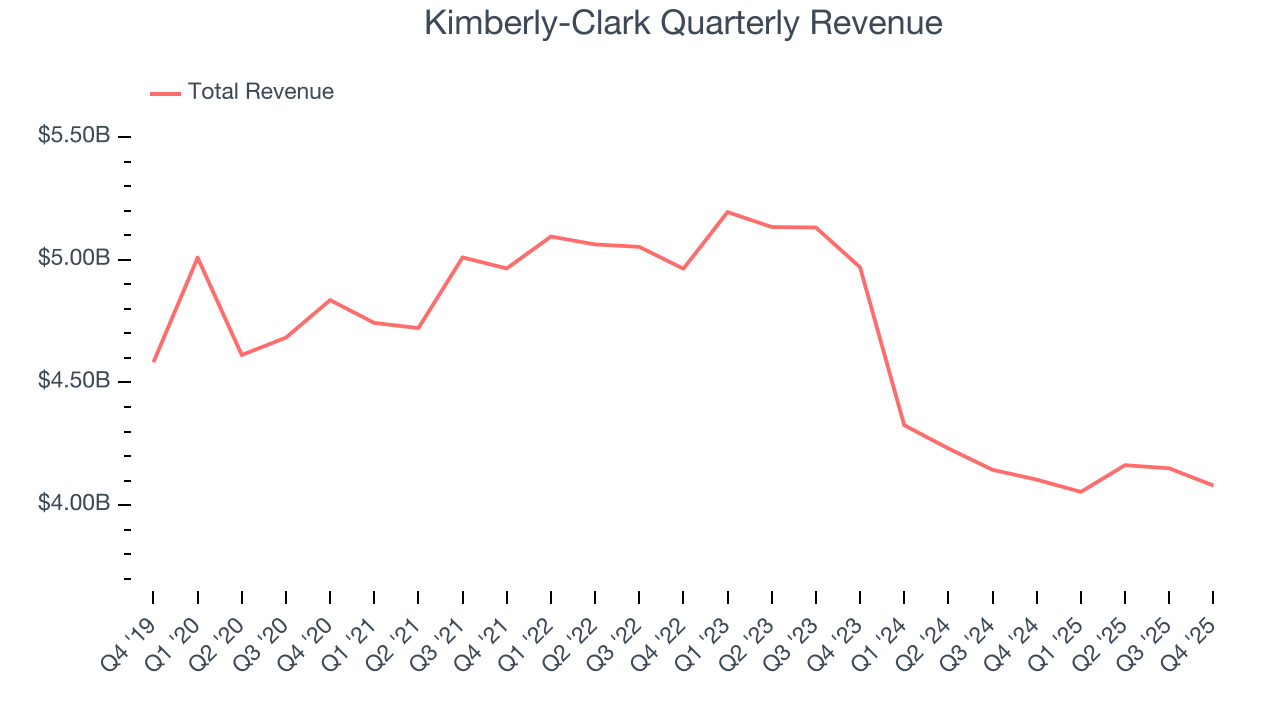
This quarter, Kimberly-Clark’s $4.08 billion of revenue was flat year on year and in line with Wall Street’s estimates.
Looking ahead, sell-side analysts expect revenue to grow 2.7% over the next 12 months. While this projection indicates its newer products will fuel better top-line performance, it is still below the sector average.
6. Organic Revenue Growth
When analyzing revenue growth, we care most about organic revenue growth. This metric captures a business’s performance excluding one-time events such as mergers, acquisitions, and divestitures as well as foreign currency fluctuations.
The demand for Kimberly-Clark’s products has generally risen over the last two years but lagged behind the broader sector. On average, the company’s organic sales have grown by 2.5% year on year. 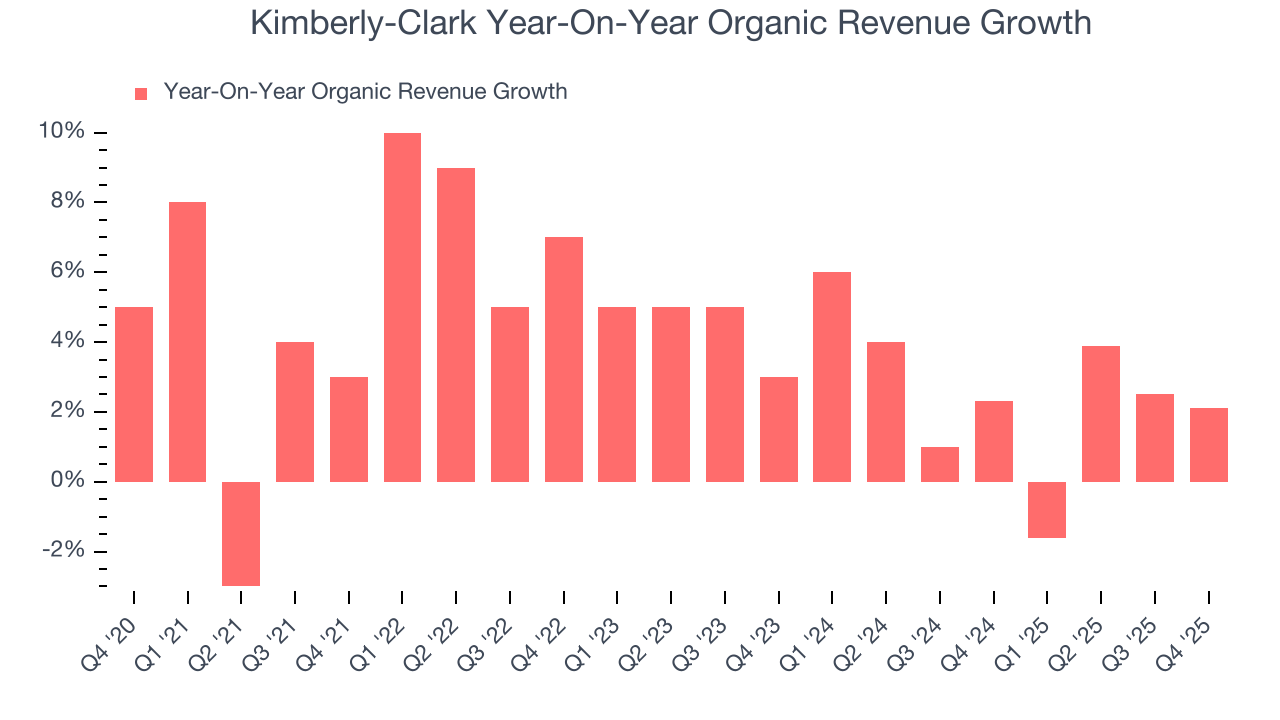
In the latest quarter, Kimberly-Clark’s organic sales rose by 2.1% year on year. This performance was more or less in line with its historical levels.
7. Gross Margin & Pricing Power
At StockStory, we prefer high gross margin businesses because they indicate pricing power or differentiated products, giving the company a chance to generate higher operating profits.
Kimberly-Clark’s unit economics are higher than the typical consumer staples company, giving it the flexibility to invest in areas such as marketing and talent to reach more consumers. As you can see below, it averaged a decent 35.9% gross margin over the last two years. That means for every $100 in revenue, $64.12 went towards paying for raw materials, production of goods, transportation, and distribution. 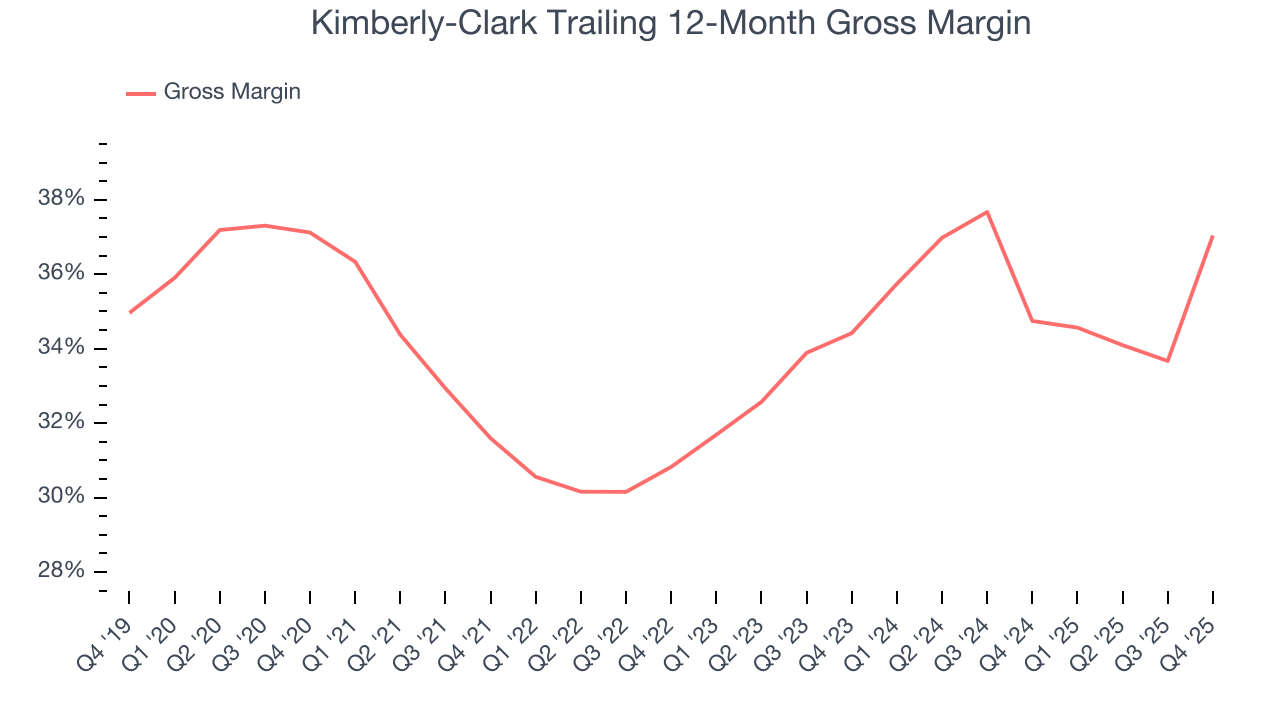
Kimberly-Clark produced a 35.9% gross profit margin in Q4, up 13.5 percentage points year on year. Kimberly-Clark’s full-year margin has also been trending up over the past 12 months, increasing by 2.3 percentage points. If this move continues, it could suggest better unit economics due to some combination of stable to improving pricing power and input costs (such as raw materials).
8. Operating Margin
Operating margin is a key measure of profitability. Think of it as net income - the bottom line - excluding the impact of taxes and interest on debt, which are less connected to business fundamentals.
Kimberly-Clark has been an efficient company over the last two years. It was one of the more profitable businesses in the consumer staples sector, boasting an average operating margin of 15.2%.
Analyzing the trend in its profitability, Kimberly-Clark’s operating margin decreased by 1.8 percentage points over the last year. Even though its historical margin was healthy, shareholders will want to see Kimberly-Clark become more profitable in the future.
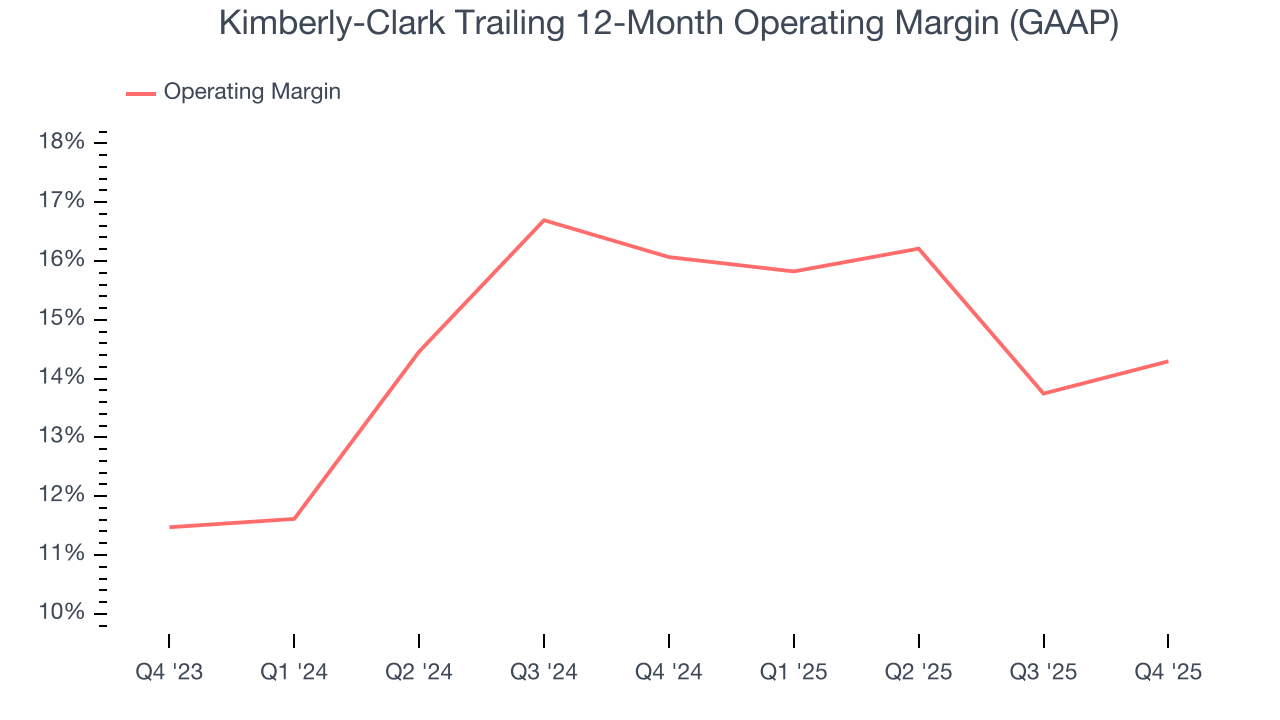
In Q4, Kimberly-Clark generated an operating margin profit margin of 12.4%, up 2.2 percentage points year on year. Since its gross margin expanded more than its operating margin, we can infer that leverage on its cost of sales was the primary driver behind the recently higher efficiency.
9. Earnings Per Share
We track the long-term change in earnings per share (EPS) for the same reason as long-term revenue growth. Compared to revenue, however, EPS highlights whether a company’s growth is profitable.
Kimberly-Clark’s EPS grew at a solid 10.2% compounded annual growth rate over the last three years, higher than its 6.6% annualized revenue declines. However, this alone doesn’t tell us much about its business quality because its operating margin didn’t improve.
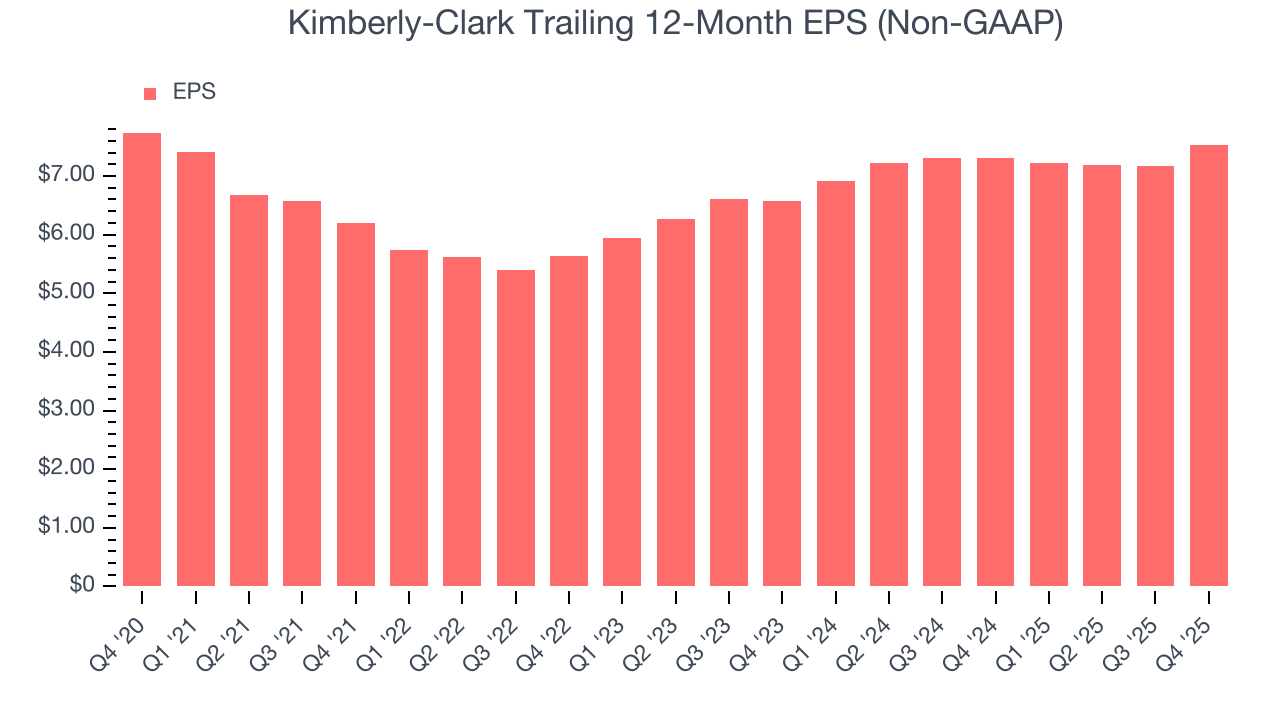
In Q4, Kimberly-Clark reported adjusted EPS of $1.86, up from $1.50 in the same quarter last year. This print beat analysts’ estimates by 2.7%. Over the next 12 months, Wall Street expects Kimberly-Clark’s full-year EPS of $7.53 to grow 1.8%.
10. Cash Is King
If you’ve followed StockStory for a while, you know we emphasize free cash flow. Why, you ask? We believe that in the end, cash is king, and you can’t use accounting profits to pay the bills.
Kimberly-Clark has shown robust cash profitability, giving it an edge over its competitors and the ability to reinvest or return capital to investors. The company’s free cash flow margin averaged 12.5% over the last two years, quite impressive for a consumer staples business.
Taking a step back, we can see that Kimberly-Clark’s margin dropped by 5 percentage points over the last year. If its declines continue, it could signal increasing investment needs and capital intensity.
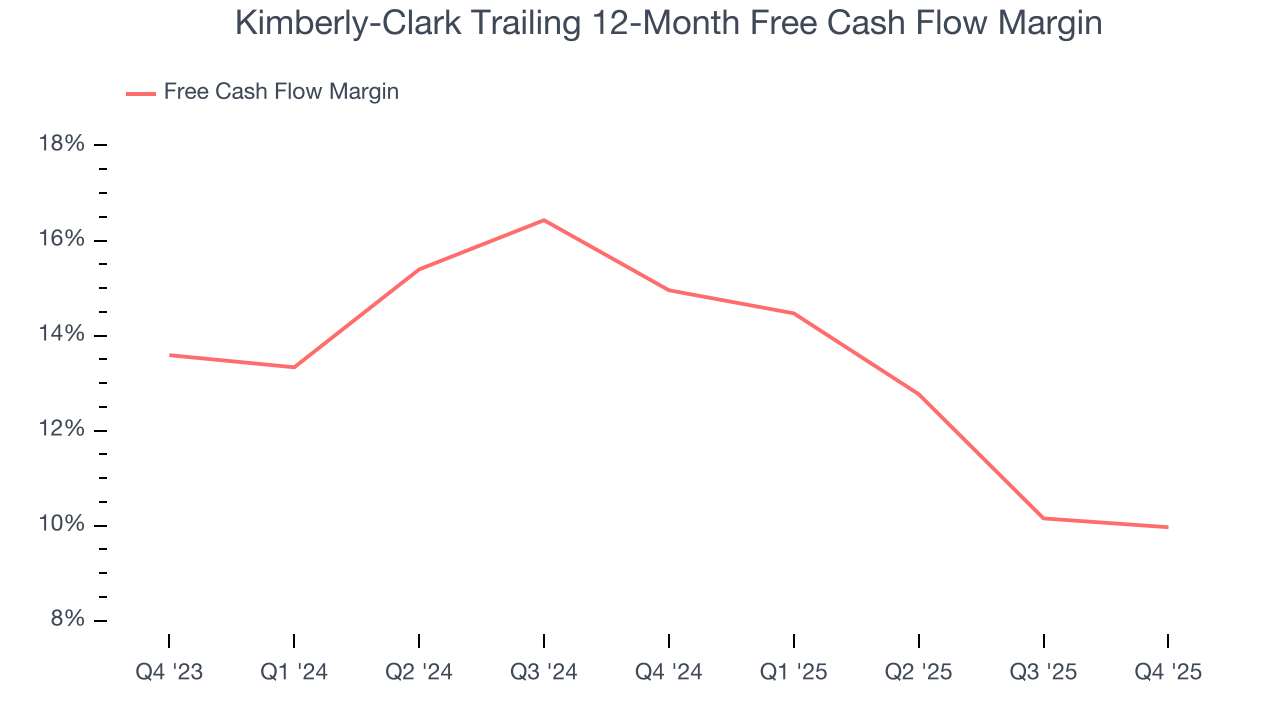
Kimberly-Clark’s free cash flow clocked in at $575 million in Q4, equivalent to a 14.1% margin. This cash profitability was in line with the comparable period last year and above its two-year average.
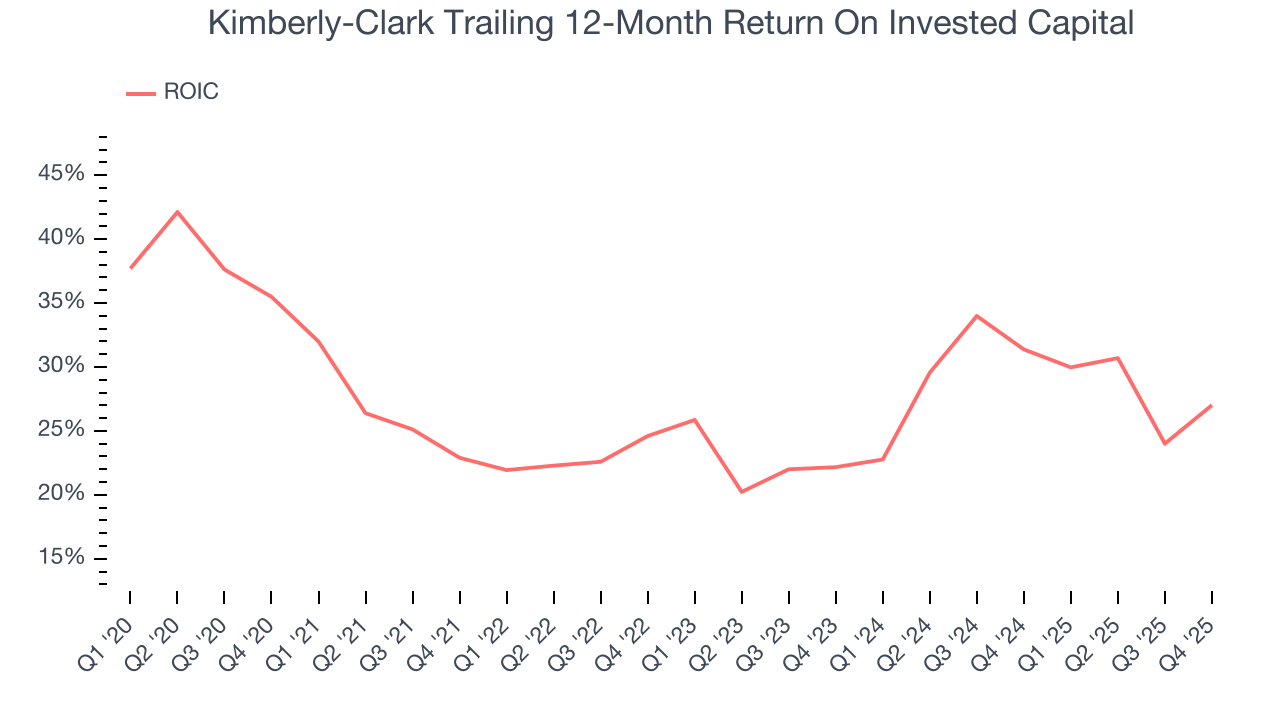
11. Return on Invested Capital (ROIC)
EPS and free cash flow tell us whether a company was profitable while growing its revenue. But was it capital-efficient? Enter ROIC, a metric showing how much operating profit a company generates relative to the money it has raised (debt and equity).
Although Kimberly-Clark hasn’t been the highest-quality company lately because of its poor top-line performance, it historically found a few growth initiatives that worked out well. Its five-year average ROIC was 25.6%, impressive for a consumer staples business.
12. Balance Sheet Assessment
Kimberly-Clark reported $688 million of cash and $7.17 billion of debt on its balance sheet in the most recent quarter. As investors in high-quality companies, we primarily focus on two things: 1) that a company’s debt level isn’t too high and 2) that its interest payments are not excessively burdening the business.
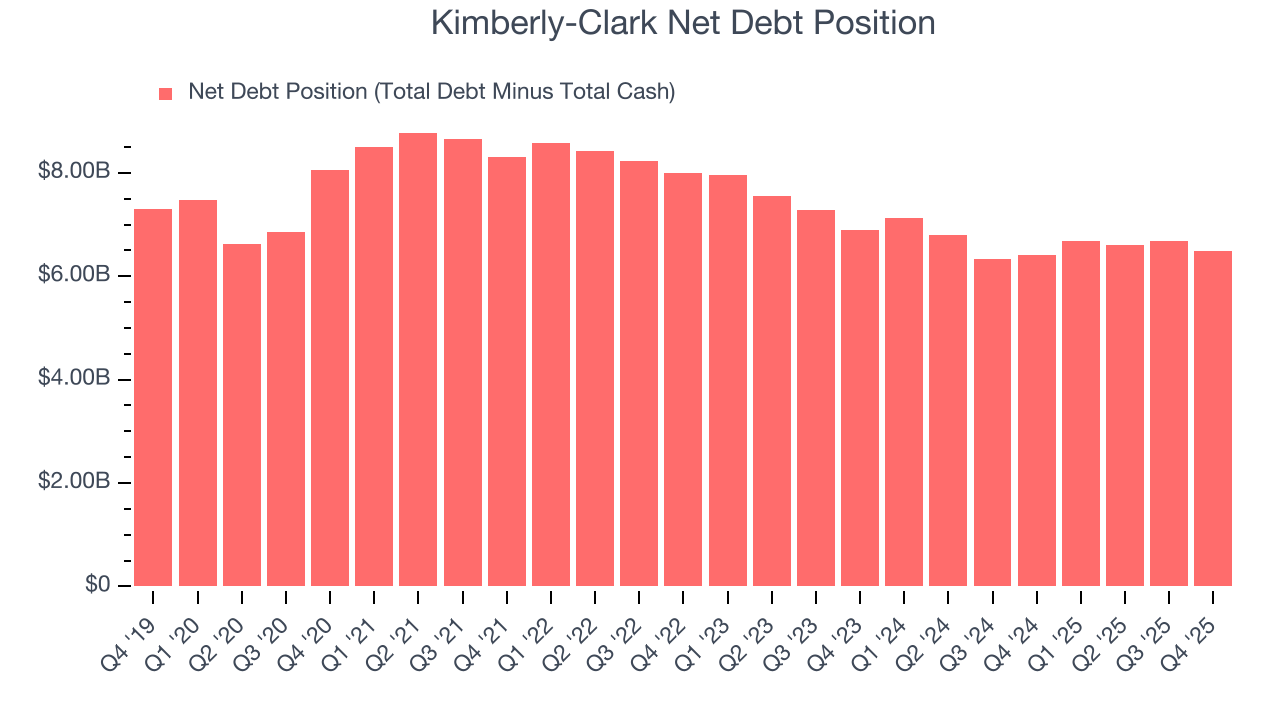
With $3.55 billion of EBITDA over the last 12 months, we view Kimberly-Clark’s 1.8× net-debt-to-EBITDA ratio as safe. We also see its $124 million of annual interest expenses as appropriate. The company’s profits give it plenty of breathing room, allowing it to continue investing in growth initiatives.
13. Key Takeaways from Kimberly-Clark’s Q4 Results
Organic revenue growth and total revenue were both in line, but EPS managed to beat. Overall, this quarter wasn't perfect, but it was solid. The stock traded up 1.1% to $102.07 immediately following the results.
14. Is Now The Time To Buy Kimberly-Clark?
Updated: March 15, 2026 at 10:53 PM EDT
Are you wondering whether to buy Kimberly-Clark or pass? We urge investors to not only consider the latest earnings results but also longer-term business quality and valuation as well.
Kimberly-Clark isn’t a terrible business, but it doesn’t pass our quality test. First off, its revenue has declined over the last three years. While its favorable brand awareness gives it meaningful influence over consumers’ dining decisions, the downside is its cash profitability fell over the last year. On top of that, its projected EPS for the next year is lacking.
Kimberly-Clark’s P/E ratio based on the next 12 months is 12.9x. While this valuation is fair, the upside isn’t great compared to the potential downside. We're pretty confident there are more exciting stocks to buy at the moment.
Wall Street analysts have a consensus one-year price target of $117.86 on the company (compared to the current share price of $98.72).
Although the price target is bullish, readers should exercise caution because analysts tend to be overly optimistic. The firms they work for, often big banks, have relationships with companies that extend into fundraising, M&A advisory, and other rewarding business lines. As a result, they typically hesitate to say bad things for fear they will lose out. We at StockStory do not suffer from such conflicts of interest, so we’ll always tell it like it is.