
Applied Materials (AMAT)
We see potential in Applied Materials. It generates heaps of cash that are reinvested into the business, creating a virtuous cycle of returns.― StockStory Analyst Team
1. News


2. Summary
Why Applied Materials Is Interesting
Founded in 1967 as the first company to develop tools for other businesses in the semiconductor industry, Applied Materials (NASDAQ:AMAT) is the largest provider of semiconductor wafer fabrication equipment.
- Stellar returns on capital showcase management’s ability to surface highly profitable business ventures
- Successful business model is illustrated by its impressive operating margin
- The stock is trading at a reasonable price if you like its story and growth prospects


Applied Materials shows some potential. If you’re a believer, the valuation looks fair.
Why Is Now The Time To Buy Applied Materials?


Applied Materials is trading at $358.81 per share, or 29x forward P/E. Applied Materials’s current valuation is below that of most semiconductor companies, but this doesn’t make it a bargain. Instead, the price is warranted for the quality you get.
If you think the market is not giving the company enough credit for its fundamentals, now could be a good time to invest.
3. Applied Materials (AMAT) Research Report: Q4 CY2025 Update
Semiconductor machinery manufacturer Applied Materials (NASDAQ:AMAT) announced better-than-expected revenue in Q4 CY2025, but sales fell by 2.1% year on year to $7.01 billion. On top of that, next quarter’s revenue guidance ($7.65 billion at the midpoint) was surprisingly good and 8.1% above what analysts were expecting. Its non-GAAP profit of $2.38 per share was 7.8% above analysts’ consensus estimates.
Applied Materials (AMAT) Q4 CY2025 Highlights:
- Revenue: $7.01 billion vs analyst estimates of $6.89 billion (2.1% year-on-year decline, 1.8% beat)
- Adjusted EPS: $2.38 vs analyst estimates of $2.21 (7.8% beat)
- Adjusted Operating Income: $2.11 billion vs analyst estimates of $2.00 billion (30% margin, 5.5% beat)
- Revenue Guidance for Q1 CY2026 is $7.65 billion at the midpoint, above analyst estimates of $7.08 billion
- Adjusted EPS guidance for Q1 CY2026 is $2.64 at the midpoint, above analyst estimates of $2.28
- Operating Margin: 26.1%, down from 30.4% in the same quarter last year
- Free Cash Flow Margin: 14.8%, up from 7.6% in the same quarter last year
- Inventory Days Outstanding: 153, in line with the previous quarter
- Market Capitalization: $269.8 billion
Company Overview
Founded in 1967 as the first company to develop tools for other businesses in the semiconductor industry, Applied Materials (NASDAQ:AMAT) is the largest provider of semiconductor wafer fabrication equipment.
Applied Materials is one of the only semiconductor manufacturing (capital) equipment maker who provides tools used in each of the processes used to create semiconductors. Roughly half its systems’ revenues come from deposition technologies, with another 30% from cleaning or removal systems.
Applied Materials counts among its customers the biggest chip makers in the world: TSMC, Intel, Samsung, and Micron, although it tilts more towards foundry and logic chip makers than memory producers.
Its primary peers and competitors are ASML (NASDAQ:ASML), Lam Research (NASDAQ:LCRX), KLA Corp (NASDAQ: KLAC), and Tokyo Electron (TSE:8035).
4. Semiconductor Manufacturing
The semiconductor capital (manufacturing) equipment group has become highly concentrated over the past decade. Suppliers have consolidated, and the increasing cost of innovation have made it unaffordable to almost everybody, except the largest companies, to produce leading edge chips. The result of the increased industry concentration has been higher operating margins and free cash generation through the cycle. Despite this structural improvement, the businesses can still be quite volatile, as demand fluctuations for the semiconductor equipment are magnified by the already cyclical nature of underlying semiconductor demand.
5. Revenue Growth
A company’s long-term sales performance is one signal of its overall quality. Any business can put up a good quarter or two, but the best consistently grow over the long haul. Thankfully, Applied Materials’s 9.2% annualized revenue growth over the last five years was decent. Its growth was slightly above the average semiconductor company and shows its offerings resonate with customers. Semiconductors are a cyclical industry, and long-term investors should be prepared for periods of high growth followed by periods of revenue contractions.
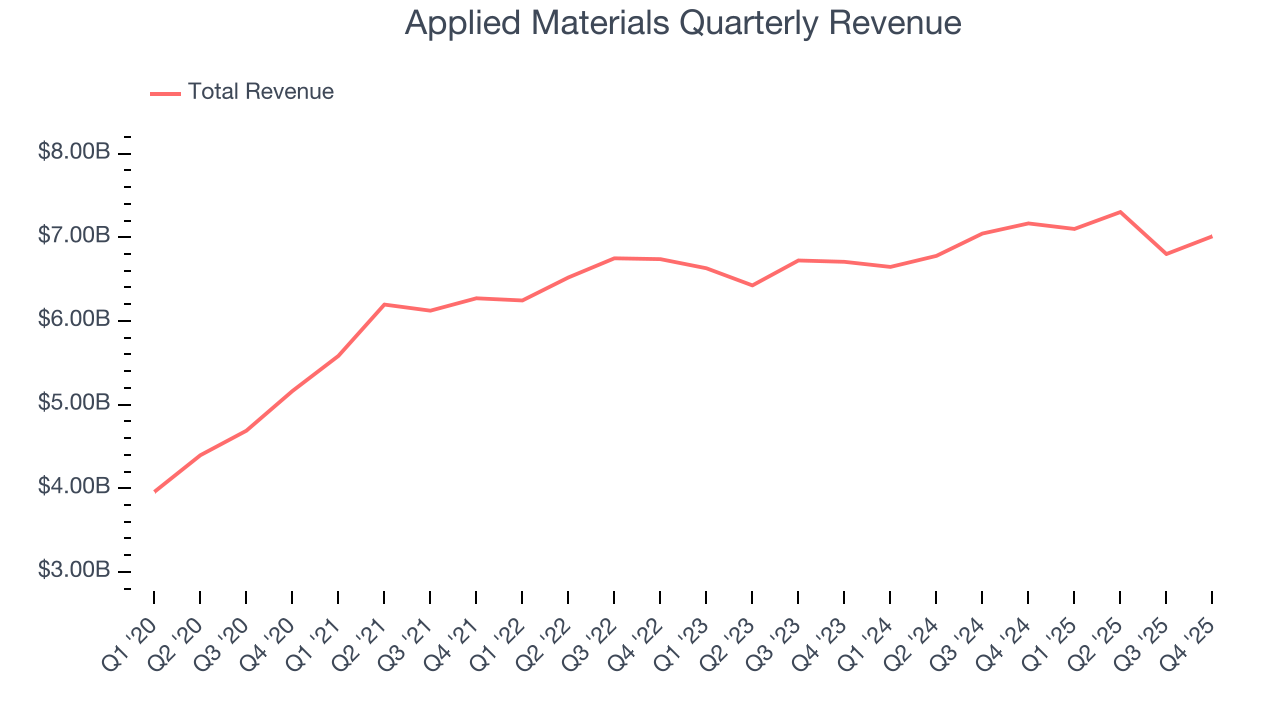
We at StockStory place the most emphasis on long-term growth, but within semiconductors, a half-decade historical view may miss new demand cycles or industry trends like AI. Applied Materials’s recent performance shows its demand has slowed as its annualized revenue growth of 3.2% over the last two years was below its five-year trend. We’re wary when companies in the sector see decelerations in revenue growth, as it could signal changing consumer tastes aided by low switching costs. 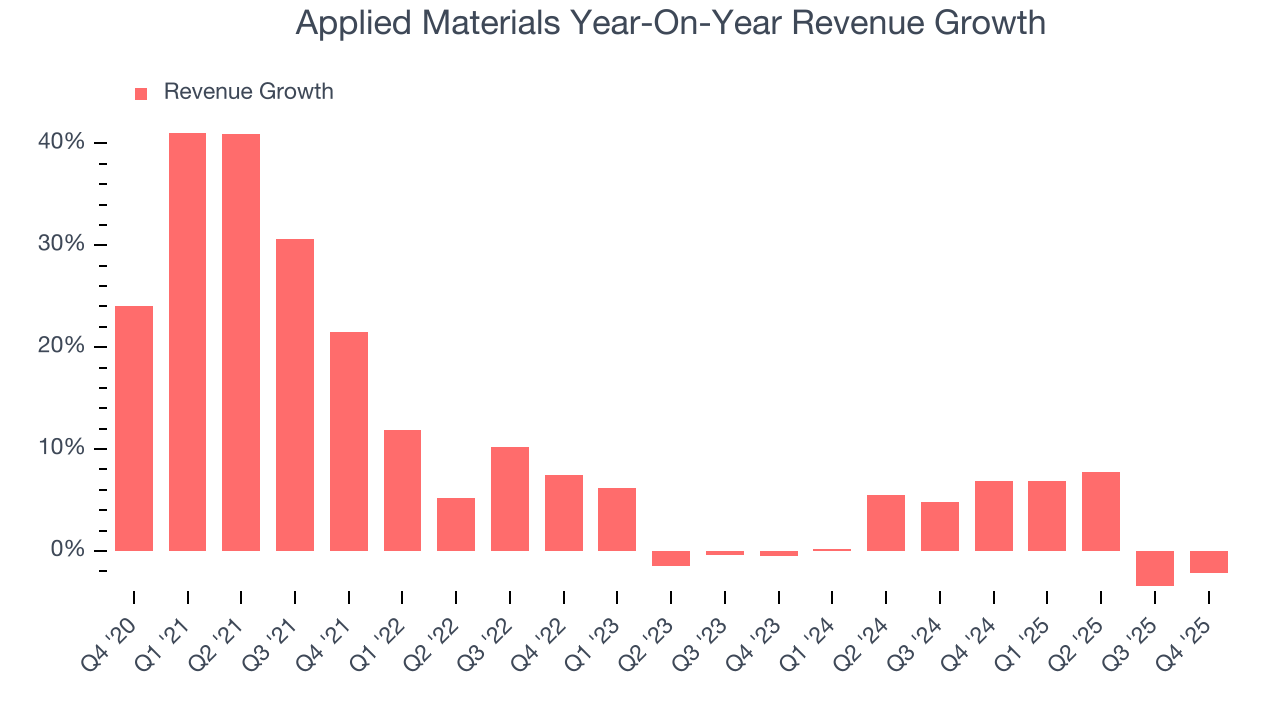
This quarter, Applied Materials’s revenue fell by 2.1% year on year to $7.01 billion but beat Wall Street’s estimates by 1.8%. Despite the beat, the drop in sales could mean that the current downcycle is deepening. Company management is currently guiding for a 7.7% year-on-year increase in sales next quarter.
Looking further ahead, sell-side analysts expect revenue to grow 9.5% over the next 12 months. Although this projection implies its newer products and services will fuel better top-line performance, it is still below the sector average.
6. Product Demand & Outstanding Inventory
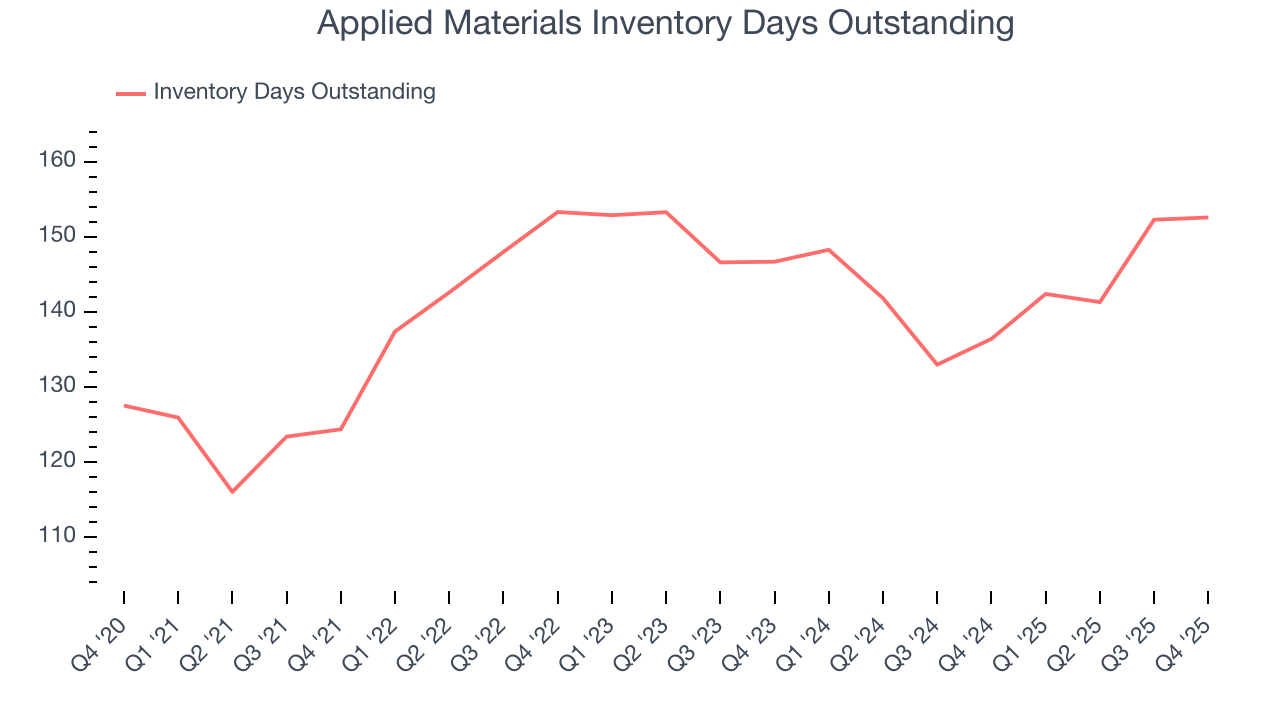
Days Inventory Outstanding (DIO) is an important metric for chipmakers, as it reflects a business’ capital intensity and the cyclical nature of semiconductor supply and demand. In a tight supply environment, inventories tend to be stable, allowing chipmakers to exert pricing power. Steadily increasing DIO can be a warning sign that demand is weak, and if inventories continue to rise, the company may have to downsize production.
This quarter, Applied Materials’s DIO came in at 153, which is 12 days above its five-year average, suggesting that the company’s inventory has grown to higher levels than we’ve seen in the past.
7. Gross Margin & Pricing Power
Gross profit margin is a key metric to track because it shows how much money a semiconductor company gets to keep after paying for its raw materials, manufacturing, and other input costs.
Applied Materials’s gross margin is slightly below the average semiconductor company, indicating its products aren’t as mission-critical as its competitors. As you can see below, it averaged a 48.2% gross margin over the last two years. Said differently, Applied Materials had to pay a chunky $51.77 to its suppliers for every $100 in revenue. 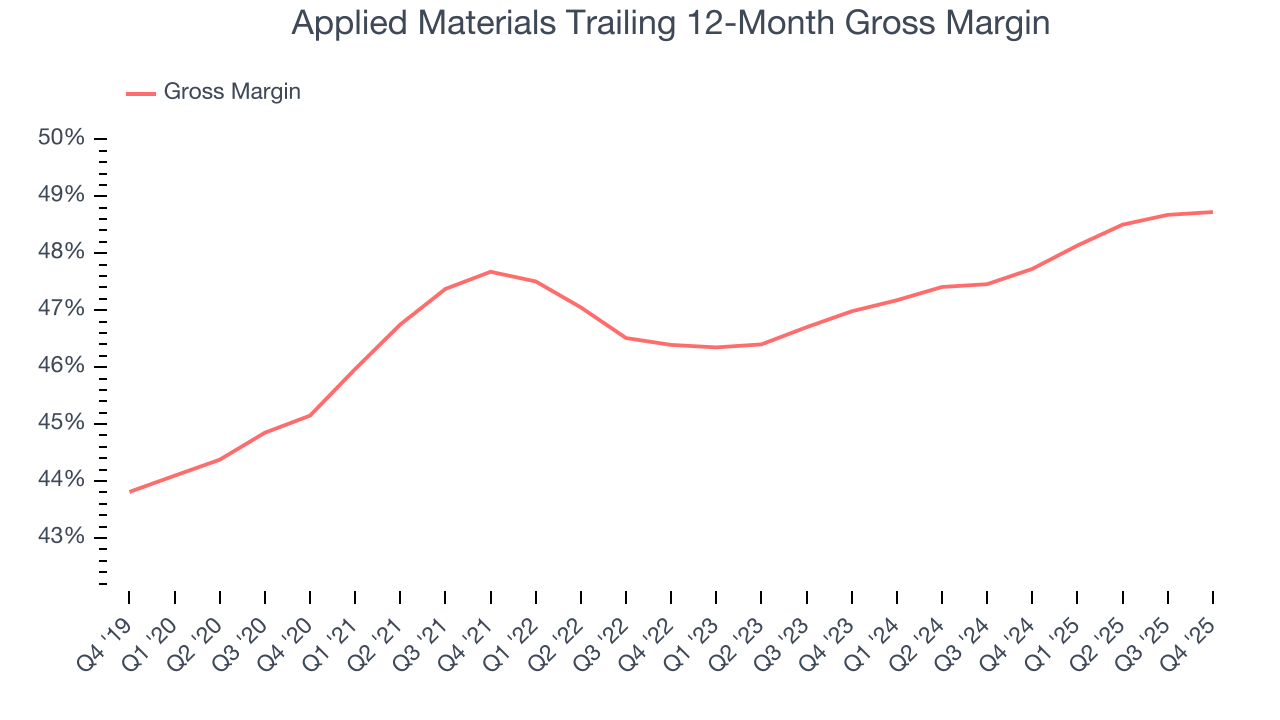
Applied Materials produced a 49% gross profit margin in Q4, in line with the same quarter last year. On a wider time horizon, the company’s full-year margin has remained steady over the past four quarters, suggesting its input costs (such as raw materials and manufacturing expenses) have been stable and it isn’t under pressure to lower prices.
8. Operating Margin
Operating margin is a key measure of profitability. Think of it as net income - the bottom line - excluding the impact of taxes and interest on debt, which are less connected to business fundamentals.
Applied Materials has been an efficient company over the last two years. It was one of the more profitable businesses in the semiconductor sector, boasting an average operating margin of 28.7%.
Looking at the trend in its profitability, Applied Materials’s operating margin decreased by 3.2 percentage points over the last five years. This raises questions about the company’s expense base because its revenue growth should have given it leverage on its fixed costs, resulting in better economies of scale and profitability.
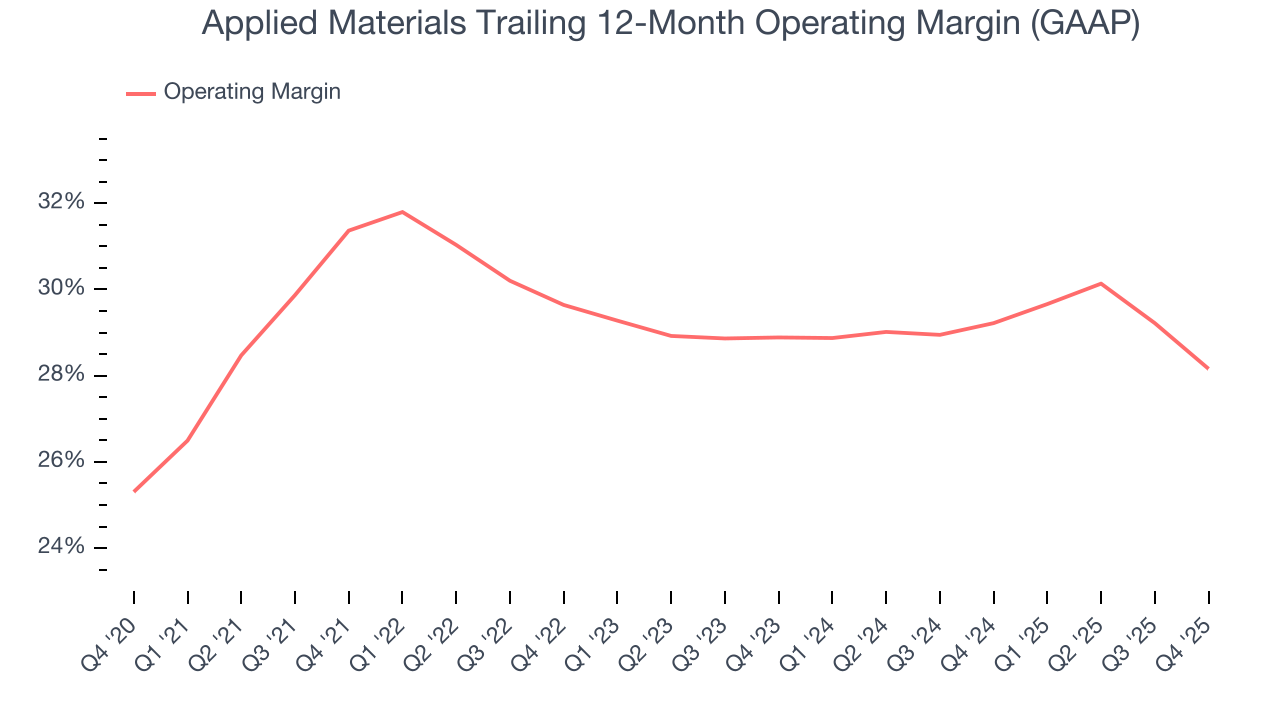
In Q4, Applied Materials generated an operating margin profit margin of 26.1%, down 4.2 percentage points year on year. Since Applied Materials’s operating margin decreased more than its gross margin, we can assume it was less efficient because expenses such as marketing, R&D, and administrative overhead increased.
9. Earnings Per Share
We track the long-term change in earnings per share (EPS) for the same reason as long-term revenue growth. Compared to revenue, however, EPS highlights whether a company’s growth is profitable.
Applied Materials’s EPS grew at a decent 15.5% compounded annual growth rate over the last five years, higher than its 9.2% annualized revenue growth. This tells us the company became more profitable on a per-share basis as it expanded.
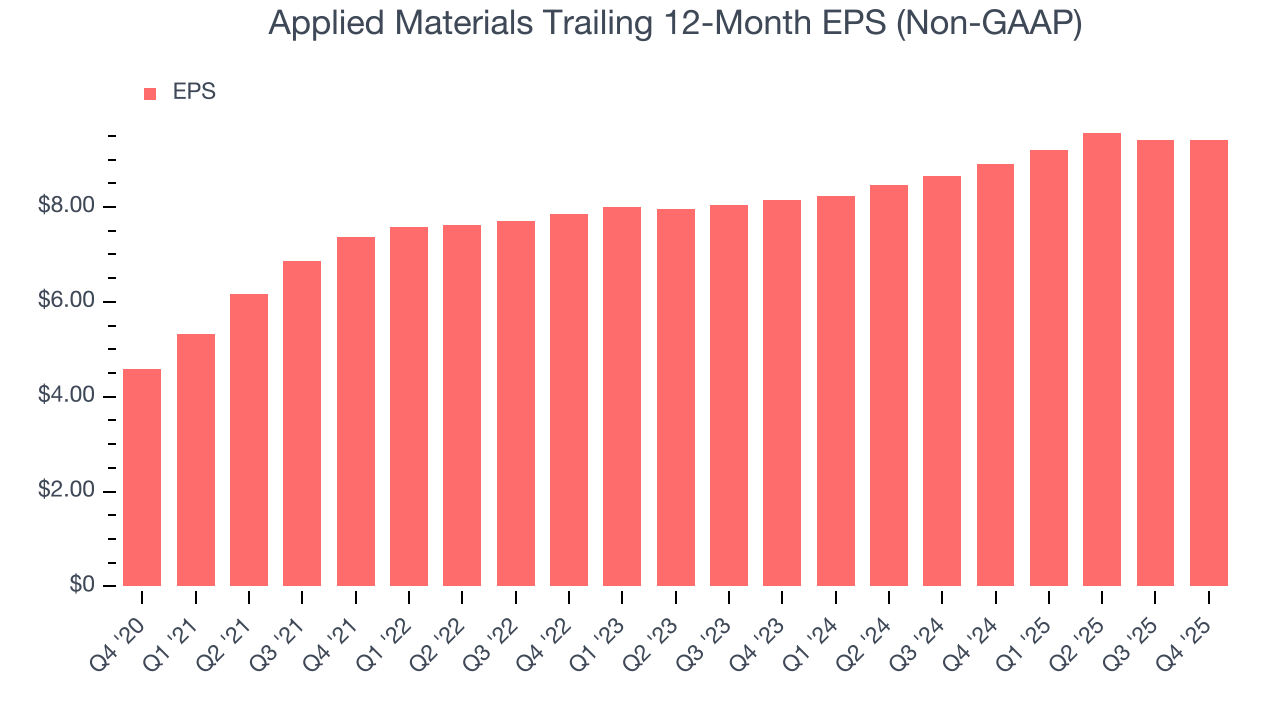
We can take a deeper look into Applied Materials’s earnings quality to better understand the drivers of its performance. A five-year view shows that Applied Materials has repurchased its stock, shrinking its share count by 13.6%. This tells us its EPS outperformed its revenue not because of increased operational efficiency but financial engineering, as buybacks boost per share earnings. 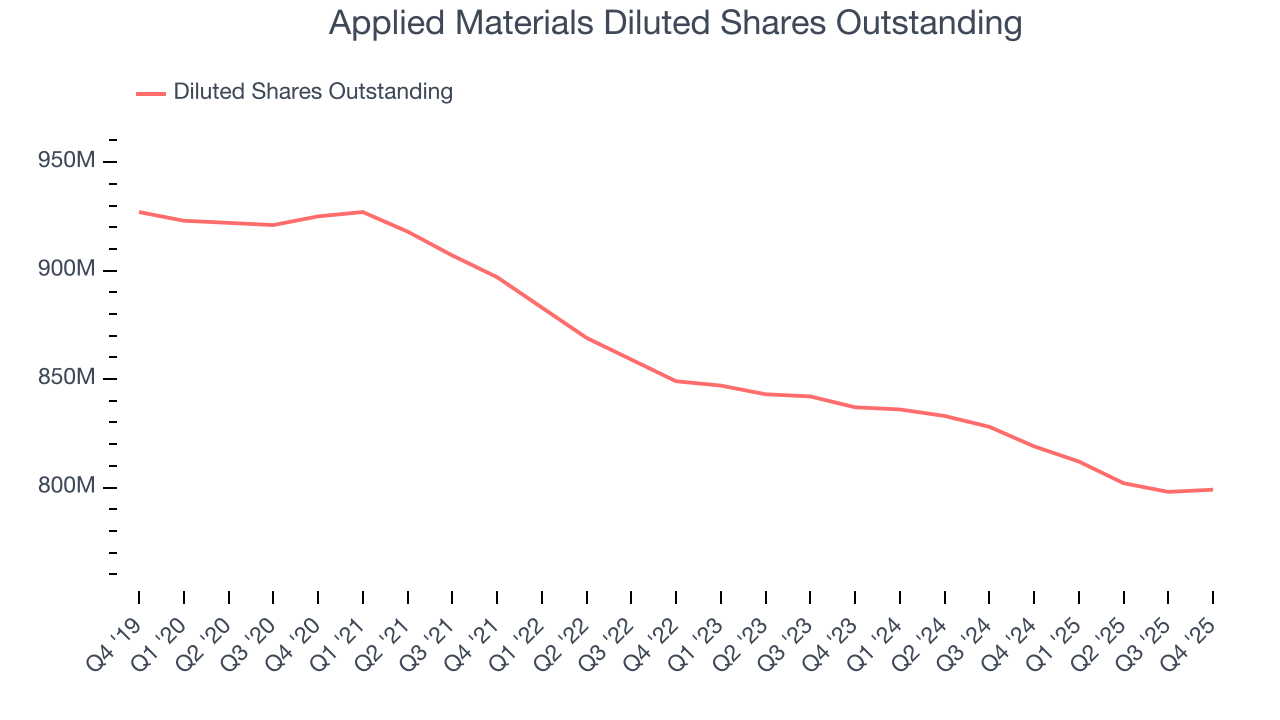
In Q4, Applied Materials reported adjusted EPS of $2.38, in line with the same quarter last year. This print beat analysts’ estimates by 7.8%. Over the next 12 months, Wall Street expects Applied Materials’s full-year EPS of $9.42 to grow 12.1%.
10. Cash Is King
If you’ve followed StockStory for a while, you know we emphasize free cash flow. Why, you ask? We believe that in the end, cash is king, and you can’t use accounting profits to pay the bills.
Applied Materials has shown impressive cash profitability, and if maintainable, will be in a position to ride out cyclical downturns more easily while continuing to invest in new and existing products. The company’s free cash flow margin averaged 21.7% over the last two years, better than the broader semiconductor sector.
Taking a step back, we can see that Applied Materials’s margin dropped by 2.8 percentage points over the last five years. Continued declines could signal it is in the middle of an investment cycle.
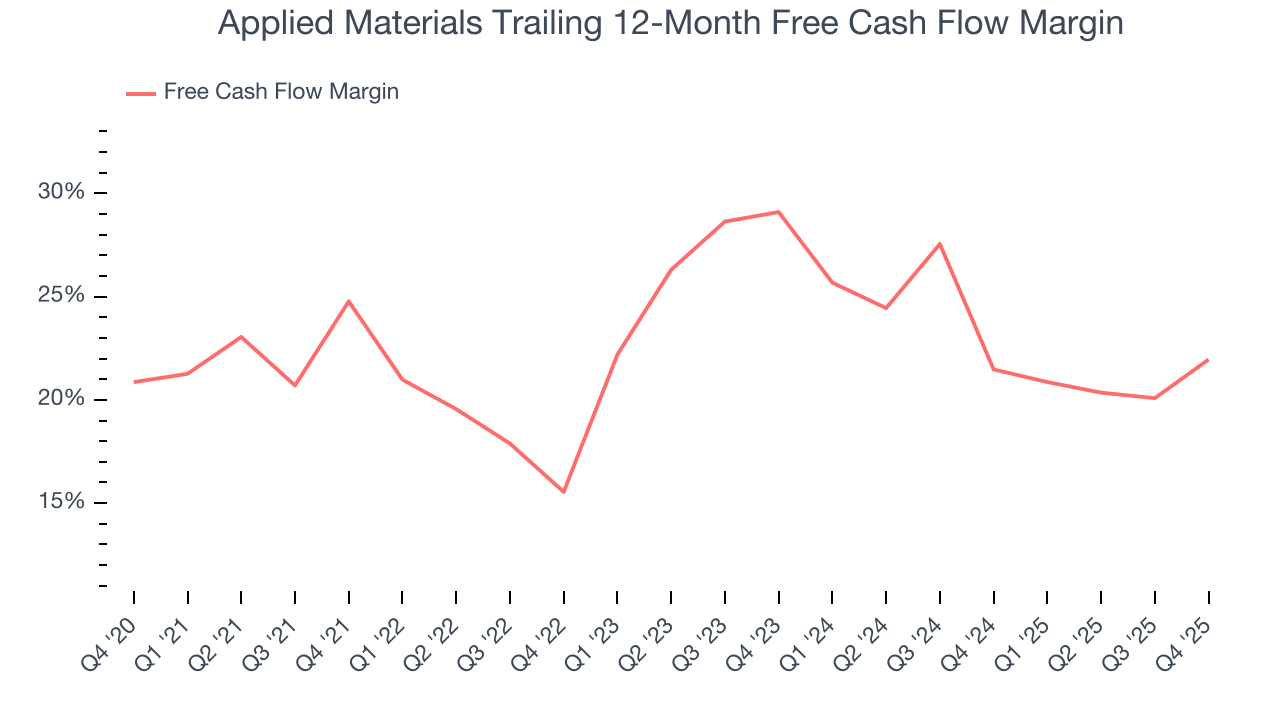
Applied Materials’s free cash flow clocked in at $1.04 billion in Q4, equivalent to a 14.8% margin. This result was good as its margin was 7.2 percentage points higher than in the same quarter last year, but we note it was lower than its two-year cash profitability. Nevertheless, we wouldn’t read too much into a single quarter because investment needs can be seasonal, leading to short-term swings. Long-term trends are more important.
11. Return on Invested Capital (ROIC)
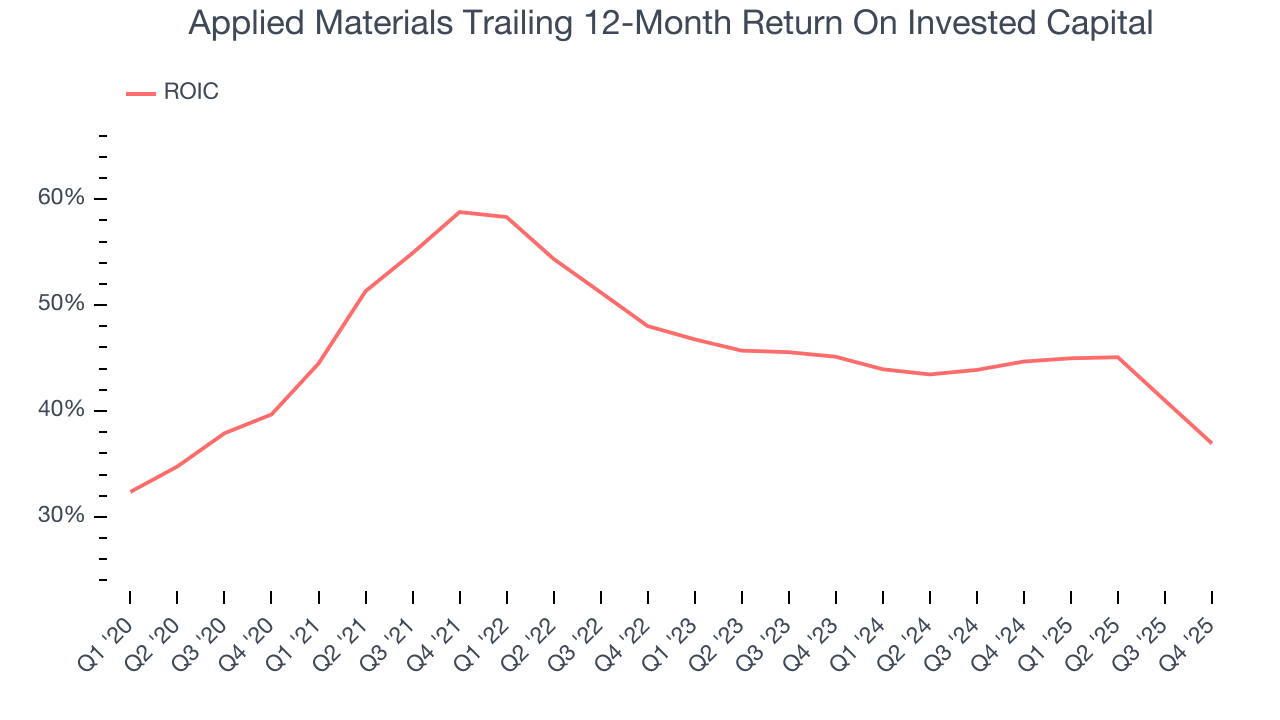
EPS and free cash flow tell us whether a company was profitable while growing its revenue. But was it capital-efficient? Enter ROIC, a metric showing how much operating profit a company generates relative to the money it has raised (debt and equity).
Although Applied Materials hasn’t been the highest-quality company lately, it found a few growth initiatives in the past that worked out wonderfully. Its five-year average ROIC was 46.7%, splendid for a semiconductor business.
12. Balance Sheet Assessment
Big corporations like Applied Materials are attractive to many investors in times of instability thanks to their fortress balance sheets that buffer pockets of soft demand.
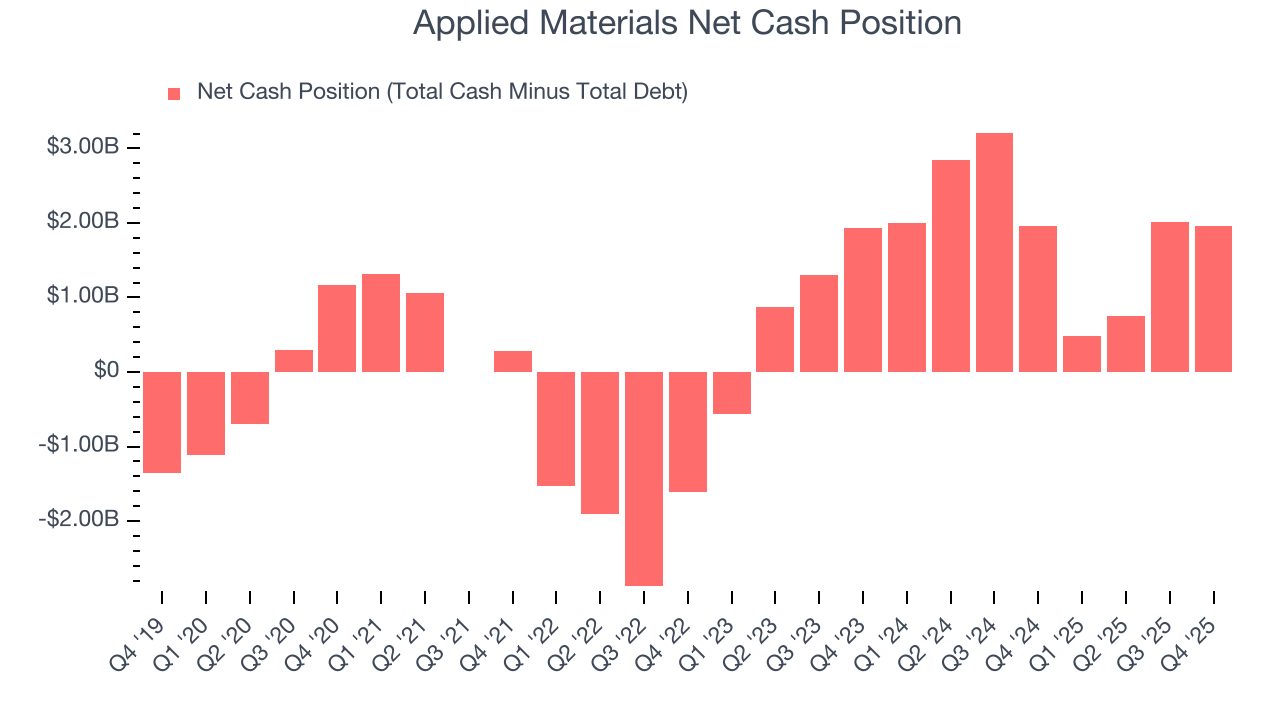
Applied Materials is a profitable, well-capitalized company with $8.51 billion of cash and $6.55 billion of debt on its balance sheet. This $1.96 billion net cash position gives it the freedom to borrow money, return capital to shareholders, or invest in growth initiatives. Leverage is not an issue here.
13. Key Takeaways from Applied Materials’s Q4 Results
We were impressed by Applied Materials’s optimistic revenue guidance for next quarter, which blew past analysts’ expectations. We were also glad its EPS outperformed Wall Street’s estimates. Zooming out, we think this was a solid print. The stock traded up 5.5% to $347 immediately following the results.
14. Is Now The Time To Buy Applied Materials?
Updated: March 19, 2026 at 10:22 PM EDT
A common mistake we notice when investors are deciding whether to buy a stock or not is that they simply look at the latest earnings results. Business quality and valuation matter more, so we urge you to understand these dynamics as well.
Applied Materials possesses a number of positive attributes. First off, its revenue growth was good over the last five years and is expected to accelerate over the next 12 months. On top of that, Applied Materials’s stellar ROIC suggests it has been a well-run company historically, and its strong operating margins show it’s a well-run business.
Applied Materials’s P/E ratio based on the next 12 months is 29x. When scanning the semiconductor space, Applied Materials trades at a fair valuation. If you’re a fan of the business and management team, now is a good time to scoop up some shares.
Wall Street analysts have a consensus one-year price target of $410.63 on the company (compared to the current share price of $358.81), implying they see 14.4% upside in buying Applied Materials in the short term.