
Broadcom (AVGO)
Broadcom is in a league of its own. Its combination of fast growth, robust profitability, and superb prospects makes it a coveted asset.― StockStory Analyst Team
1. News


2. Summary
Why We Like Broadcom
Originally the semiconductor division of Hewlett Packard, Broadcom (NASDAQ:AVGO) is a semiconductor conglomerate spanning wireless communications, networking, and data storage as well as infrastructure software focused on mainframes and cybersecurity.
- Market share has increased this cycle as its 22.6% annual revenue growth over the last five years was exceptional
- Exciting sales outlook for the upcoming 12 months calls for 75.4% growth, an acceleration from its two-year trend
- Offerings are difficult to replicate at scale and lead to a best-in-class gross margin of 76.5%


Broadcom is a top-tier company. The price seems fair in light of its quality, and we think now is a favorable time to buy.
Why Is Now The Time To Buy Broadcom?


Broadcom’s stock price of $313.22 implies a valuation ratio of 23.9x forward P/E. This multiple is lower than most semiconductor companies, and we think the stock is a deal when considering its quality characteristics.
Where you buy a stock impacts returns. Our analysis shows that business quality is a much bigger determinant of market outperformance over the long term compared to entry price, but getting a good deal on a stock certainly isn’t a bad thing.
3. Broadcom (AVGO) Research Report: Q4 CY2025 Update
Fabless chip and software maker Broadcom (NASDAQ:AVGO) announced better-than-expected revenue in Q4 CY2025, with sales up 29.5% year on year to $19.31 billion. On top of that, next quarter’s revenue guidance ($22 billion at the midpoint) was surprisingly good and 7.4% above what analysts were expecting. Its non-GAAP profit of $2.05 per share was 1.3% above analysts’ consensus estimates.
Broadcom (AVGO) Q4 CY2025 Highlights:
- Revenue: $19.31 billion vs analyst estimates of $19.21 billion (29.5% year-on-year growth, 0.5% beat)
- Adjusted EPS: $2.05 vs analyst estimates of $2.02 (1.3% beat)
- Adjusted EBITDA: $13.13 billion vs analyst estimates of $12.96 billion (68% margin, 1.3% beat)
- Revenue Guidance for Q1 CY2026 is $22 billion at the midpoint, above analyst estimates of $20.49 billion
- Operating Margin: 44.3%, up from 42% in the same quarter last year
- Free Cash Flow Margin: 41.5%, up from 40.3% in the same quarter last year
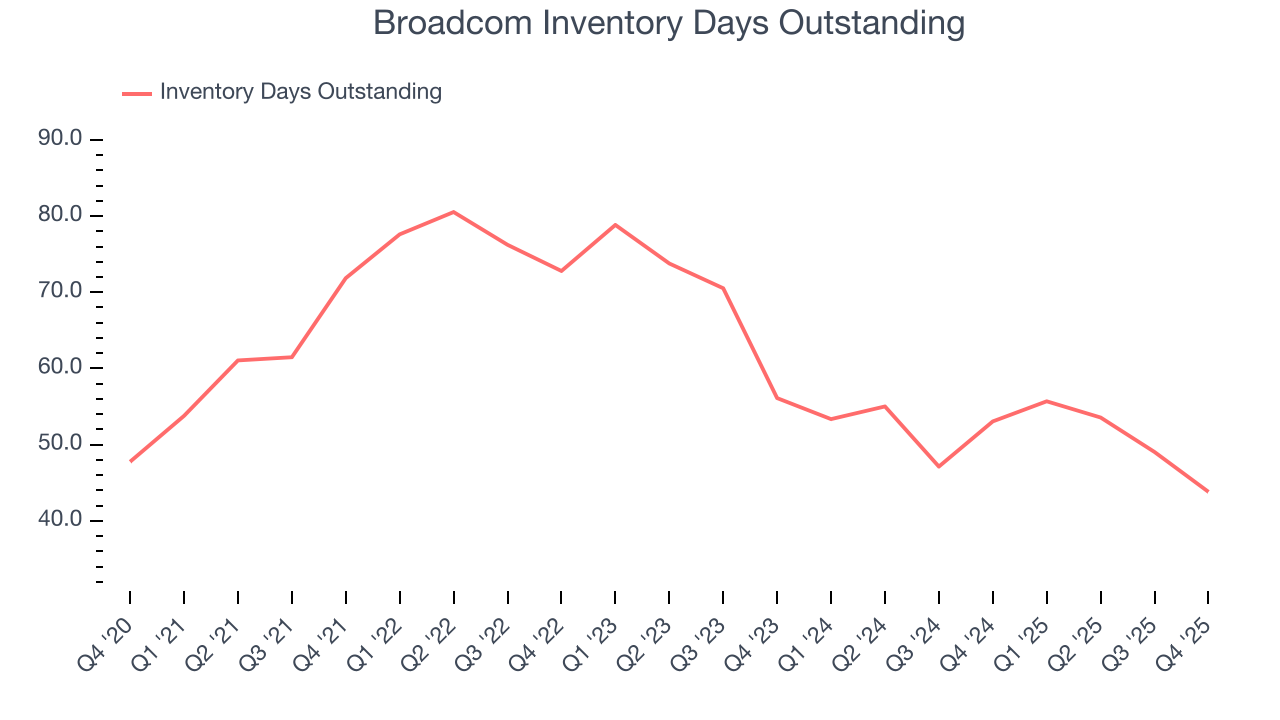
- Inventory Days Outstanding: 44, down from 49 in the previous quarter
- Market Capitalization: $1.49 trillion
Company Overview
Originally the semiconductor division of Hewlett Packard, Broadcom (NASDAQ:AVGO) is a semiconductor conglomerate spanning wireless communications, networking, and data storage as well as infrastructure software focused on mainframes and cybersecurity.
Today’s Broadcom traces its roots to the chip division of Agilent Technologies, which was acquired by private equity giants KKR and Silver Lake in 2005, renamed Avago and put under the guidance of CEO Hock Tan. Since 2005, its strategy has been to acquire leading infrastructure technology providers, and improve their margins and FCF by integrating their back office and sales functions into its platform and running the businesses with an emphasis on profitability over growth at any cost.
Over time, the acquired companies diversified Broadcom’s business model and the improved free cash flow provides the capital for further acquisitions. In the past decade Hock Tan’s Avago has spent over $70 billion acquiring CYOptics, LSI, Emulex, Broadcom (whose name it adopted), Brocade, CA, and Symantec’s enterprise security business.
Broadcom’s semiconductor business provides chips used in smartphones, data centers, set top boxes, servers, telecom, and networking systems. Its software business focuses on infrastructure and security, with key businesses in database, application development, endpoint security, and identity management.
Broadcom’s peers and competitors in semiconductors include Analog Devices (NASDAQ: ADI), Cisco Systems (NASDAQ: CSCO), Intel (NASDAQ:INTC), MediaTek (TWSE:2454), Marvell Technology (NASDAQ:MRVL), NXP Semiconductors NV (NASDAQ:NXPI), Qualcomm (NASDAQ:QCOM), Qorvo (NASDAQ: QRVO), and Skyworks (NASDAQ:SWKS). Its software rivals are Atlassian (NASDAQ:TEAM), CrowdStrike (NASDAQ:CRWD), IBM (NYSE:IBM), Oracle (NYSE:ORCL), ServiceNow (NASDAQ:NOW), Splunk (NASDAQ:SPLK), and VMware (NYSE: VMW).
4. Processors and Graphics Chips
Chips need to keep getting smaller in order to advance on Moore’s law, and that is proving increasingly more complicated and expensive to achieve with time. That has caused most digital chip makers to become “fabless” designers, rather than manufacturers, instead relying on contracted foundries like TSMC to manufacture their designs. This has benefitted the digital chip makers’ free cash flow margins, as exiting the manufacturing business has removed large cash expenses from their business models.
5. Revenue Growth
A company’s long-term performance is an indicator of its overall quality. Any business can have short-term success, but a top-tier one grows for years. Luckily, Broadcom’s sales grew at an incredible 22.6% compounded annual growth rate over the last five years. Its growth surpassed the average semiconductor company and shows its offerings resonate with customers, a great starting point for our analysis. Semiconductors are a cyclical industry, and long-term investors should be prepared for periods of high growth followed by periods of revenue contractions (which can sometimes offer opportune times to buy).
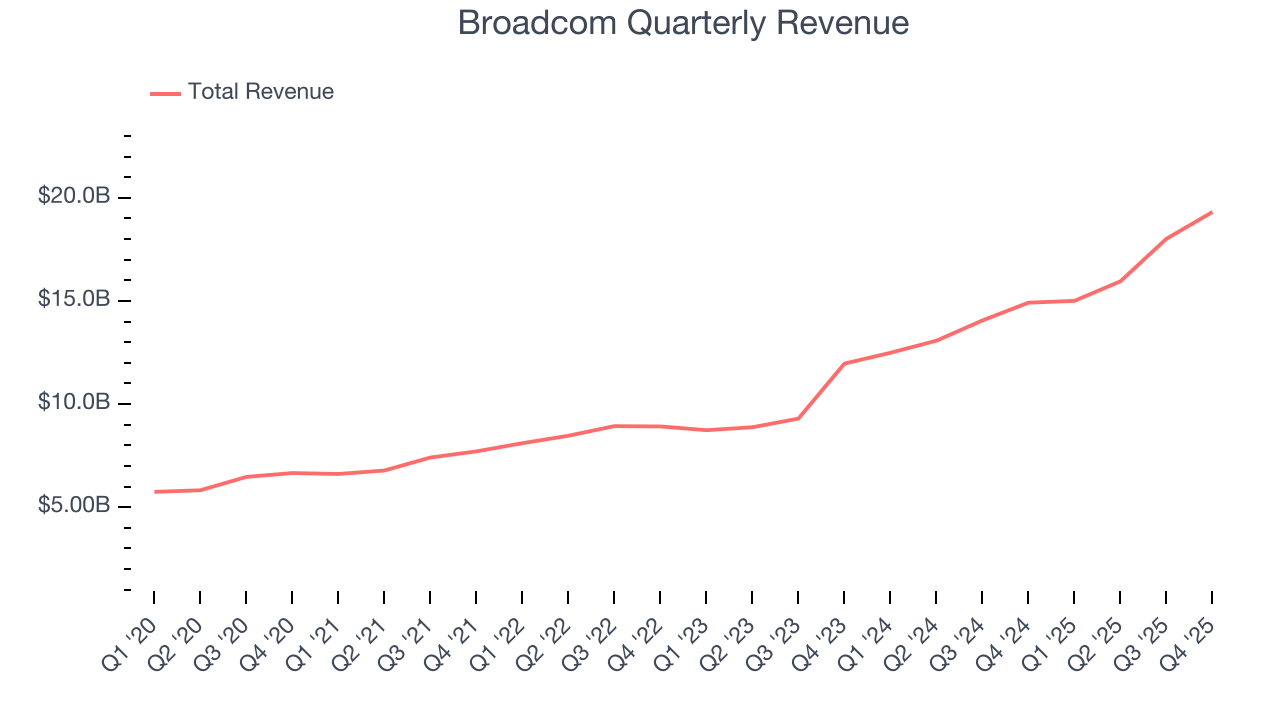
Long-term growth is the most important, but short-term results matter for semiconductors because the rapid pace of technological innovation (Moore's Law) could make yesterday's hit product obsolete today. Broadcom’s annualized revenue growth of 32.5% over the last two years is above its five-year trend, suggesting its demand was strong and recently accelerated. 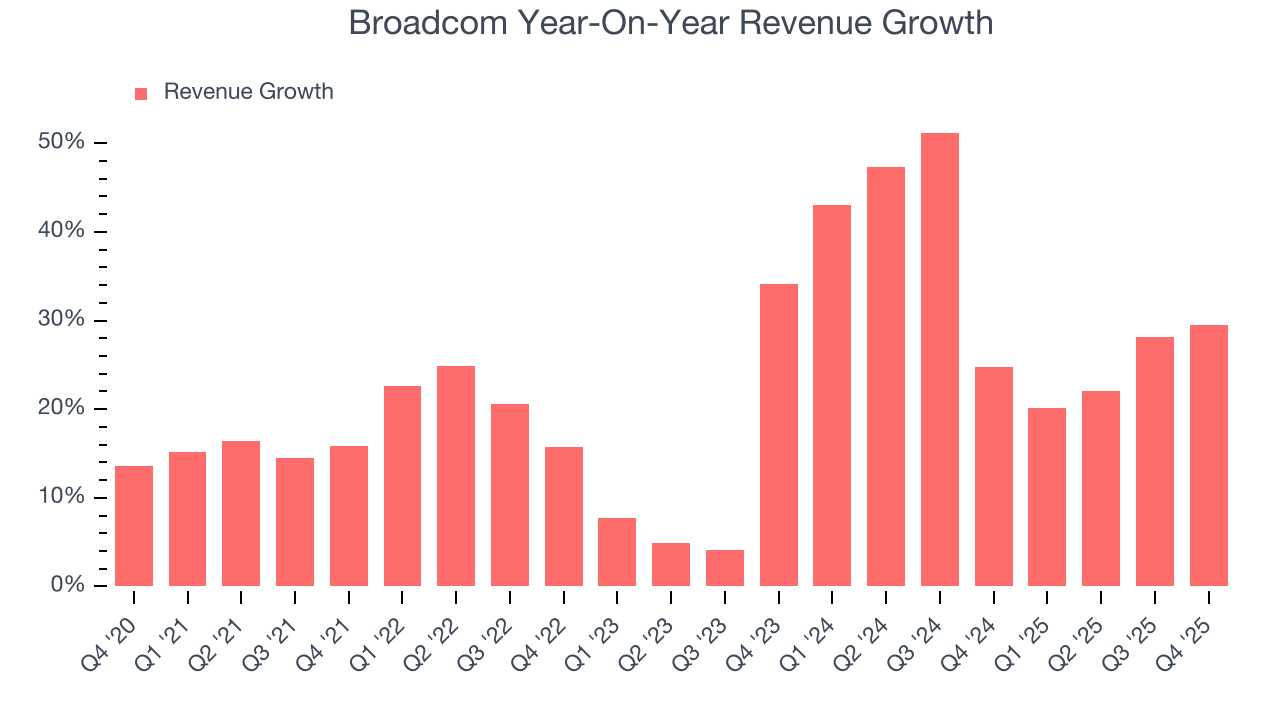
This quarter, Broadcom reported robust year-on-year revenue growth of 29.5%, and its $19.31 billion of revenue topped Wall Street estimates by 0.5%. Company management is currently guiding for a 46.6% year-on-year increase in sales next quarter.
Looking further ahead, sell-side analysts expect revenue to grow 62.5% over the next 12 months, an improvement versus the last two years. This projection is eye-popping for a company of its scale and suggests its newer products and services will fuel better top-line performance.
6. Product Demand & Outstanding Inventory
Days Inventory Outstanding (DIO) is an important metric for chipmakers, as it reflects a business’ capital intensity and the cyclical nature of semiconductor supply and demand. In a tight supply environment, inventories tend to be stable, allowing chipmakers to exert pricing power. Steadily increasing DIO can be a warning sign that demand is weak, and if inventories continue to rise, the company may have to downsize production.
This quarter, Broadcom’s DIO came in at 44, which is 18 days below its five-year average. At the moment, these numbers show no indication of an excessive inventory buildup.
7. Gross Margin & Pricing Power
In the semiconductor industry, a company’s gross profit margin is a critical metric to track because it sheds light on its pricing power, complexity of products, and ability to procure raw materials, equipment, and labor.
Broadcom’s gross margin is one of the best in the semiconductor sector, and its differentiated products give it strong pricing power. As you can see below, it averaged an elite 75.3% gross margin over the last two years. Said differently, roughly $75.32 was left to spend on selling, marketing, R&D, and general administrative overhead for every $100 in revenue. 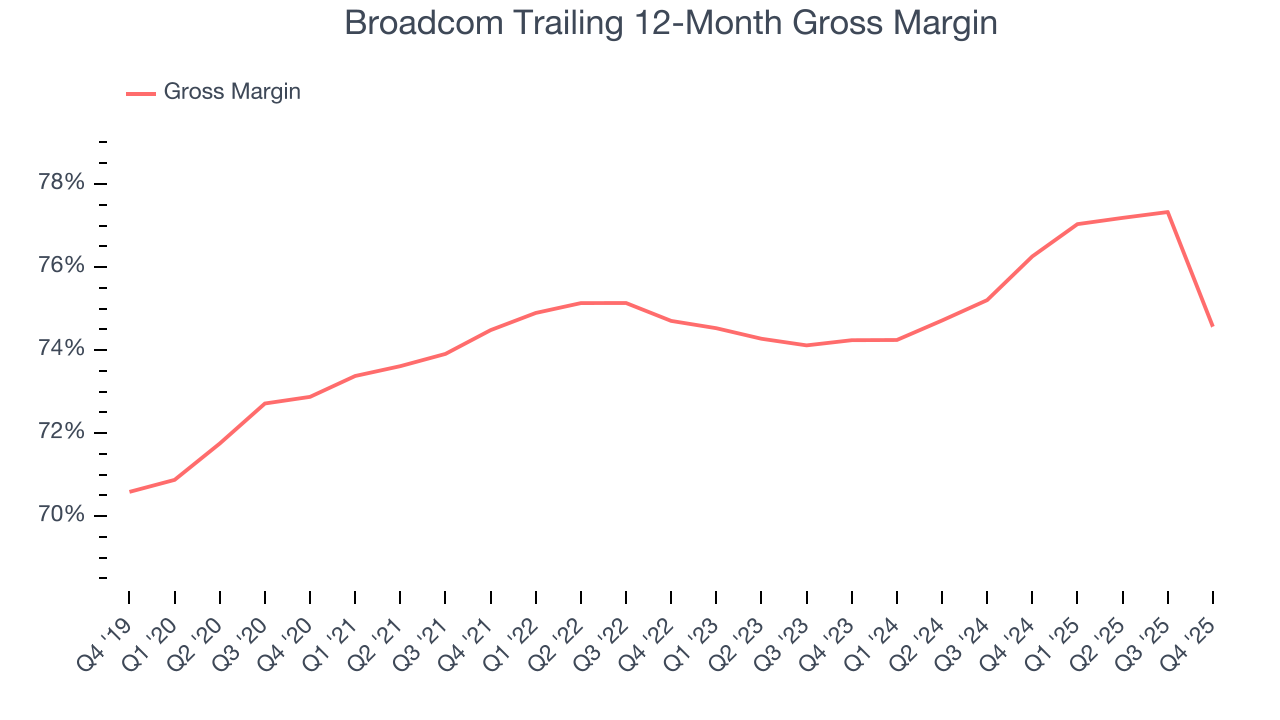
Broadcom produced a 68.1% gross profit margin in Q4, down 9.9 percentage points year on year. Broadcom’s full-year margin has also been trending down over the past 12 months, decreasing by 1.7 percentage points. If this move continues, it could suggest a more competitive environment with some pressure to lower prices and higher input costs (such as raw materials and manufacturing expenses).
8. Operating Margin
Broadcom has been a well-oiled machine over the last two years. It demonstrated elite profitability for a semiconductor business, boasting an average operating margin of 37%. This result isn’t surprising as its high gross margin gives it a favorable starting point.
Analyzing the trend in its profitability, Broadcom’s operating margin rose by 6.3 percentage points over the last five years, as its sales growth gave it operating leverage.
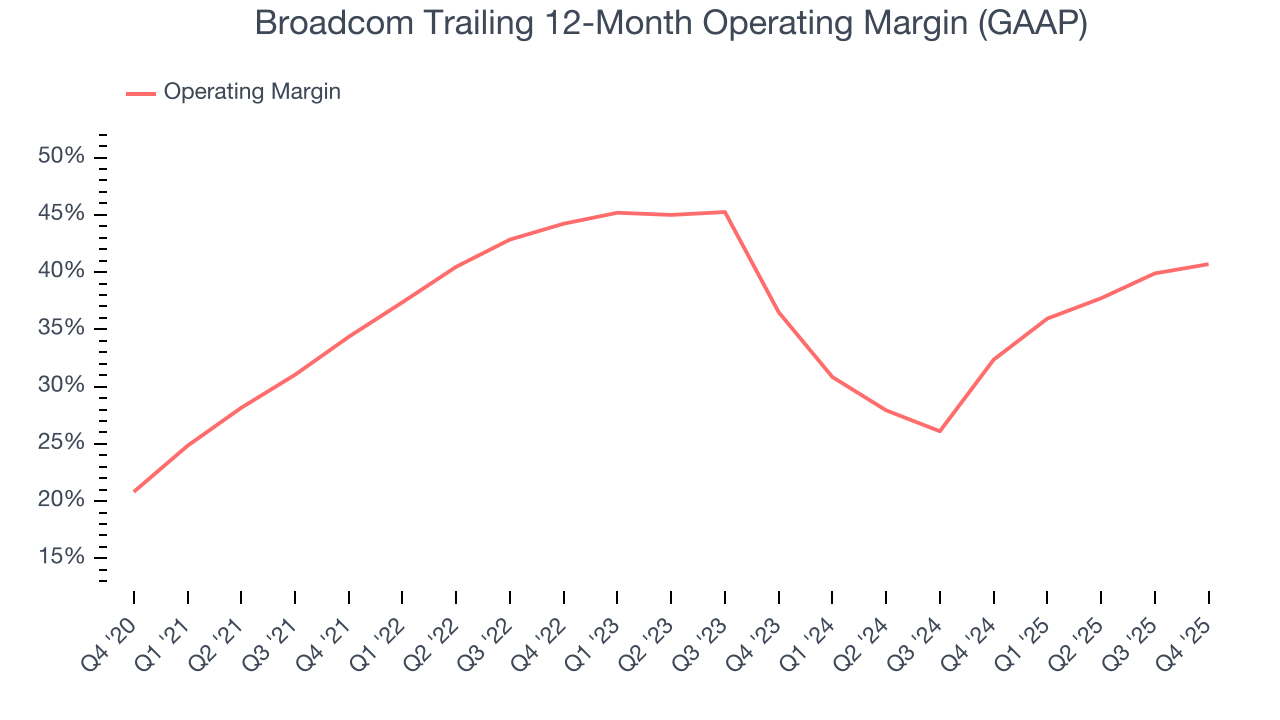
In Q4, Broadcom generated an operating margin profit margin of 44.3%, up 2.4 percentage points year on year. The increase was encouraging, and because its gross margin actually decreased, we can assume it was more efficient because its operating expenses like marketing, R&D, and administrative overhead grew slower than its revenue.
9. Earnings Per Share
Revenue trends explain a company’s historical growth, but the long-term change in earnings per share (EPS) points to the profitability of that growth – for example, a company could inflate its sales through excessive spending on advertising and promotions.
Broadcom’s EPS grew at 25.3% compounded annual growth rate over the last five years, higher than its 22.6% annualized revenue growth. This tells us the company became more profitable on a per-share basis as it expanded.
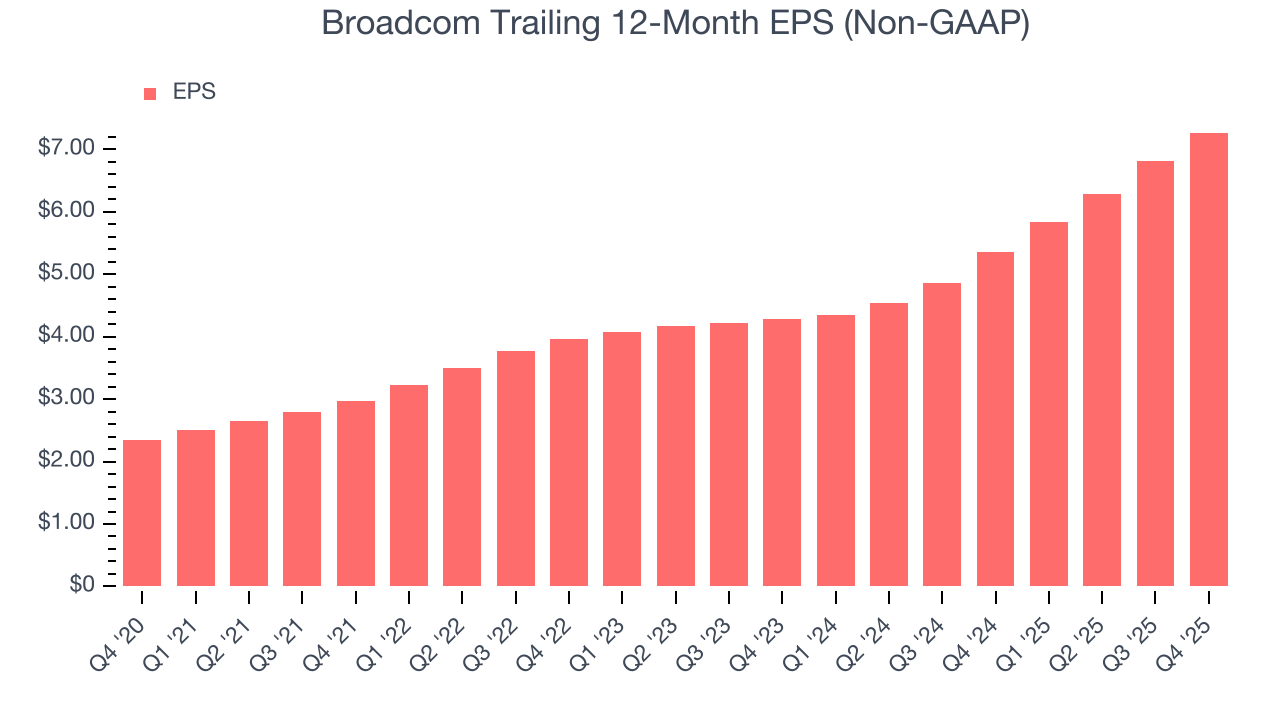
We can take a deeper look into Broadcom’s earnings quality to better understand the drivers of its performance. As we mentioned earlier, Broadcom’s operating margin expanded by 6.3 percentage points over the last five years. This was the most relevant factor (aside from the revenue impact) behind its higher earnings; interest expenses and taxes can also affect EPS but don’t tell us as much about a company’s fundamentals.
In Q4, Broadcom reported adjusted EPS of $2.05, up from $1.60 in the same quarter last year. This print beat analysts’ estimates by 1.3%. Over the next 12 months, Wall Street expects Broadcom’s full-year EPS of $7.27 to grow 61.1%.
10. Cash Is King
Free cash flow isn't a prominently featured metric in company financials and earnings releases, but we think it's telling because it accounts for all operating and capital expenses, making it tough to manipulate. Cash is king.
Broadcom has shown terrific cash profitability, and if sustainable, puts it in an advantageous position to invest in new products, return capital to investors, and consolidate the market during industry downturns. The company’s free cash flow margin was among the best in the semiconductor sector, averaging an eye-popping 40.4% over the last two years. Broadcom has shown terrific cash profitability relative to peers over the last two years, giving the company fewer opportunities to return capital to shareholders.
Taking a step back, we can see that Broadcom’s margin dropped by 5.8 percentage points over the last five years. It may have ticked higher more recently, but shareholders are likely hoping for its margin to at least revert to its historical level. If the longer-term trend returns, it could signal increasing investment needs and capital intensity.
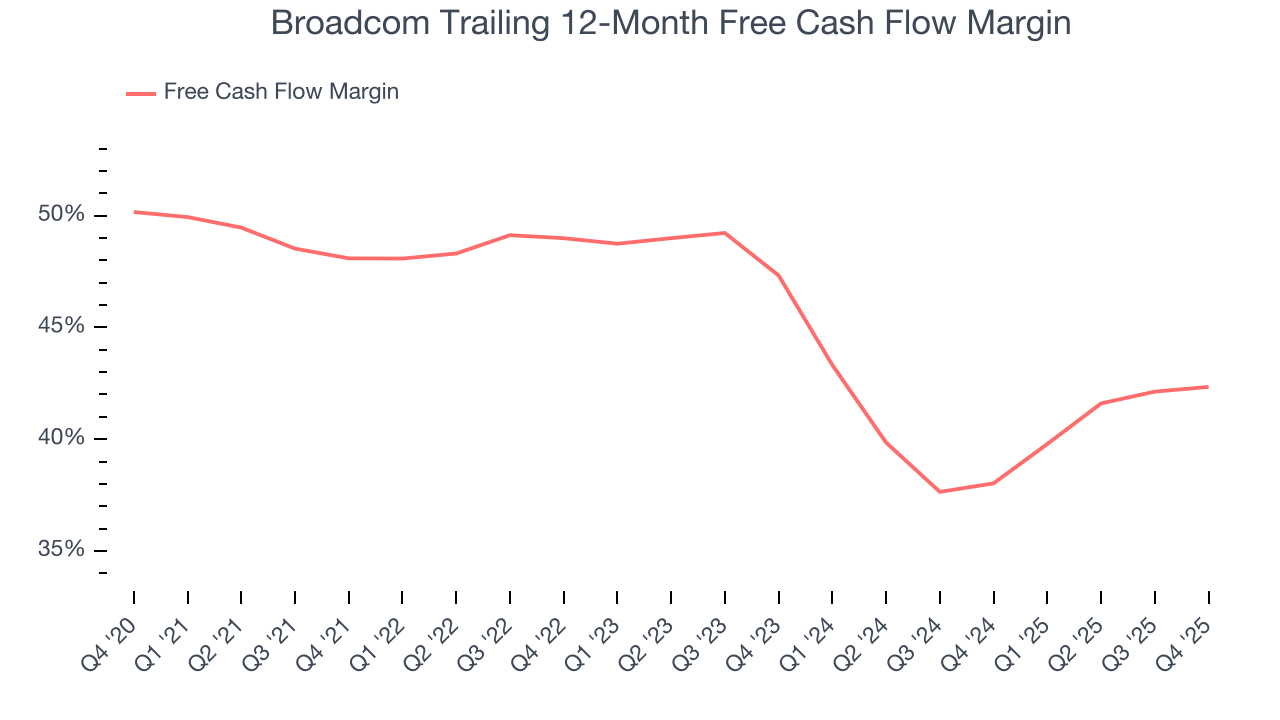
Broadcom’s free cash flow clocked in at $8.01 billion in Q4, equivalent to a 41.5% margin. This result was good as its margin was 1.2 percentage points higher than in the same quarter last year. Its cash profitability was also above its two-year level, and we hope the company can build on this trend.
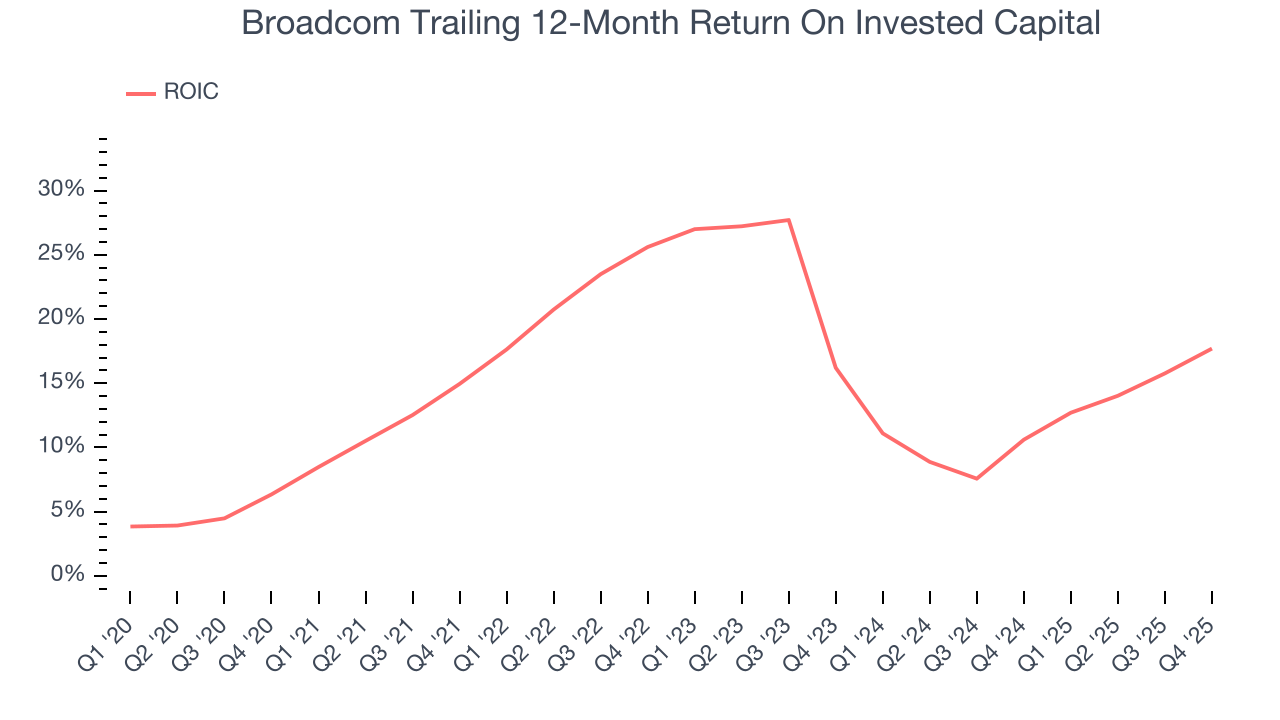
11. Return on Invested Capital (ROIC)
EPS and free cash flow tell us whether a company was profitable while growing its revenue. But was it capital-efficient? A company’s ROIC explains this by showing how much operating profit it makes compared to the money it has raised (debt and equity).
Broadcom’s management team makes decent investment decisions and generates value for shareholders. Its five-year average ROIC was 17%, slightly better than typical semiconductor business.
12. Balance Sheet Assessment
Broadcom reported $14.17 billion of cash and $66.06 billion of debt on its balance sheet in the most recent quarter. As investors in high-quality companies, we primarily focus on two things: 1) that a company’s debt level isn’t too high and 2) that its interest payments are not excessively burdening the business.
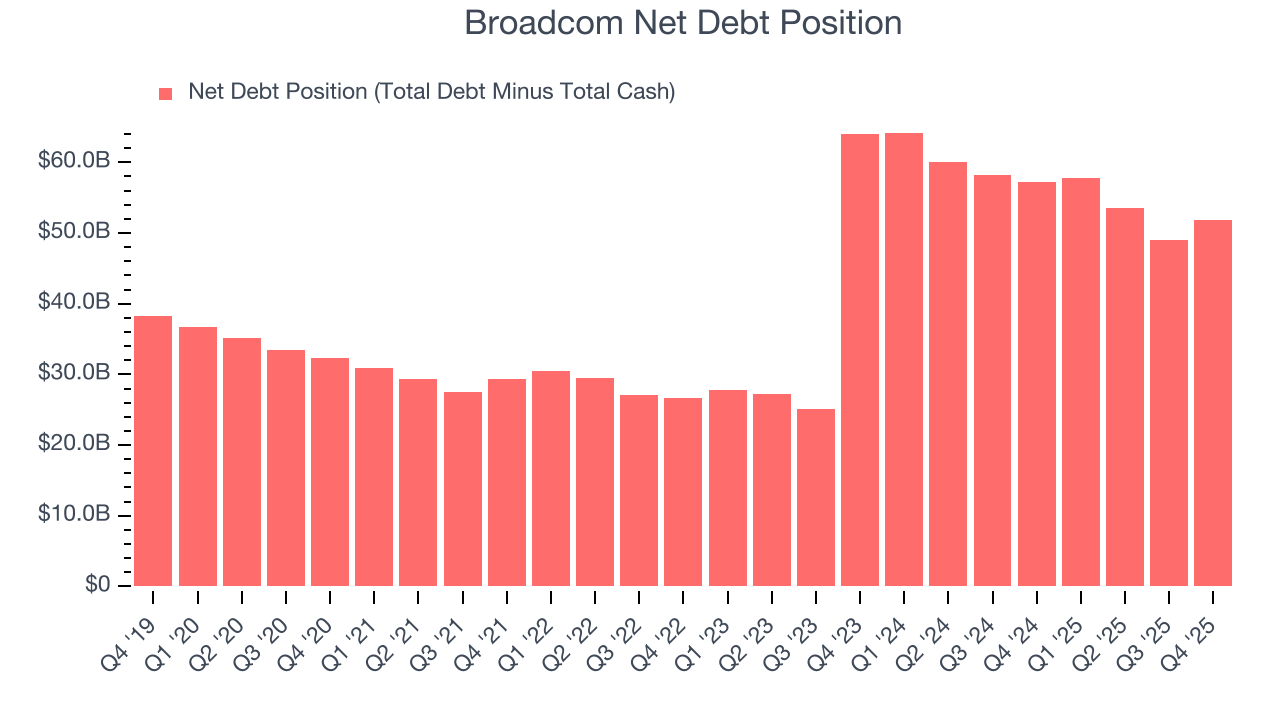
With $46.05 billion of EBITDA over the last 12 months, we view Broadcom’s 1.1× net-debt-to-EBITDA ratio as safe. We also see its $1.19 billion of annual interest expenses as appropriate. The company’s profits give it plenty of breathing room, allowing it to continue investing in growth initiatives.
13. Key Takeaways from Broadcom’s Q4 Results
We were impressed by Broadcom’s strong improvement in inventory levels. We were also glad its revenue guidance for next quarter trumped Wall Street’s estimates. Overall, we think this was a solid quarter with some key areas of upside. The stock remained flat at $319.98 immediately after reporting.
14. Is Now The Time To Buy Broadcom?
Updated: March 23, 2026 at 10:15 PM EDT
Before investing in or passing on Broadcom, we urge you to understand the company’s business quality (or lack thereof), valuation, and the latest quarterly results - in that order.
There is a lot to like about Broadcom. To begin with, its revenue growth was exceptional over the last five years, and its growth over the next 12 months is expected to accelerate. On top of that, its admirable gross margins indicate robust pricing power, and its powerful free cash flow generation enables it to stay ahead of the competition through consistent reinvestment of profits.
Broadcom’s P/E ratio based on the next 12 months is 23.2x. Looking across the spectrum of semiconductor businesses, Broadcom’s fundamentals clearly illustrate it’s a special business. We like the stock at this price.
Wall Street analysts have a consensus one-year price target of $472.01 on the company (compared to the current share price of $322.90), implying they see 46.2% upside in buying Broadcom in the short term.