
Mission Produce (AVO)
We wouldn’t recommend Mission Produce. Its low returns on capital raise concerns about its ability to deliver profits, a must for quality companies.― StockStory Analyst Team
1. News
2. Summary
Why We Think Mission Produce Will Underperform
Founded in 1983 in California, Mission Produce (NASDAQ:AVO) grows, packages, and distributes avocados.
- Estimated sales decline of 18.2% for the next 12 months implies a challenging demand environment
- Gross margin of 12% is below its competitors, leaving less money to invest in areas like marketing and production facilities
- Subscale operations are evident in its revenue base of $1.34 billion, meaning it has fewer distribution channels than its larger rivals


Mission Produce’s quality isn’t great. We’d search for superior opportunities elsewhere.
Why There Are Better Opportunities Than Mission Produce


Mission Produce’s stock price of $11.90 implies a valuation ratio of 21.3x forward P/E. This multiple is higher than most consumer staples companies, and we think it’s quite expensive for the quality you get.
There are stocks out there featuring similar valuation multiples with better fundamentals. We prefer to invest in those.
3. Mission Produce (AVO) Research Report: Q4 CY2025 Update
Avocado company Mission Produce (NASDAQ:AVO) reported revenue ahead of Wall Street’s expectations in Q4 CY2025, but sales fell by 16.6% year on year to $278.6 million. Its non-GAAP profit of $0.10 per share was 36.4% above analysts’ consensus estimates.
Mission Produce (AVO) Q4 CY2025 Highlights:
- Revenue: $278.6 million vs analyst estimates of $260.7 million (16.6% year-on-year decline, 6.9% beat)
- Adjusted EPS: $0.10 vs analyst estimates of $0.07 (36.4% beat)
- Adjusted EBITDA: $20.6 million vs analyst estimates of $17.27 million (7.4% margin, 19.3% beat)
- Operating Margin: 0.9%, down from 2.9% in the same quarter last year
- Free Cash Flow was -$14.9 million compared to -$16 million in the same quarter last year
- Sales Volumes rose 14% year on year (5% in the same quarter last year)
- Market Capitalization: $943.7 million
Company Overview
Founded in 1983 in California, Mission Produce (NASDAQ:AVO) grows, packages, and distributes avocados.
The company began as a small and modest avocado distributor. Over time, however, Mission Produce grew organically and also capitalized on strategic acquisitions of avocado farms and processing plants that allowed the company to cement itself as a vertically-integrated and dominant player in the industry.
The product is self explanatory, but Mission Produce differentiates itself with the scale and technology that allows their product to reach consumers in near-peak or peak condition. Because let’s be honest, no one likes that rock-hard green avocado that takes a long time to ripen, and on the other side of the coin, no one likes an over-ripened or rotten avocado either.
The core customer tends to be a health conscious shopper, although avocados are making their way more into the mainstream through Mexican dishes, salads, and avocado toast. Mission Produce’s offering can be found in many locations selling fresh fruit and vegetables including supermarkets, club stores, and large-format general merchandise retailers that have grocery sections.
4. Perishable Food
The perishable food industry is diverse, encompassing large-scale producers and distributors to specialty and artisanal brands. These companies sell produce, dairy products, meats, and baked goods and have become integral to serving modern American consumers who prioritize freshness, quality, and nutritional value. Investing in perishable food stocks presents both opportunities and challenges. While the perishable nature of products can introduce risks related to supply chain management and shelf life, it also creates a constant demand driven by the necessity for fresh food. Companies that can efficiently manage inventory, distribution, and quality control are well-positioned to thrive in this competitive market. Navigating the perishable food industry requires adherence to strict food safety standards, regulations, and labeling requirements.
Competitors in the avocado industry include Calavo Growers (NASDAQ:CVGW), private company West Pak Avocado, and some smaller, independent growers and distributors.
5. Revenue Growth
Examining a company’s long-term performance can provide clues about its quality. Any business can experience short-term success, but top-performing ones enjoy sustained growth for years.
With $1.34 billion in revenue over the past 12 months, Mission Produce is a small consumer staples company, which sometimes brings disadvantages compared to larger competitors benefiting from economies of scale and negotiating leverage with retailers. On the bright side, it can grow faster because it has a longer list of untapped store chains to sell into.
As you can see below, Mission Produce grew its sales at a decent 8.6% compounded annual growth rate over the last three years as consumers bought more of its products.
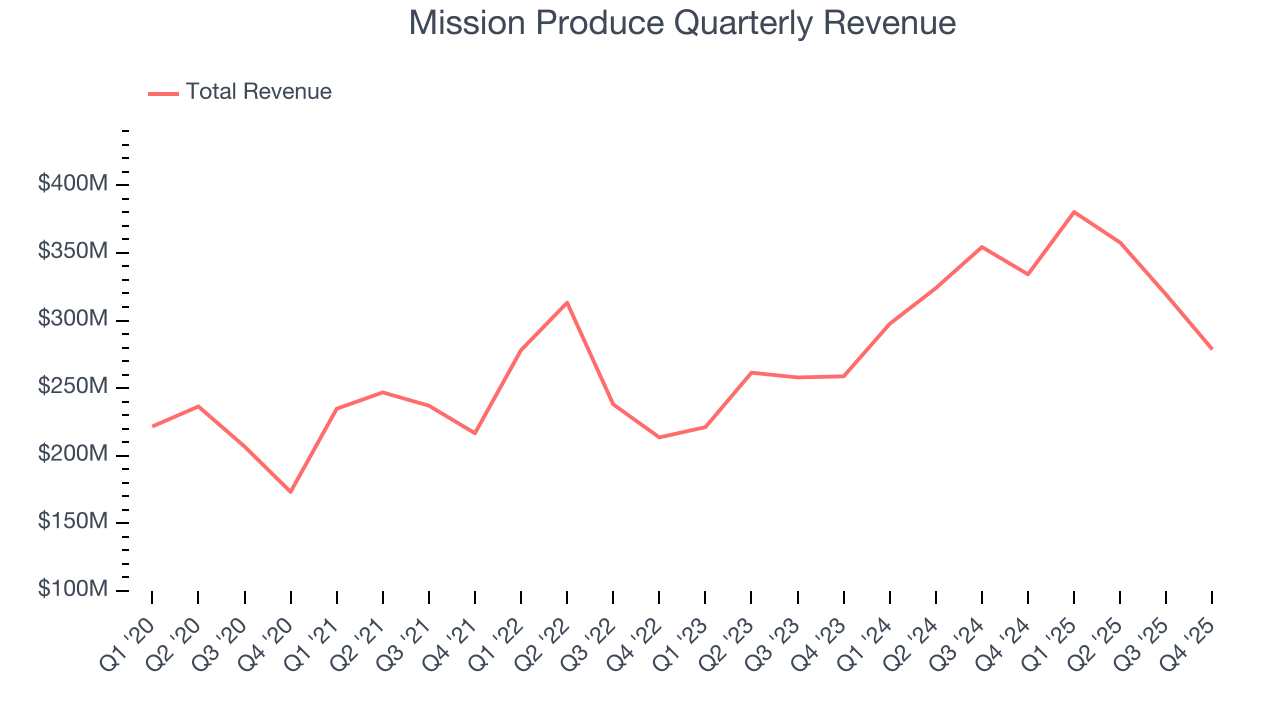
This quarter, Mission Produce’s revenue fell by 16.6% year on year to $278.6 million but beat Wall Street’s estimates by 6.9%.
Looking ahead, sell-side analysts expect revenue to decline by 20.6% over the next 12 months, a deceleration versus the last three years. This projection doesn't excite us and suggests its products will see some demand headwinds.
6. Volume Growth
Revenue growth can be broken down into changes in price and volume (the number of units sold). While both are important, volume is the lifeblood of a successful staples business as there’s a ceiling to what consumers will pay for everyday goods; they can always trade down to non-branded products if the branded versions are too expensive.
Mission Produce’s average quarterly volume growth was a robust 5% over the last two years. This is good because meaningful volume growth is hard to come by in the stable consumer staples sector. 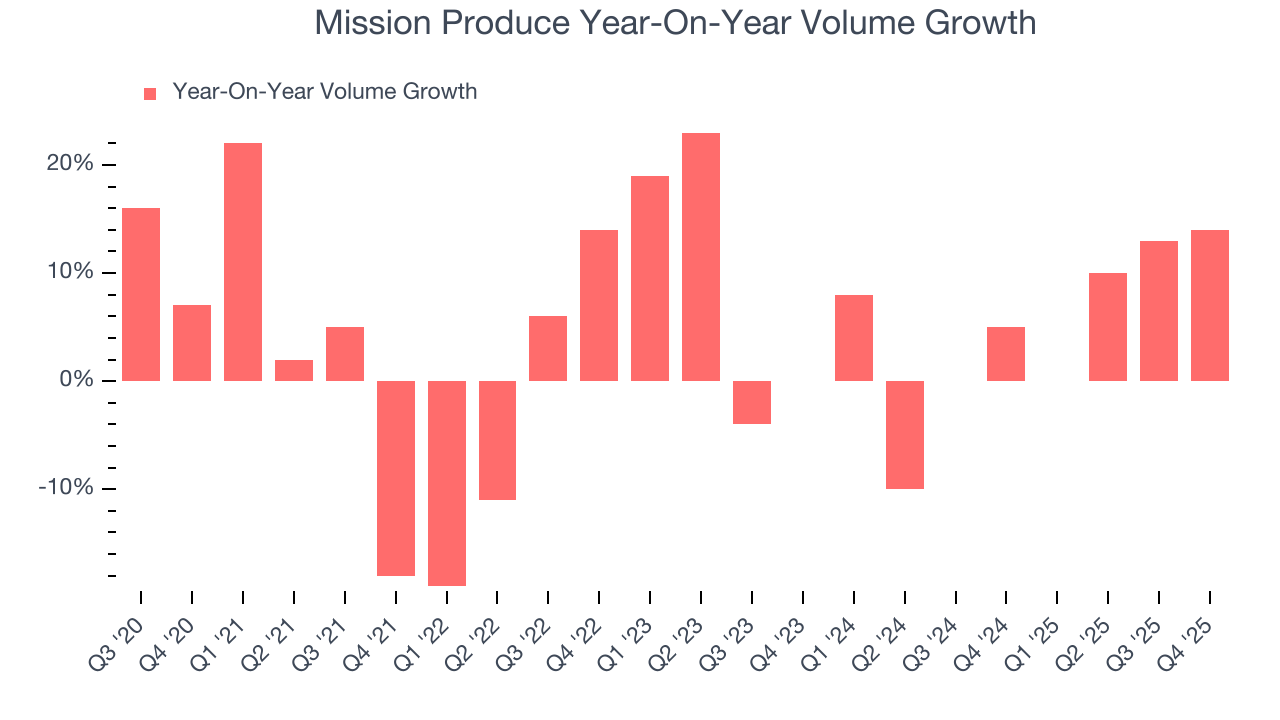
In Mission Produce’s Q4 2026, sales volumes jumped 14% year on year. This result was an acceleration from its historical levels, certainly a positive signal.
7. Gross Margin & Pricing Power
Mission Produce has bad unit economics for a consumer staples company, signaling it operates in a competitive market and lacks pricing power because its products can be substituted. As you can see below, it averaged a 12% gross margin over the last two years. Said differently, for every $100 in revenue, a chunky $88.05 went towards paying for raw materials, production of goods, transportation, and distribution. 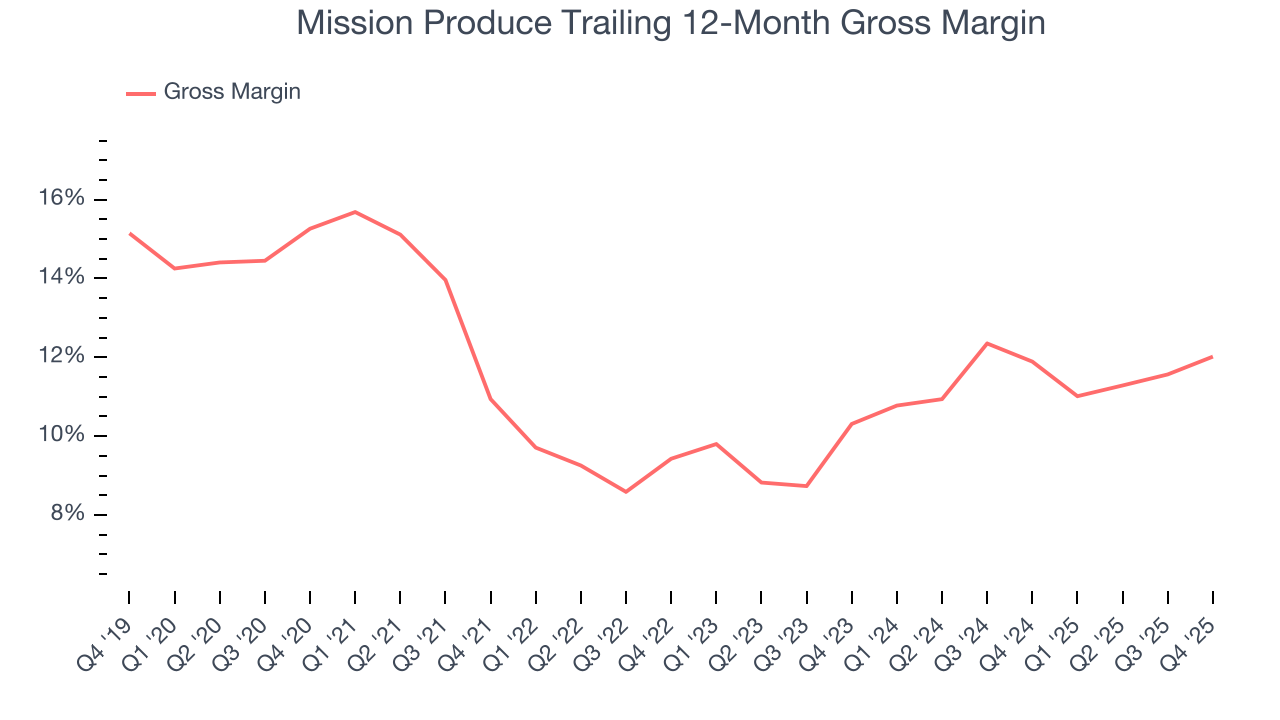
In Q4, Mission Produce produced a 11.3% gross profit margin, up 1.8 percentage points year on year. On a wider time horizon, the company’s full-year margin has remained steady over the past four quarters, suggesting its input costs (such as raw materials and manufacturing expenses) have been stable and it isn’t under pressure to lower prices.
8. Operating Margin
Operating margin is a key profitability metric because it accounts for all expenses enabling a business to operate smoothly, including marketing and advertising, IT systems, wages, and other administrative costs.
Mission Produce’s operating margin has generally stayed the same over the last 12 months, averaging 4.7% over the last two years. This profitability was paltry for a consumer staples business and caused by its suboptimal cost structureand low gross margin.
Looking at the trend in its profitability, Mission Produce’s operating margin might fluctuated slightly but has generally stayed the same over the last year. This raises questions about the company’s expense base because its revenue growth should have given it leverage on its fixed costs, resulting in better economies of scale and profitability.
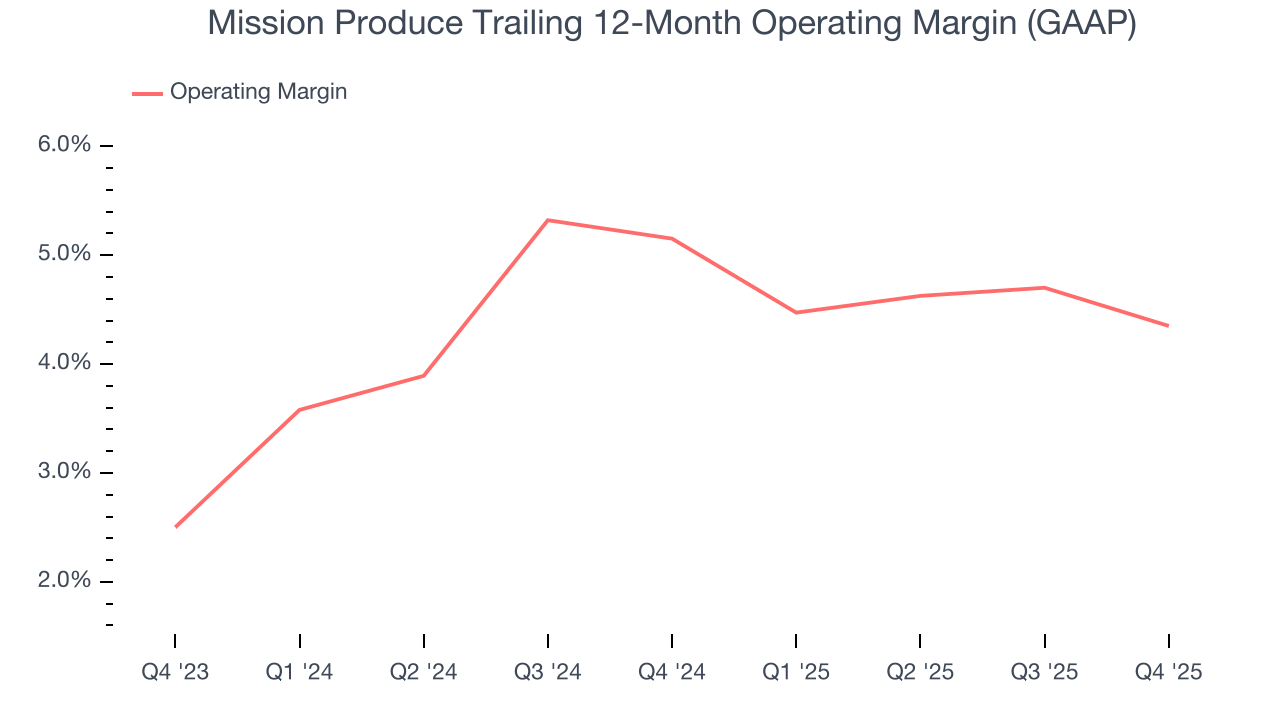
In Q4, Mission Produce’s breakeven margin was 0.9%, down 2 percentage points year on year. Conversely, its gross margin actually rose, so we can assume its recent inefficiencies were driven by increased operating expenses like marketing, and administrative overhead.
9. Earnings Per Share
Revenue trends explain a company’s historical growth, but the long-term change in earnings per share (EPS) points to the profitability of that growth – for example, a company could inflate its sales through excessive spending on advertising and promotions.
Mission Produce’s EPS grew at 28.8% compounded annual growth rate over the last three years, higher than its 8.6% annualized revenue growth. This tells us the company became more profitable on a per-share basis as it expanded.
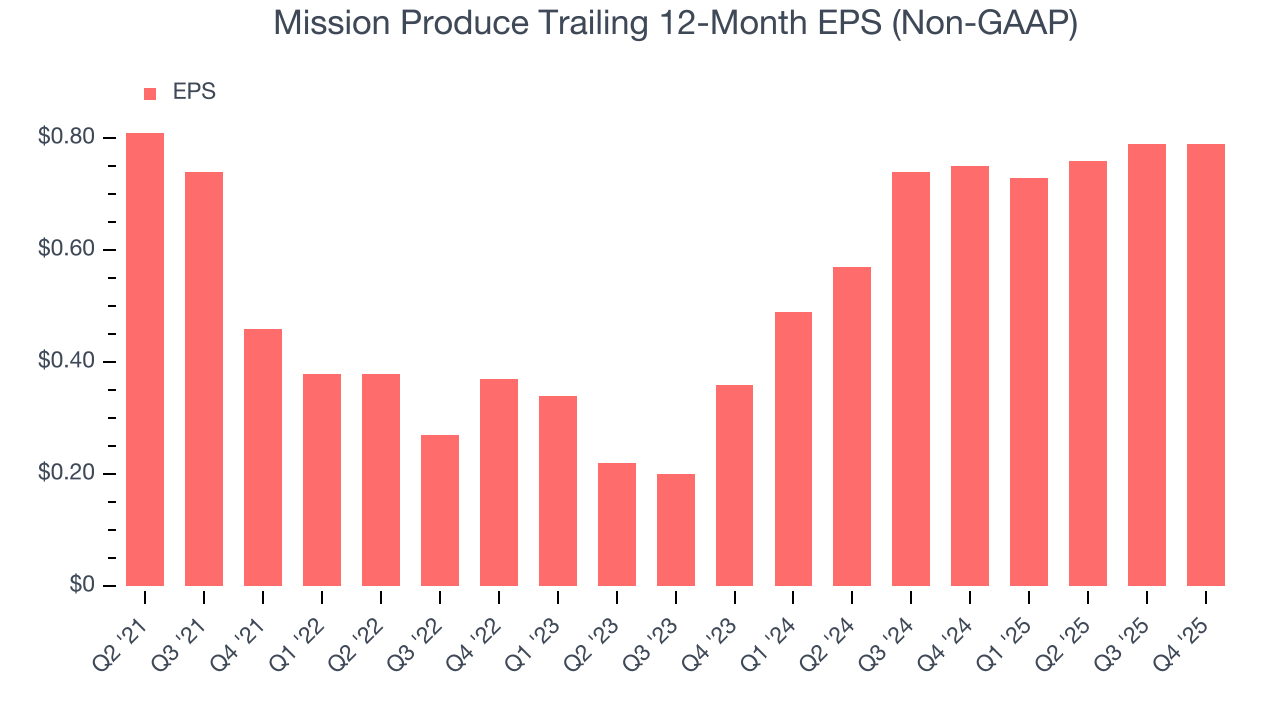
In Q4, Mission Produce reported adjusted EPS of $0.10, in line with the same quarter last year. This print easily cleared analysts’ estimates, and shareholders should be content with the results. Over the next 12 months, Wall Street expects Mission Produce’s full-year EPS of $0.79 to shrink by 9.3%.
10. Cash Is King
Although earnings are undoubtedly valuable for assessing company performance, we believe cash is king because you can’t use accounting profits to pay the bills.
Mission Produce has shown mediocre cash profitability relative to peers over the last two years, giving the company fewer opportunities to return capital to shareholders. Its free cash flow margin averaged 3.2%, below what we’d expect for a consumer staples business.
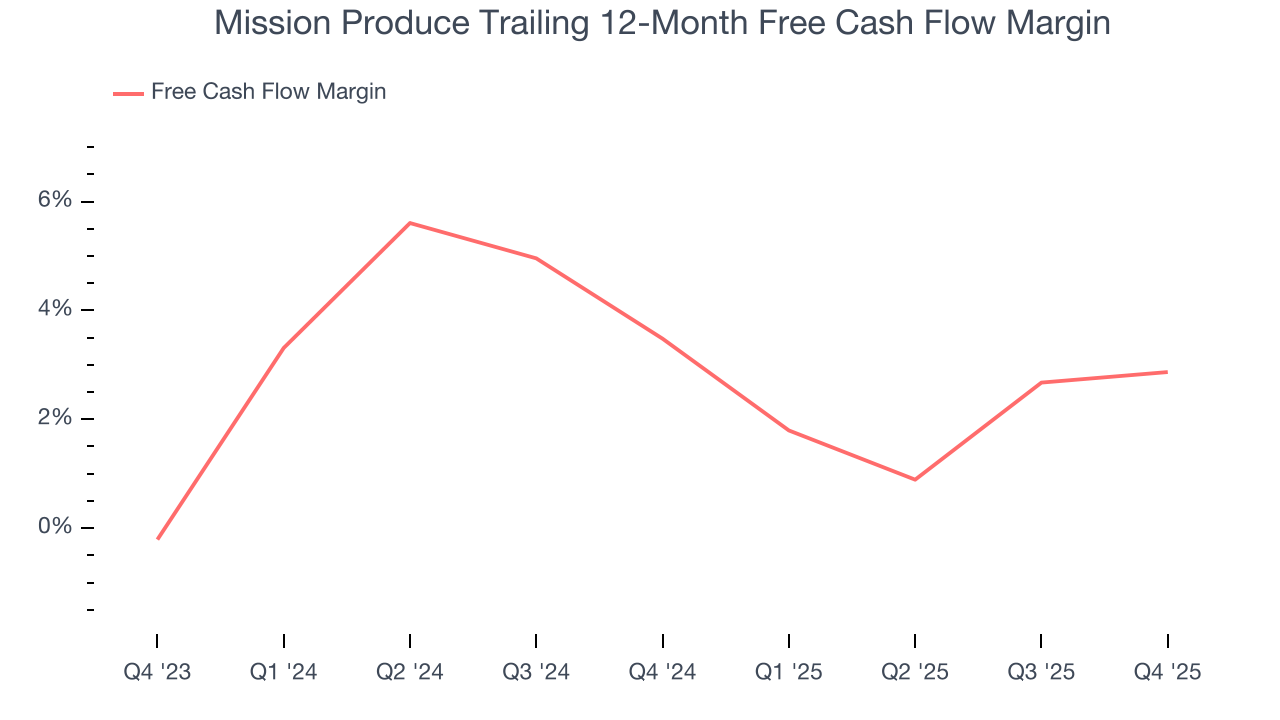
Mission Produce burned through $14.9 million of cash in Q4, equivalent to a negative 5.3% margin. The company’s cash burn was similar to its $16 million of lost cash in the same quarter last year. These numbers deviate from its longer-term margin, indicating it is a seasonal business that must build up inventory during certain quarters.
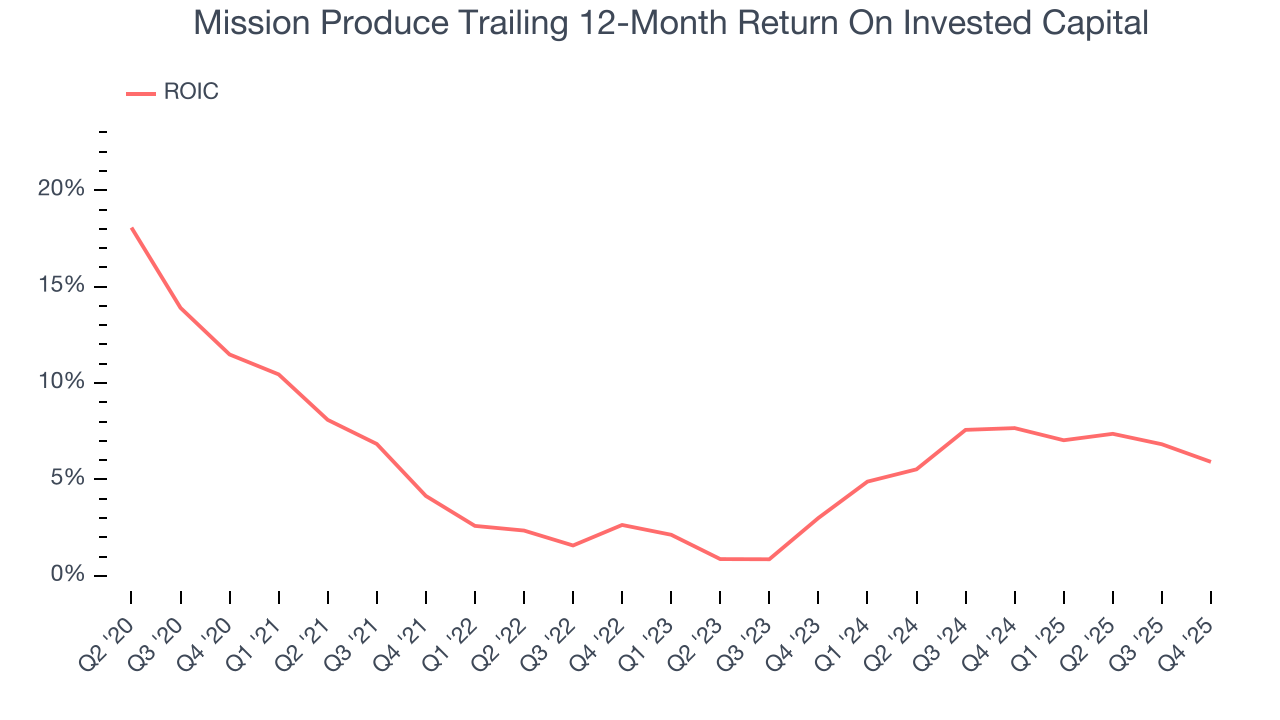
11. Return on Invested Capital (ROIC)
EPS and free cash flow tell us whether a company was profitable while growing its revenue. But was it capital-efficient? A company’s ROIC explains this by showing how much operating profit it makes compared to the money it has raised (debt and equity).
Mission Produce historically did a mediocre job investing in profitable growth initiatives. Its five-year average ROIC was 4.7%, lower than the typical cost of capital (how much it costs to raise money) for consumer staples companies.
12. Balance Sheet Assessment
Mission Produce reported $47.4 million of cash and $199.8 million of debt on its balance sheet in the most recent quarter. As investors in high-quality companies, we primarily focus on two things: 1) that a company’s debt level isn’t too high and 2) that its interest payments are not excessively burdening the business.
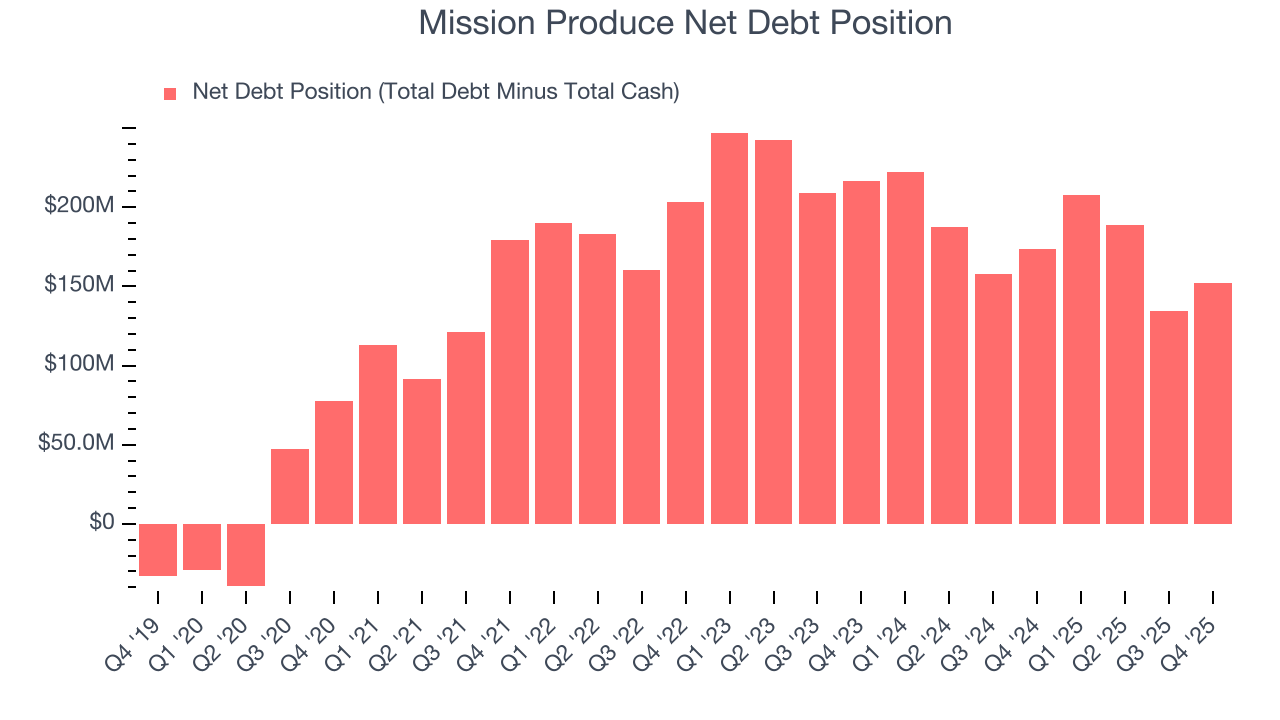
With $113.7 million of EBITDA over the last 12 months, we view Mission Produce’s 1.3× net-debt-to-EBITDA ratio as safe. We also see its $4.2 million of annual interest expenses as appropriate. The company’s profits give it plenty of breathing room, allowing it to continue investing in growth initiatives.
13. Key Takeaways from Mission Produce’s Q4 Results
We were impressed by how significantly Mission Produce blew past analysts’ gross margin expectations this quarter. We were also excited its EBITDA outperformed Wall Street’s estimates by a wide margin. Zooming out, we think this was a good print with some key areas of upside. Investors were likely hoping for more, and shares traded down 1.5% to $13.03 immediately following the results.
14. Is Now The Time To Buy Mission Produce?
Updated: March 15, 2026 at 10:51 PM EDT
When considering an investment in Mission Produce, investors should account for its valuation and business qualities as well as what’s happened in the latest quarter.
Mission Produce doesn’t pass our quality test. Although its revenue growth was decent over the last three years, it’s expected to deteriorate over the next 12 months and its projected EPS for the next year is lacking. And while the company’s EPS growth over the last three years has been fantastic, the downside is its gross margins make it more challenging to reach positive operating profits compared to other consumer staples businesses.
Mission Produce’s P/E ratio based on the next 12 months is 21.3x. This multiple tells us a lot of good news is priced in - we think there are better stocks to buy right now.
Wall Street analysts have a consensus one-year price target of $16.67 on the company (compared to the current share price of $11.90).
Although the price target is bullish, readers should exercise caution because analysts tend to be overly optimistic. The firms they work for, often big banks, have relationships with companies that extend into fundraising, M&A advisory, and other rewarding business lines. As a result, they typically hesitate to say bad things for fear they will lose out. We at StockStory do not suffer from such conflicts of interest, so we’ll always tell it like it is.