Charter (CHTR)
We wouldn’t buy Charter. Its sales have underperformed and its low returns on capital show it has few growth opportunities.― StockStory Analyst Team
1. News


2. Summary
Why We Think Charter Will Underperform
Operating as Spectrum, Charter (NASDAQ:CHTR) is a leading telecommunications company offering cable television, high-speed internet, and voice services across the United States.
- Annual sales growth of 2.6% over the last five years lagged behind its consumer discretionary peers as its large revenue base made it difficult to generate incremental demand
- Demand will likely be weak over the next 12 months as Wall Street expects flat revenue
- Ability to fund investments or reward shareholders with increased buybacks or dividends is restricted by its weak free cash flow margin of 6.9% for the last two years


Charter’s quality isn’t great. Better stocks can be found in the market.
Why There Are Better Opportunities Than Charter


Charter is trading at $218.21 per share, or 5x forward P/E. This sure is a cheap multiple, but you get what you pay for.
Our advice is to pay up for elite businesses whose advantages are tailwinds to earnings growth. Don’t get sucked into lower-quality businesses just because they seem like bargains. These mediocre businesses often never achieve a higher multiple as hoped, a phenomenon known as a “value trap”.
3. Charter (CHTR) Research Report: Q4 CY2025 Update
Cable, internet, and telephone services provider Charter (NASDAQ:CHTR) fell short of the market’s revenue expectations in Q4 CY2025, with sales falling 2.3% year on year to $13.6 billion. Its non-GAAP profit of $10.42 per share was 6.1% above analysts’ consensus estimates.
Charter (CHTR) Q4 CY2025 Highlights:
- Revenue: $13.6 billion vs analyst estimates of $13.74 billion (2.3% year-on-year decline, 1% miss)
- Adjusted EPS: $10.42 vs analyst estimates of $9.83 (6.1% beat)
- Adjusted EBITDA: $5.69 billion vs analyst estimates of $5.6 billion (41.8% margin, 1.6% beat)
- Operating Margin: 24%, in line with the same quarter last year
- Free Cash Flow Margin: 3.1%, similar to the same quarter last year
- Internet Subscribers: 29.68 million, up 1.65 million year on year
- Market Capitalization: $28.31 billion
Company Overview
Operating as Spectrum, Charter (NASDAQ:CHTR) is a leading telecommunications company offering cable television, high-speed internet, and voice services across the United States.
Founded in 1993, Charter initially focused on cable TV services, but over the years, it expanded to meet evolving customer needs. Key acquisitions, including Time Warner Cable and Bright House Networks, solidified Charter's position in the industry, aiming to provide a comprehensive communication and entertainment experience.
Today, Charter delivers cable TV, high-speed internet, and voice services to both residential and business customers. Their offerings address the demand for reliable internet access, diverse entertainment choices, and efficient communication solutions. By providing these integrated services, Charter simplifies the fragmented telecom landscape.
Revenue primarily comes from subscriptions to these services, with a focus on quality, reliability, and customer service. Charter's adaptability and commitment to customer satisfaction have made it a leading telecom provider in the U.S. market, appealing to a broad range of customers seeking comprehensive, high-quality telecommunications services.
4. Wireless, Cable and Satellite
The massive physical footprints of cell phone towers, fiber in the ground, or satellites in space make it challenging for companies in this industry to adjust to shifting consumer habits. Over the last decade-plus, consumers have ‘cut the cord’ to their landlines and traditional cable subscriptions in favor of wireless communications and streaming video. These trends do mean that more households need cell phone plans and high-speed internet. Companies that successfully serve customers can enjoy high retention rates and pricing power since the options for mobile and internet connectivity in any geography are usually limited.
Competitors in the telecommunications and media services industry include Comcast (NASDAQ:CMCSA), DISH Network (NASDAQ:DISH), and AT&T (NYSE:T).
5. Revenue Growth
A company’s long-term sales performance is one signal of its overall quality. Any business can experience short-term success, but top-performing ones enjoy sustained growth for years. Regrettably, Charter’s sales grew at a weak 2.6% compounded annual growth rate over the last five years. This was below our standards and is a rough starting point for our analysis.
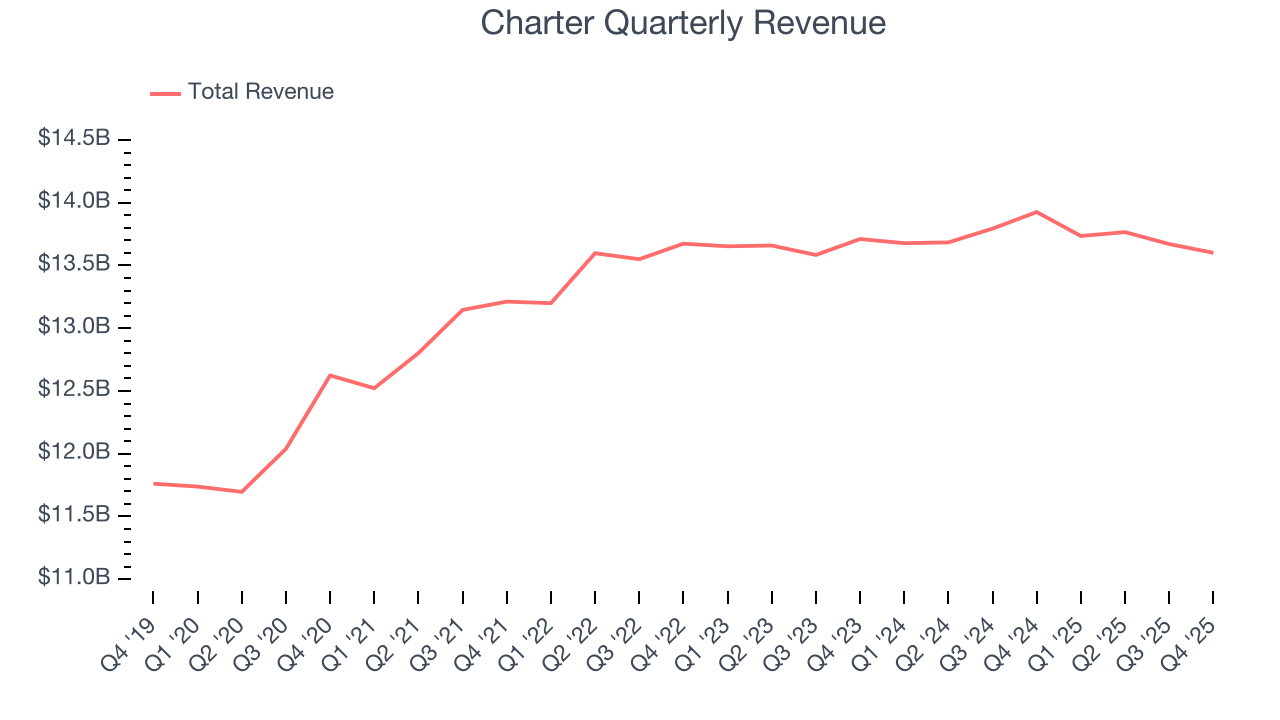
We at StockStory place the most emphasis on long-term growth, but within consumer discretionary, a stretched historical view may miss a company riding a successful new product or trend. Charter’s recent performance shows its demand has slowed as its revenue was flat over the last two years. 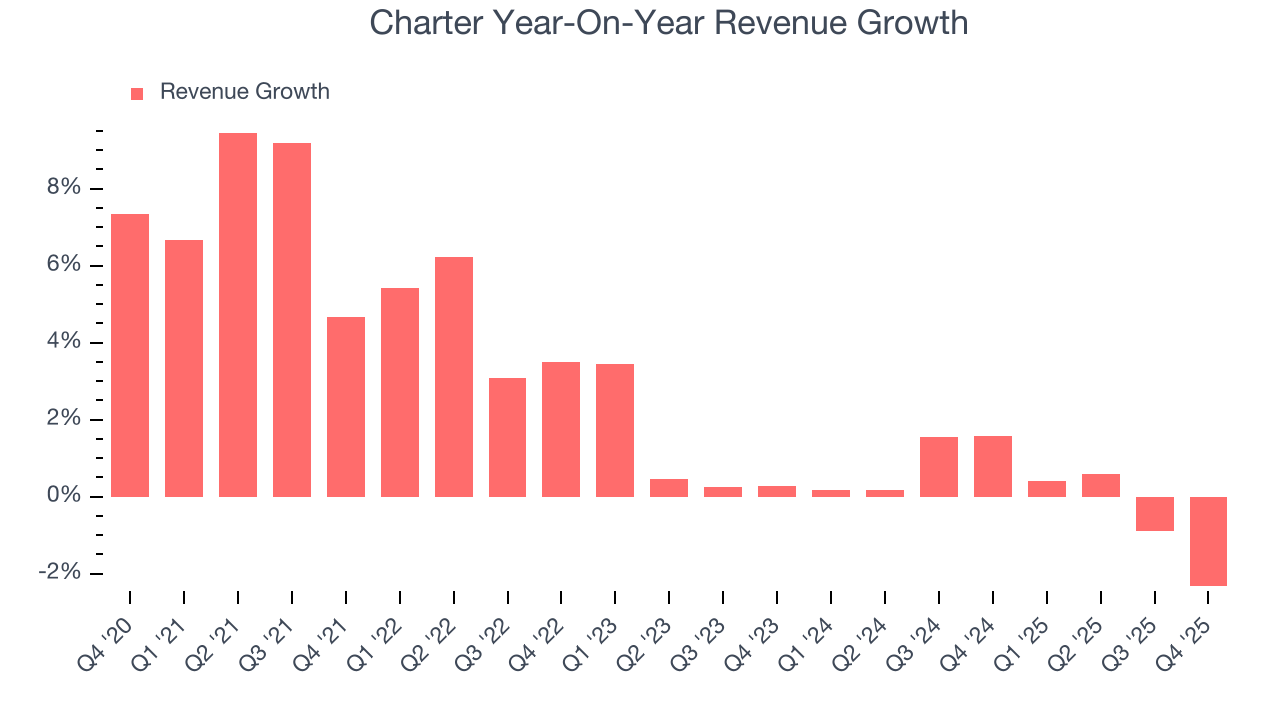
Charter also discloses its number of internet subscribers and video subscribers, which clocked in at 29.68 million and 12.61 million in the latest quarter. Over the last two years, Charter’s internet subscribers averaged 2.7% year-on-year growth while its video subscribers averaged 40,020% year-on-year growth. 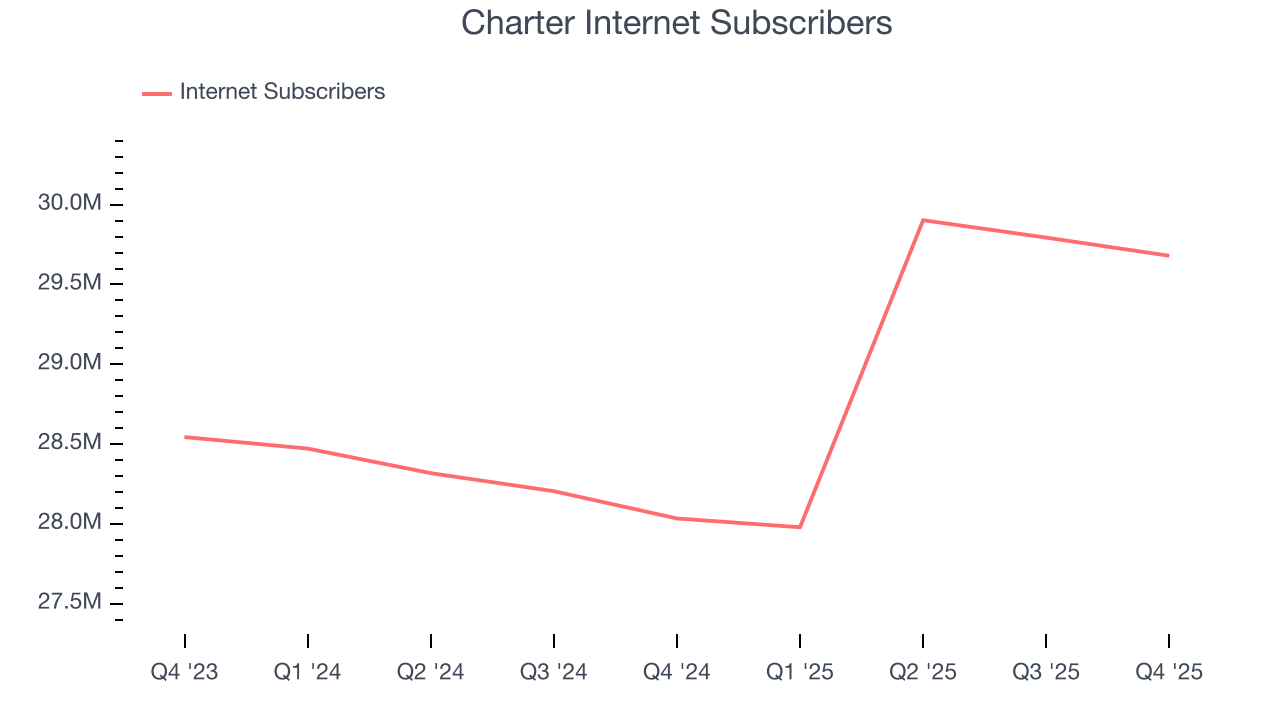
This quarter, Charter missed Wall Street’s estimates and reported a rather uninspiring 2.3% year-on-year revenue decline, generating $13.6 billion of revenue.
Looking ahead, sell-side analysts expect revenue to remain flat over the next 12 months. This projection is underwhelming and indicates its newer products and services will not accelerate its top-line performance yet.
6. Operating Margin
Operating margin is an important measure of profitability as it shows the portion of revenue left after accounting for all core expenses – everything from the cost of goods sold to advertising and wages. It’s also useful for comparing profitability across companies with different levels of debt and tax rates because it excludes interest and taxes.
Charter’s operating margin might fluctuated slightly over the last 12 months but has remained more or less the same, averaging 23.7% over the last two years. This profitability was lousy for a consumer discretionary business and caused by its suboptimal cost structure.
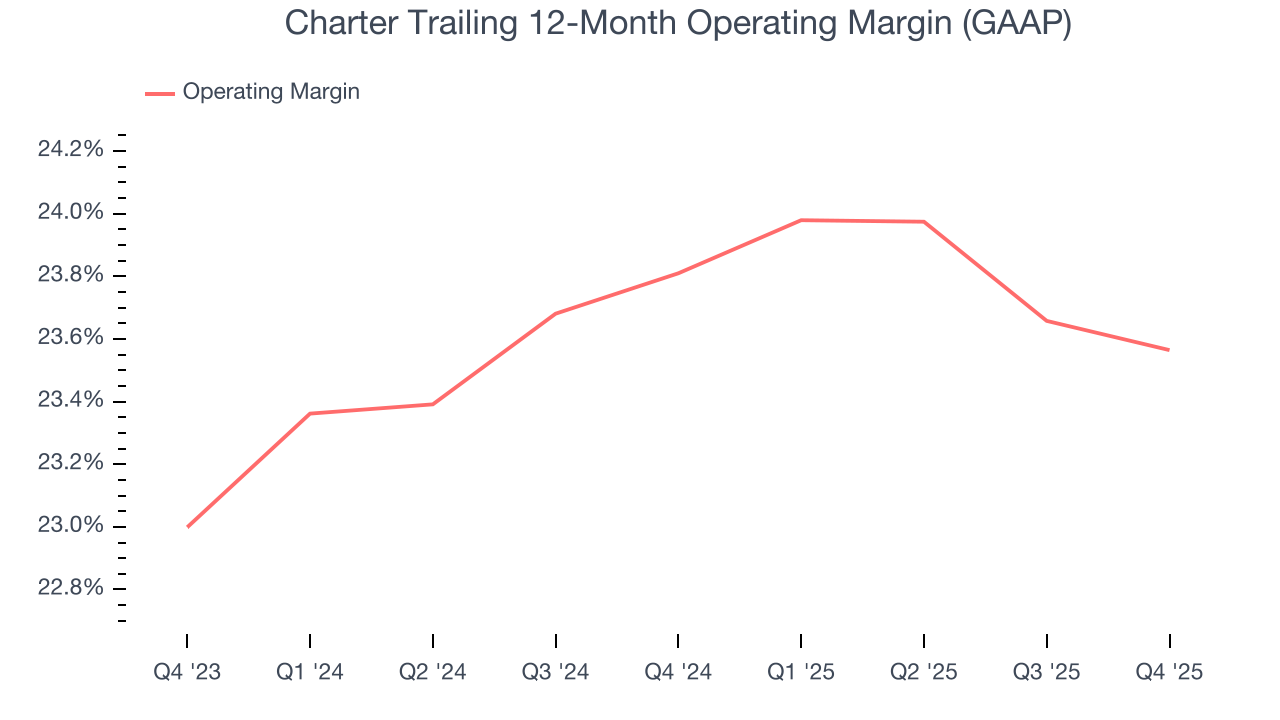
In Q4, Charter generated an operating margin profit margin of 24%, in line with the same quarter last year. This indicates the company’s overall cost structure has been relatively stable.
7. Earnings Per Share
We track the long-term change in earnings per share (EPS) for the same reason as long-term revenue growth. Compared to revenue, however, EPS highlights whether a company’s growth is profitable.
Charter’s EPS grew at a weak 18.1% compounded annual growth rate over the last five years. On the bright side, this performance was better than its 2.6% annualized revenue growth and tells us the company became more profitable on a per-share basis as it expanded.
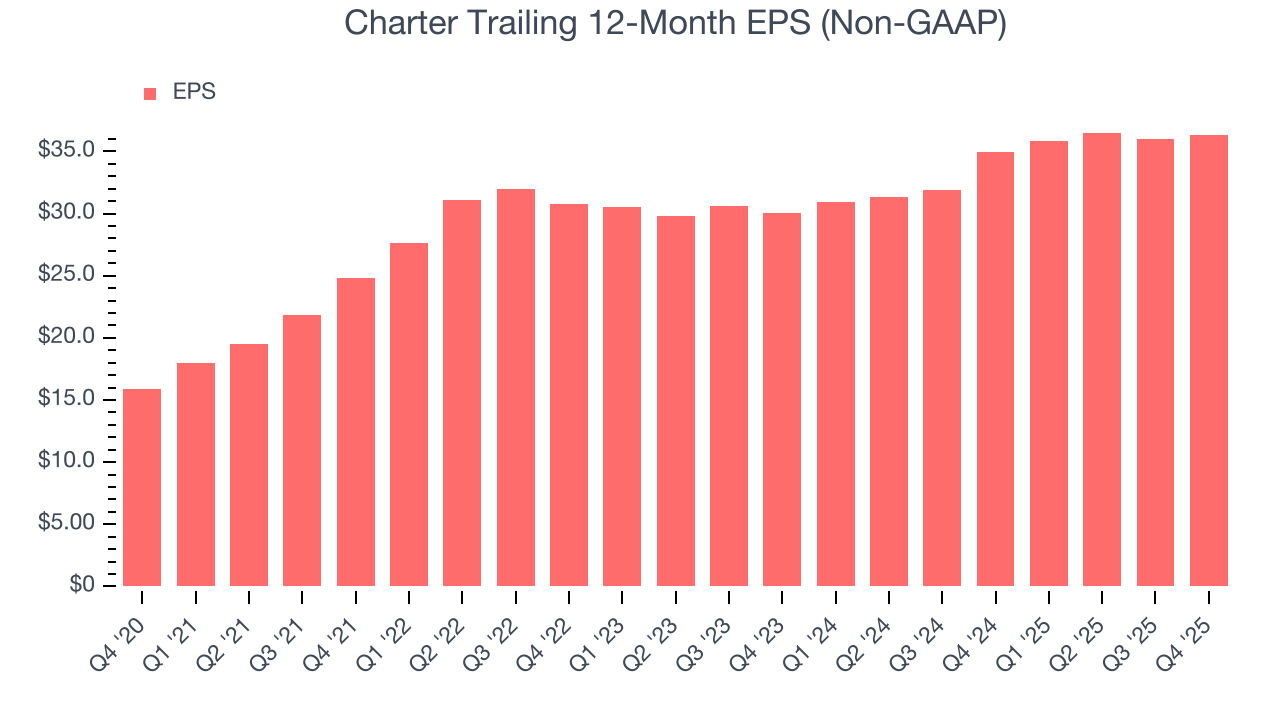
In Q4, Charter reported adjusted EPS of $10.42, up from $10.10 in the same quarter last year. This print beat analysts’ estimates by 7.1%. Over the next 12 months, Wall Street expects Charter’s full-year EPS of $36.36 to grow 20.8%.
8. Cash Is King
Free cash flow isn't a prominently featured metric in company financials and earnings releases, but we think it's telling because it accounts for all operating and capital expenses, making it tough to manipulate. Cash is king.
Charter has shown poor cash profitability over the last two years, giving the company limited opportunities to return capital to shareholders. Its free cash flow margin averaged 6.9%, lousy for a consumer discretionary business.
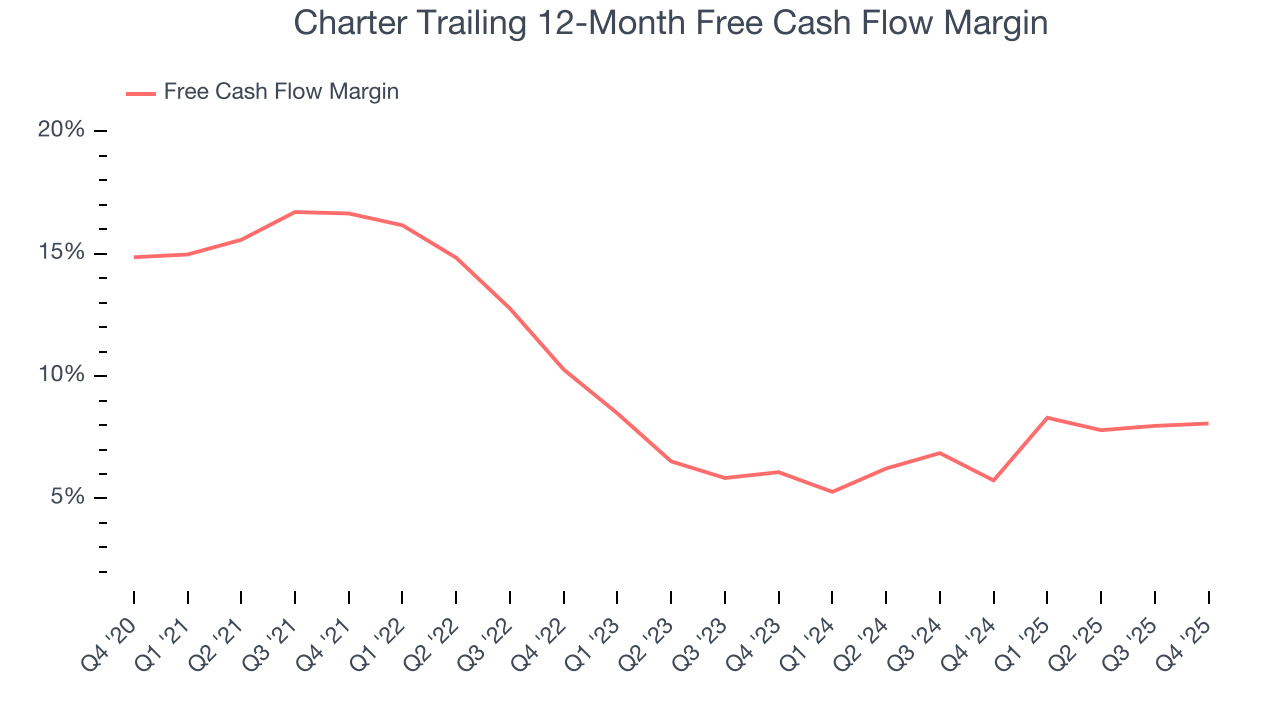
Charter’s free cash flow clocked in at $426 million in Q4, equivalent to a 3.1% margin. This cash profitability was in line with the comparable period last year but below its two-year average. In a silo, this isn’t a big deal because investment needs can be seasonal, but we’ll be watching to see if the trend extrapolates into future quarters.
Over the next year, analysts predict Charter’s cash conversion will slightly improve. Their consensus estimates imply its free cash flow margin of 8.1% for the last 12 months will increase to 10%, it options for capital deployment (investments, share buybacks, etc.).
9. Return on Invested Capital (ROIC)
EPS and free cash flow tell us whether a company was profitable while growing its revenue. But was it capital-efficient? Enter ROIC, a metric showing how much operating profit a company generates relative to the money it has raised (debt and equity).
Charter historically did a mediocre job investing in profitable growth initiatives. Its five-year average ROIC was 10%, somewhat low compared to the best consumer discretionary companies that consistently pump out 25%+.
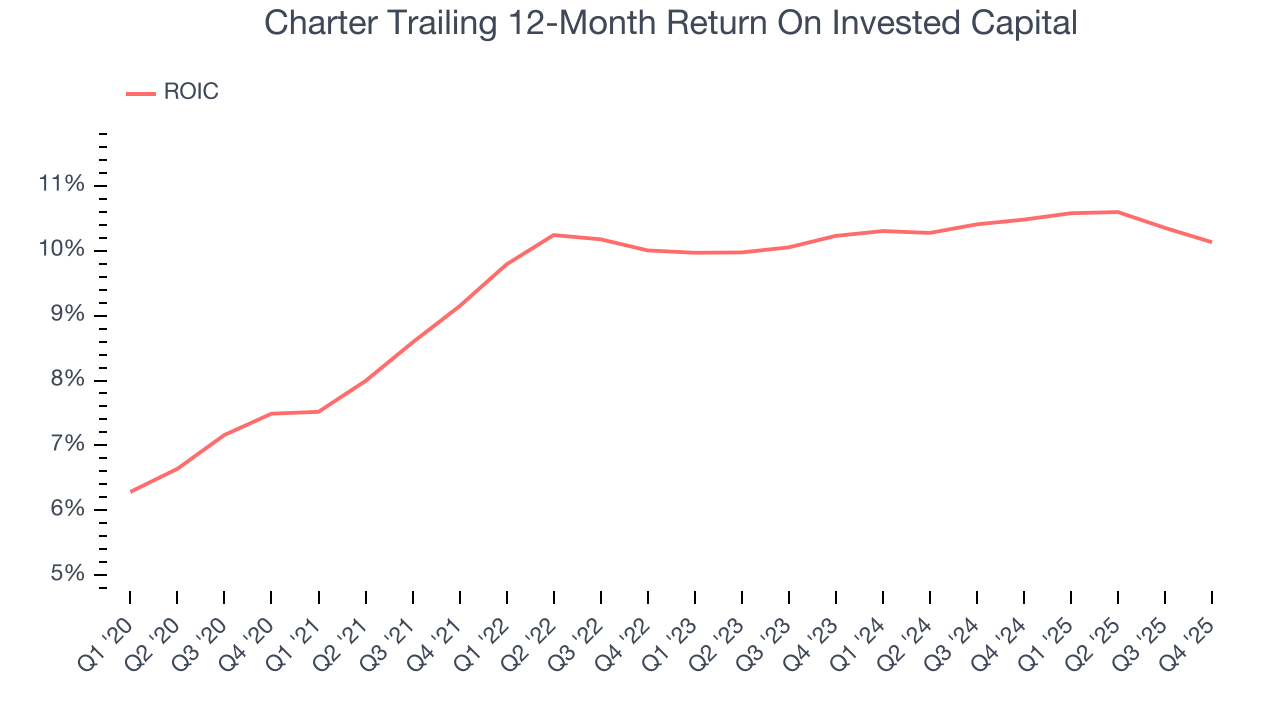
We like to invest in businesses with high returns, but the trend in a company’s ROIC is what often surprises the market and moves the stock price. Unfortunately, Charter’s ROIC has stayed the same over the last few years. If the company wants to become an investable business, it must improve its returns by generating more profitable growth.
10. Balance Sheet Assessment
Charter reported $477 million of cash and $94.76 billion of debt on its balance sheet in the most recent quarter. As investors in high-quality companies, we primarily focus on two things: 1) that a company’s debt level isn’t too high and 2) that its interest payments are not excessively burdening the business.
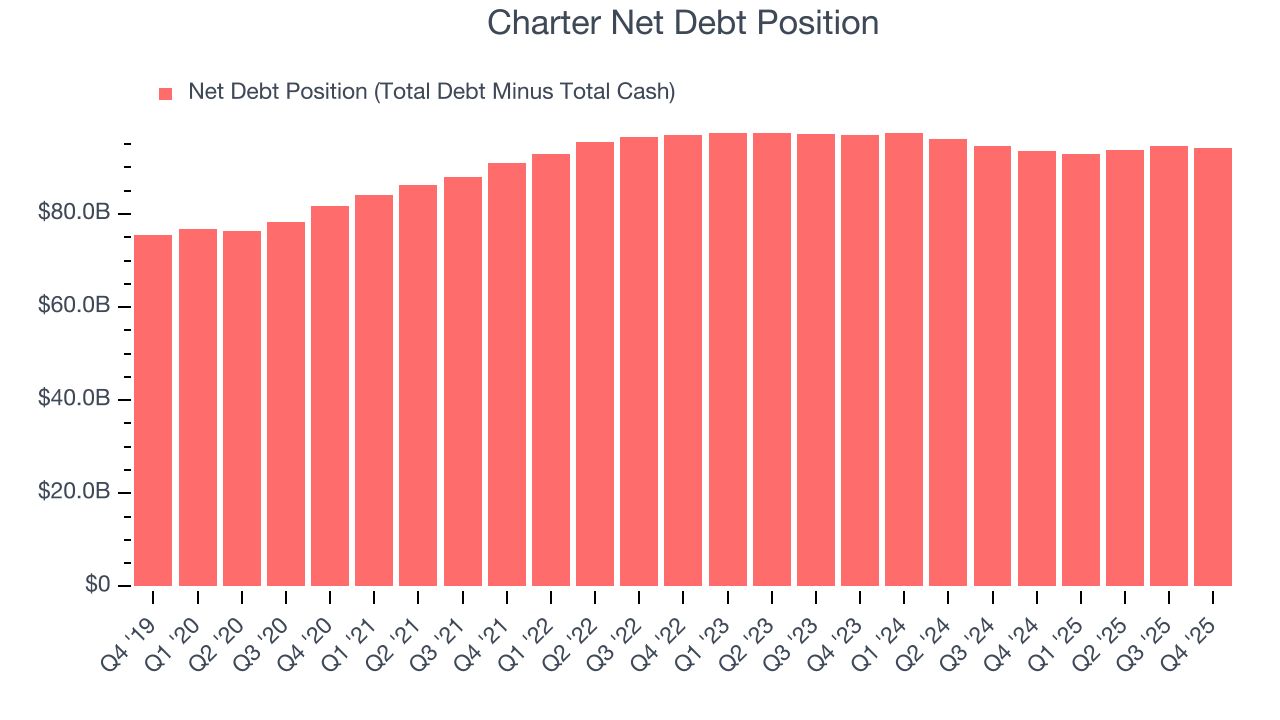
With $22.71 billion of EBITDA over the last 12 months, we view Charter’s 4.2× net-debt-to-EBITDA ratio as safe. We also see its $5.04 billion of annual interest expenses as appropriate. The company’s profits give it plenty of breathing room, allowing it to continue investing in growth initiatives.
11. Key Takeaways from Charter’s Q4 Results
It was good to see Charter beat analysts’ EPS expectations this quarter. On the other hand, its revenue slightly missed. Overall, this was a weaker quarter. The stock traded up 1.2% to $226.12 immediately after reporting.
12. Is Now The Time To Buy Charter?
Updated: March 15, 2026 at 10:50 PM EDT
Before investing in or passing on Charter, we urge you to understand the company’s business quality (or lack thereof), valuation, and the latest quarterly results - in that order.
Charter doesn’t pass our quality test. On top of that, Charter’s number of internet subscribers has disappointed, and its Forecasted free cash flow margin suggests the company will have more capital to invest or return to shareholders next year.
Charter’s P/E ratio based on the next 12 months is 5x. While this valuation is optically cheap, the potential downside is huge given its shaky fundamentals. There are better investments elsewhere.
Wall Street analysts have a consensus one-year price target of $276.80 on the company (compared to the current share price of $218.21).
Although the price target is bullish, readers should exercise caution because analysts tend to be overly optimistic. The firms they work for, often big banks, have relationships with companies that extend into fundraising, M&A advisory, and other rewarding business lines. As a result, they typically hesitate to say bad things for fear they will lose out. We at StockStory do not suffer from such conflicts of interest, so we’ll always tell it like it is.