F5 (FFIV)
F5 is in for a bumpy ride. Its sluggish sales growth shows demand is soft, a worrisome sign for investors in high-quality stocks.― StockStory Analyst Team
1. News


2. Summary
Why We Think F5 Will Underperform
Originally named after the F5 tornado, the most powerful on the meteorological scale, F5 (NASDAQ:FFIV) provides security and delivery solutions that protect applications across cloud, data center, and edge environments for large organizations.
- ARR has dropped by 7.1% over the last year, suggesting it lost long-term deals and renewals
- Estimated sales growth of 4.5% for the next 12 months is soft and implies weaker demand
- Annual revenue growth of 5.4% over the last five years was well below our standards for the software sector


F5’s quality isn’t great. Better stocks can be found in the market.
Why There Are Better Opportunities Than F5


F5 is trading at $289.32 per share, or 5x forward price-to-sales. This multiple is lower than most software companies, but for good reason.
Cheap stocks can look like a great deal at first glance, but they can be value traps. They often have less earnings power, meaning there is more reliance on a re-rating to generate good returns - an unlikely scenario for low-quality companies.
3. F5 (FFIV) Research Report: Q4 CY2025 Update
Application security provider F5 (NASDAQ:FFIV) reported revenue ahead of Wall Streets expectations in Q4 CY2025, with sales up 7.3% year on year to $822.5 million. On top of that, next quarter’s revenue guidance ($780 million at the midpoint) was surprisingly good and 4.7% above what analysts were expecting. Its non-GAAP profit of $4.45 per share was 21.9% above analysts’ consensus estimates.
F5 (FFIV) Q4 CY2025 Highlights:
- Revenue: $822.5 million vs analyst estimates of $755.7 million (7.3% year-on-year growth, 8.8% beat)
- Adjusted EPS: $4.45 vs analyst estimates of $3.65 (21.9% beat)
- Adjusted Operating Income: $313.8 million vs analyst estimates of $261.7 million (38.2% margin, 19.9% beat)
- Revenue Guidance for Q1 CY2026 is $780 million at the midpoint, above analyst estimates of $745.2 million
- Management raised its full-year Adjusted EPS guidance to $15.85 at the midpoint, a 5.7% increase
- Operating Margin: 26%, in line with the same quarter last year
- Free Cash Flow Margin: 18.2%, down from 23.7% in the previous quarter
- Billings: $884.9 million at quarter end, down 3.3% year on year
- Market Capitalization: $15.19 billion
Company Overview
Originally named after the F5 tornado, the most powerful on the meteorological scale, F5 (NASDAQ:FFIV) provides security and delivery solutions that protect applications across cloud, data center, and edge environments for large organizations.
F5's multicloud strategy addresses the complexity of modern IT landscapes where applications and data exist in multiple environments simultaneously. The company's product families include F5 Distributed Cloud Services, F5 NGINX, and F5 BIG-IP, each targeting specific needs in application security and delivery. Distributed Cloud Services offers SaaS-based solutions like Web App and API Protection (WAAP) with capabilities including web application firewalls, DDoS mitigation, and bot defense. The NGINX portfolio, built from widely-used open source software, provides lightweight solutions for modern containerized applications. BIG-IP products focus on traditional applications with comprehensive security and delivery features.
For enterprise customers managing a mix of legacy and modern applications, F5's solutions enable consistent security policies and performance optimization regardless of where applications are deployed. A financial services firm, for example, might use F5's technology to protect customer-facing banking applications from sophisticated attacks while ensuring responsive performance across global data centers and cloud environments.
F5 monetizes its technology through various models: perpetual licenses, subscriptions, usage-based consumption, and hardware systems enhanced with proprietary software. The company complements its product portfolio with services including maintenance, consulting, and technical support, operating globally with particular focus on Americas, EMEA, and APAC regions.
4. Content Delivery
The amount of content on the internet is exploding, whether it is music, movies and or e-commerce stores. Consumer demand for this content creates network congestion, much like a digital traffic jam which drives demand for specialized content delivery networks (CDN) services that alleviate potential network bottlenecks.
F5 competes with Citrix and Broadcom in application delivery, cloud providers like AWS and Google in cloud-native traffic management, and security specialists including Akamai, Cloudflare, Fortinet, and Palo Alto Networks in application security and DDoS protection.
5. Revenue Growth
A company’s long-term sales performance is one signal of its overall quality. Any business can have short-term success, but a top-tier one grows for years. Unfortunately, F5’s 5.4% annualized revenue growth over the last five years was weak. This was below our standard for the software sector and is a tough starting point for our analysis.
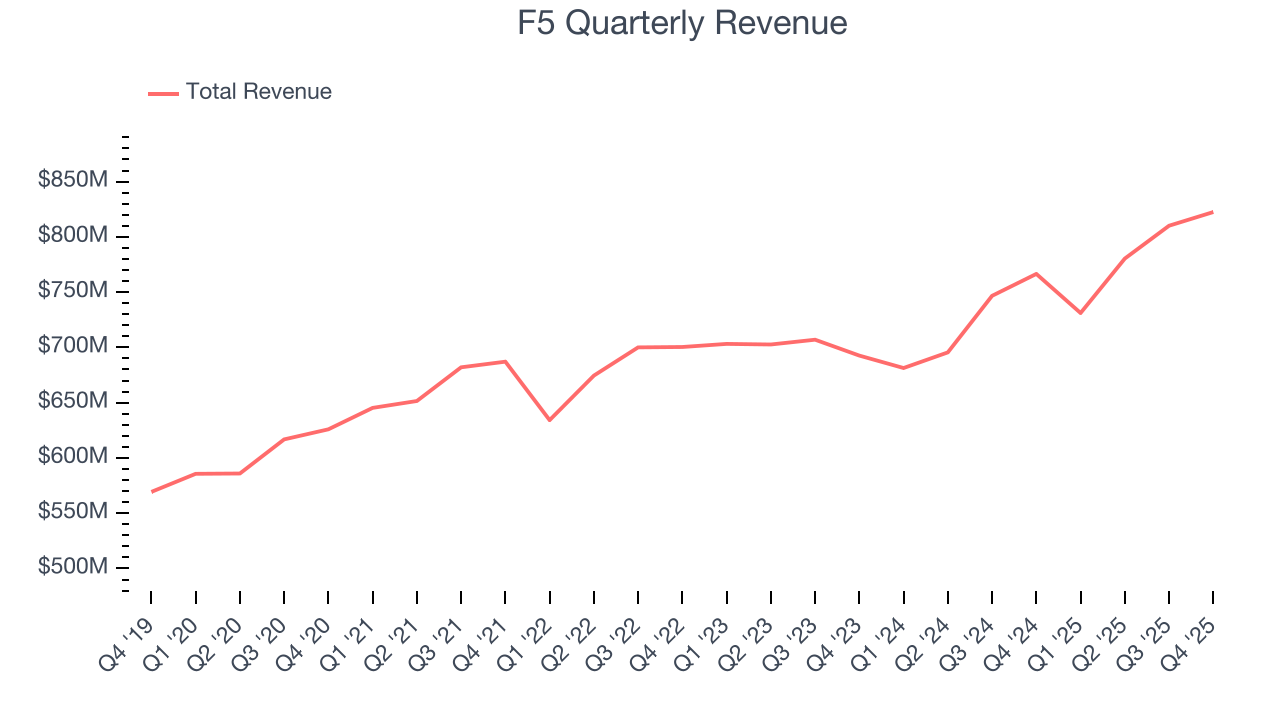
Long-term growth is the most important, but within software, a half-decade historical view may miss new innovations or demand cycles. F5’s annualized revenue growth of 5.9% over the last two years aligns with its five-year trend, suggesting its demand was consistently weak. 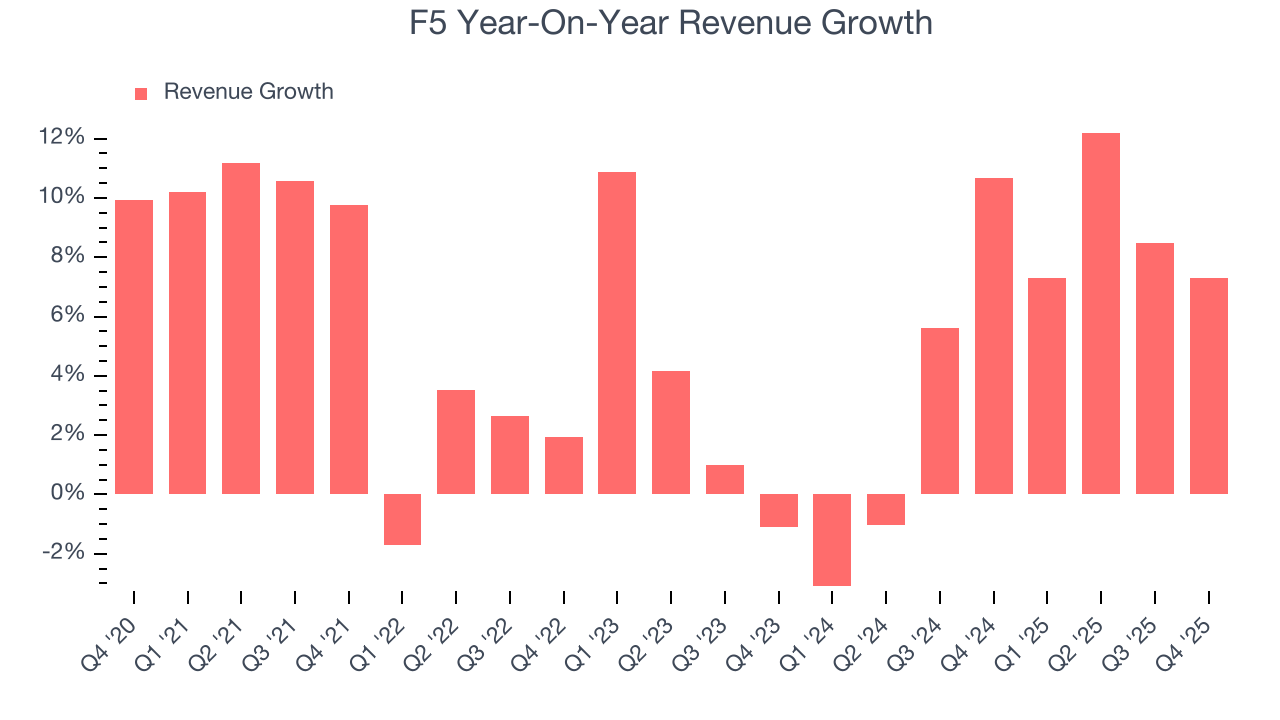
This quarter, F5 reported year-on-year revenue growth of 7.3%, and its $822.5 million of revenue exceeded Wall Street’s estimates by 8.8%. Company management is currently guiding for a 6.7% year-on-year increase in sales next quarter.
Looking further ahead, sell-side analysts expect revenue to remain flat over the next 12 months, a deceleration versus the last two years. This projection doesn't excite us and suggests its products and services will face some demand challenges.
6. Billings
Billings is a non-GAAP metric that is often called “cash revenue” because it shows how much money the company has collected from customers in a certain period. This is different from revenue, which must be recognized in pieces over the length of a contract.
F5’s billings came in at $884.9 million in Q4, and over the last four quarters, its growth was underwhelming as it averaged 9.5% year-on-year increases. This performance mirrored its total sales and suggests that increasing competition is causing challenges in acquiring/retaining customers. 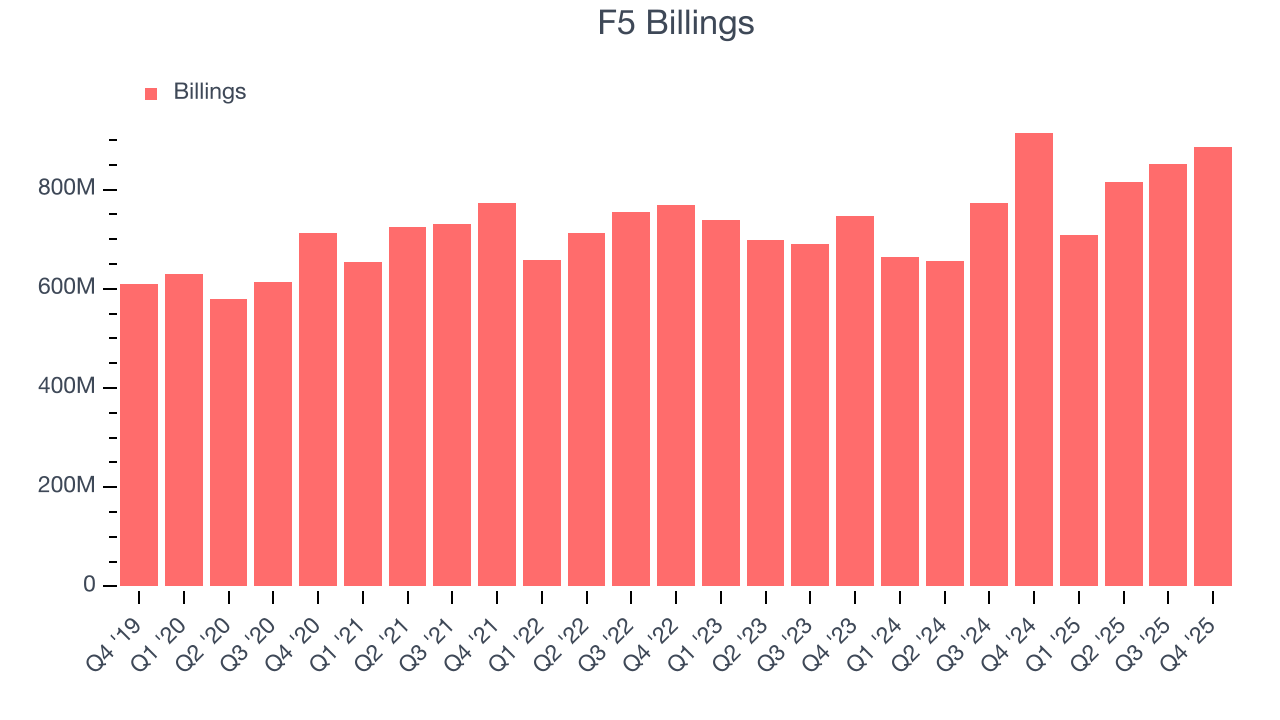
7. Customer Acquisition Efficiency
The customer acquisition cost (CAC) payback period measures the months a company needs to recoup the money spent on acquiring a new customer. This metric helps assess how quickly a business can break even on its sales and marketing investments.
F5 is extremely efficient at acquiring new customers, and its CAC payback period checked in at 21.5 months this quarter. The company’s rapid recovery of its customer acquisition costs means it can attempt to spur growth by increasing its sales and marketing investments.
8. Gross Margin & Pricing Power
For software companies like F5, gross profit tells us how much money remains after paying for the base cost of products and services (typically servers, licenses, and certain personnel). These costs are usually low as a percentage of revenue, explaining why software is more lucrative than other sectors.
F5’s robust unit economics are better than the broader software industry, an output of its asset-lite business model and pricing power. They also enable the company to fund large investments in new products and sales during periods of rapid growth to achieve higher profits in the future. As you can see below, it averaged an excellent 81.4% gross margin over the last year. That means F5 only paid its providers $18.61 for every $100 in revenue.
The market not only cares about gross margin levels but also how they change over time because expansion creates firepower for profitability and free cash generation. F5 has seen gross margins improve by 1.9 percentage points over the last 2 year, which is solid in the software space.
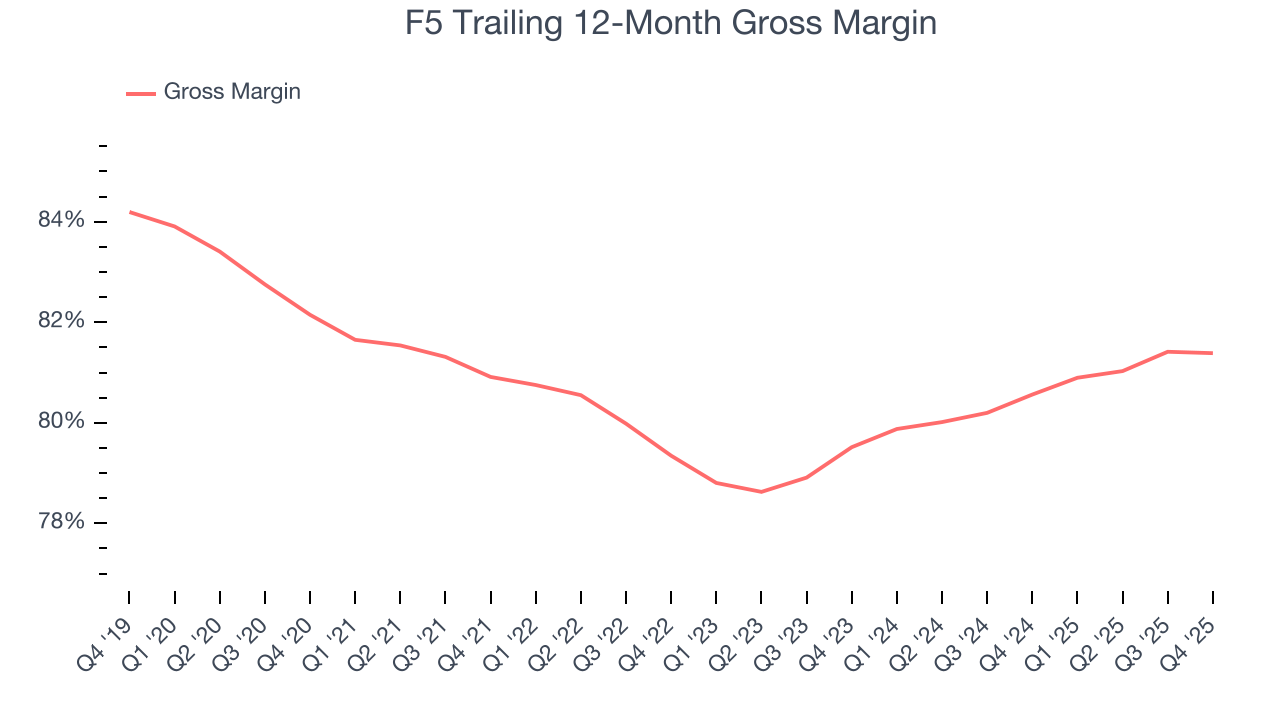
This quarter, F5’s gross profit margin was 81.5%, in line with the same quarter last year. On a wider time horizon, the company’s full-year margin has remained steady over the past four quarters, suggesting its input costs have been stable and it isn’t under pressure to lower prices.
9. Operating Margin
F5 has been a well-oiled machine over the last year. It demonstrated elite profitability for a software business, boasting an average operating margin of 24.7%. This result isn’t surprising as its high gross margin gives it a favorable starting point.
Analyzing the trend in its profitability, F5’s operating margin might fluctuated slightly but has generally stayed the same over the last two years. This raises questions about the company’s expense base because its revenue growth should have given it leverage on its fixed costs, resulting in better economies of scale and profitability.
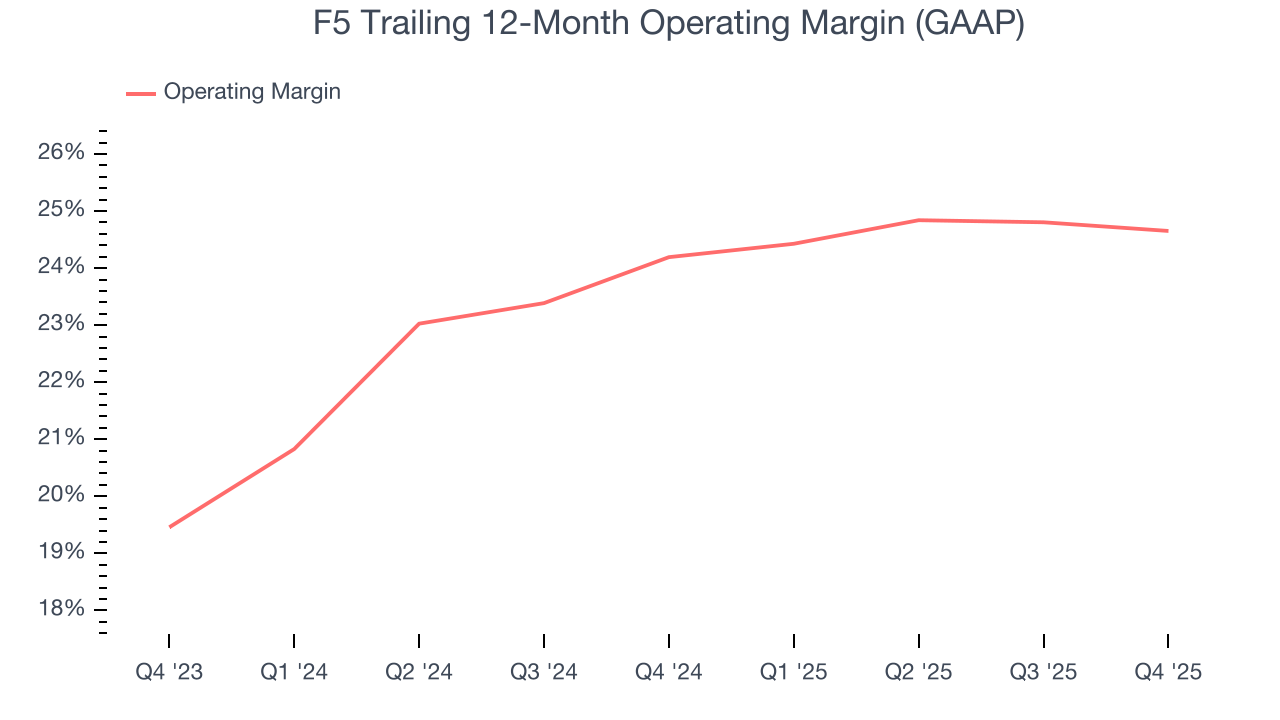
In Q4, F5 generated an operating margin profit margin of 26%, in line with the same quarter last year. This indicates the company’s cost structure has recently been stable.
10. Cash Is King
If you’ve followed StockStory for a while, you know we emphasize free cash flow. Why, you ask? We believe that in the end, cash is king, and you can’t use accounting profits to pay the bills.
F5 has shown robust cash profitability, driven by its attractive business model and cost-effective customer acquisition strategy that enable it to invest in new products and services rather than sales and marketing. The company’s free cash flow margin averaged 27.4% over the last year, quite impressive for a software business.
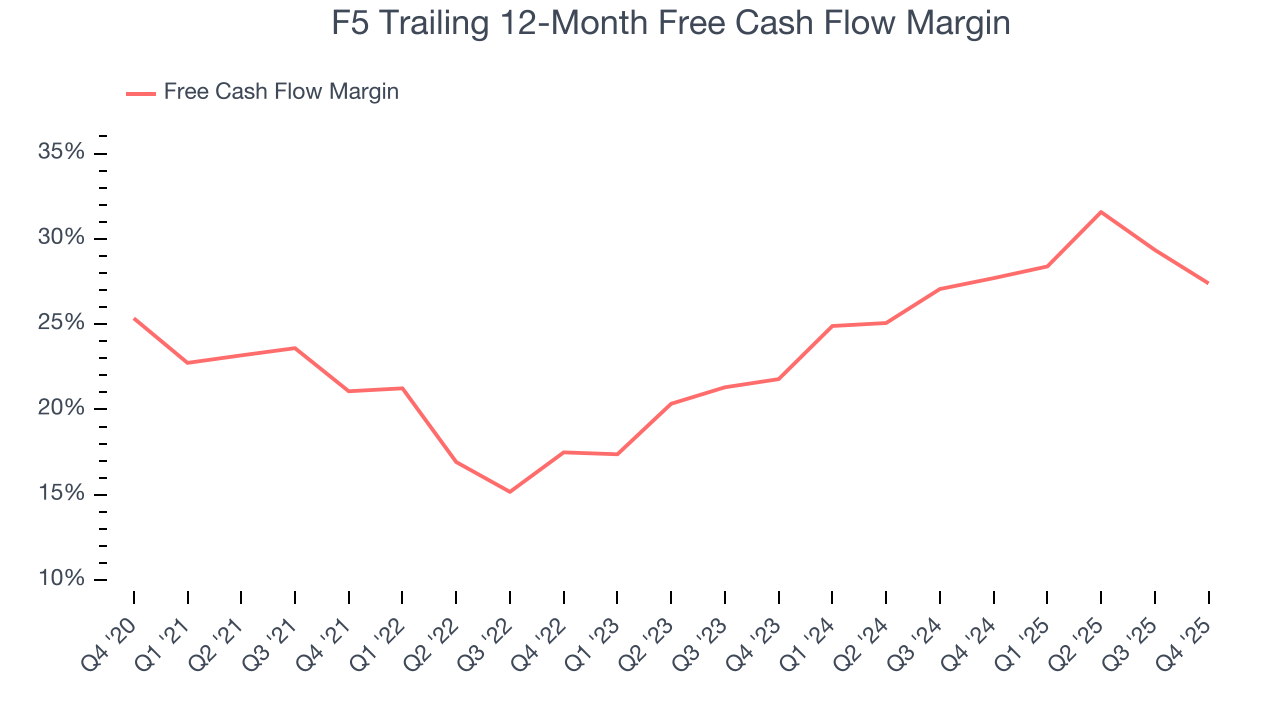
F5’s free cash flow clocked in at $149.5 million in Q4, equivalent to a 18.2% margin. The company’s cash profitability regressed as it was 7.2 percentage points lower than in the same quarter last year, prompting us to pay closer attention. Short-term fluctuations typically aren’t a big deal because investment needs can be seasonal, but we’ll be watching to see if the trend extrapolates into future quarters.
Over the next year, analysts’ consensus estimates show they’re expecting F5’s free cash flow margin of 27.4% for the last 12 months to remain the same.
11. Balance Sheet Assessment
Businesses that maintain a cash surplus face reduced bankruptcy risk.
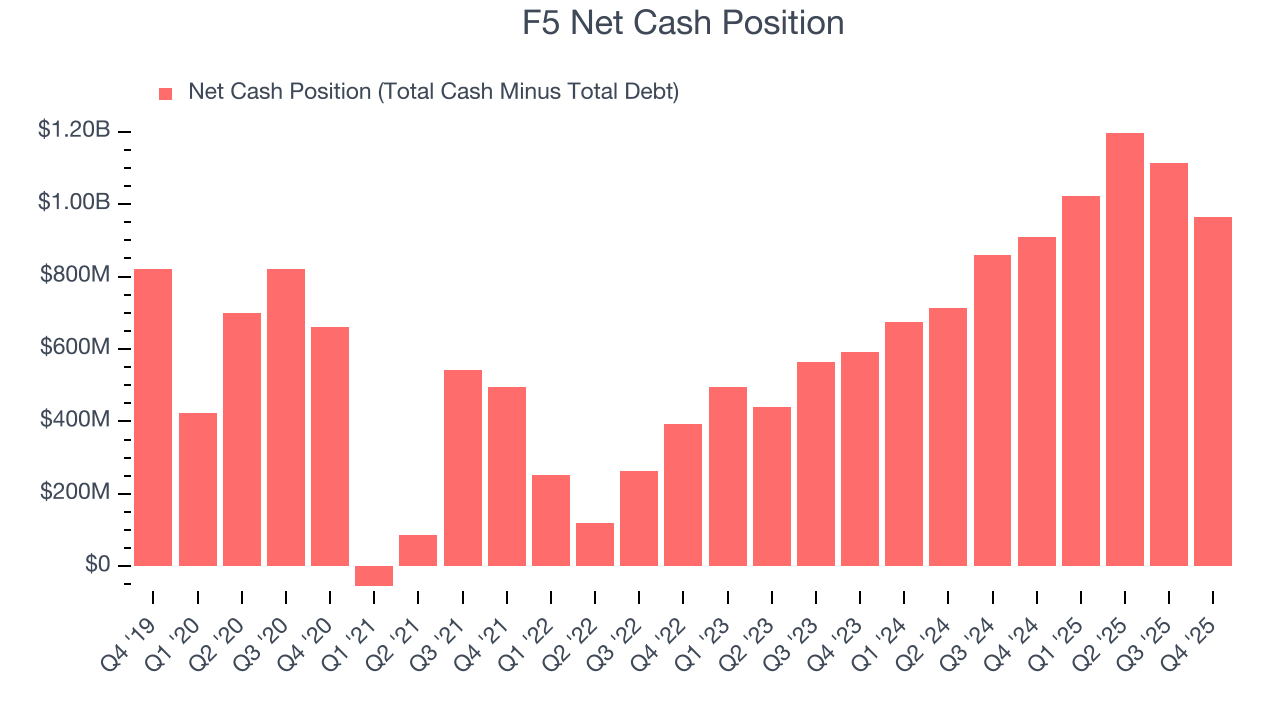
F5 is a profitable, well-capitalized company with $1.2 billion of cash and $234.9 million of debt on its balance sheet. This $964.9 million net cash position is 6.3% of its market cap and gives it the freedom to borrow money, return capital to shareholders, or invest in growth initiatives. Leverage is not an issue here.
12. Key Takeaways from F5’s Q4 Results
We were impressed by how significantly F5 blew past analysts’ billings expectations this quarter. We were also glad its full-year EPS guidance trumped Wall Street’s estimates. Zooming out, we think this quarter featured some important positives. The stock traded up 13.3% to $306.17 immediately after reporting.
13. Is Now The Time To Buy F5?
Updated: March 15, 2026 at 10:26 PM EDT
Before making an investment decision, investors should account for F5’s business fundamentals and valuation in addition to what happened in the latest quarter.
We see the value of companies addressing major business pain points, but in the case of F5, we’re out. To begin with, its revenue growth was weak over the last five years, and analysts don’t see anything changing over the next 12 months. While its impressive operating margins show it has a highly efficient business model, the downside is its ARR has disappointed and shows the company is having difficulty retaining customers and their spending. On top of that, its operating margin hasn't moved over the last year.
F5’s price-to-sales ratio based on the next 12 months is 5x. At this valuation, there’s a lot of good news priced in - we think there are better opportunities elsewhere.
Wall Street analysts have a consensus one-year price target of $310.30 on the company (compared to the current share price of $289.32).