Jack in the Box (JACK)
We wouldn’t buy Jack in the Box. Its sales have underperformed and its low returns on capital show it has few growth opportunities.― StockStory Analyst Team
1. News


2. Summary
Why We Think Jack in the Box Will Underperform
Delighting customers since its inception in 1951, Jack in the Box (NASDAQ:JACK) is a distinctive fast-food chain known for its bold flavors, innovative menu items, and quirky marketing.
- Demand is forecasted to shrink as its estimated sales for the next 12 months are flat
- Restaurant closures and disappointing same-store sales suggest demand is sluggish and it’s rightsizing its operations
- High net-debt-to-EBITDA ratio of 11× increases the risk of forced asset sales or dilutive financing if operational performance weakens


Jack in the Box doesn’t measure up to our expectations. We see more attractive opportunities in the market.
Why There Are Better Opportunities Than Jack in the Box

Jack in the Box is trading at $12.57 per share, or 3.4x forward P/E. Jack in the Box’s valuation may seem like a great deal, but we think there are valid reasons why it’s so cheap.
Cheap stocks can look like a great deal at first glance, but they can be value traps. They often have less earnings power, meaning there is more reliance on a re-rating to generate good returns - an unlikely scenario for low-quality companies.
3. Jack in the Box (JACK) Research Report: Q4 CY2025 Update
Fast-food chain Jack in the Box (NASDAQ:JACK) missed Wall Street’s revenue expectations in Q4 CY2025, with sales falling 25.5% year on year to $349.5 million. Its GAAP loss of $0.13 per share was significantly below analysts’ consensus estimates.
Jack in the Box (JACK) Q4 CY2025 Highlights:
- Revenue: $349.5 million vs analyst estimates of $367.1 million (25.5% year-on-year decline, 4.8% miss)
- EPS (GAAP): -$0.13 vs analyst estimates of $1.06 (significant miss)
- Adjusted EBITDA: $68.18 million vs analyst estimates of $69.28 million (19.5% margin, 1.6% miss)
- EBITDA guidance for the full year is $232.5 million at the midpoint, in line with analyst expectations
- Operating Margin: 13.3%, down from 15.8% in the same quarter last year
- Free Cash Flow Margin: 2.1%, down from 15% in the same quarter last year
- Locations: 2,128 at quarter end, down from 2,779 in the same quarter last year
- Same-Store Sales fell 6.7% year on year (-0.5% in the same quarter last year)
- Market Capitalization: $407.7 million
Company Overview
Delighting customers since its inception in 1951, Jack in the Box (NASDAQ:JACK) is a distinctive fast-food chain known for its bold flavors, innovative menu items, and quirky marketing.
The company was founded by Robert Peterson, who previously ran a chain of drive-in diners called “Topsy’s”. Seeking to improve its operations, Robert experimented by installing two-way intercom devices into its parking lots so that cars could communicate more efficiently with staff. These test locations were named “Jack in the Box”, and the modern-day “drive-thru” concept was born.
Jack in the Box offers a diverse selection of burgers, sandwiches, tacos, and much more, providing an exciting dining experience for guests of all ages. The company's commitment to culinary creativity is evident in its ever-evolving menu, which showcases a mix of classic favorites such as the Jumbo Jack and inventive new offerings like the Munchie Meal, which at one point was only available between the hours of 9pm and 5am.
Beyond its eclectic menu, Jack in the Box is known for its playful and humorous marketing campaigns featuring the iconic Jack Box character. This witty and often irreverent mascot adds a unique touch to the brand.
Like most fast-food chains, customers can enjoy their meals via a convenient drive-thru (which Jack in the Box pioneered) or comfy indoor seating.
4. Traditional Fast Food
Traditional fast-food restaurants are renowned for their speed and convenience, boasting menus filled with familiar and budget-friendly items. Their reputations for on-the-go consumption make them favored destinations for individuals and families needing a quick meal. This class of restaurants, however, is fighting the perception that their meals are unhealthy and made with inferior ingredients, a battle that's especially relevant today given the consumers increasing focus on health and wellness.
Fast-food competitors include Burger King and Popeyes (owned by Restaurant Brands, NYSE:QSR), McDonald’s (NYSE:MCD), Wendy’s (NASDAQ:WEN), and Taco Bell and KFC (owned by Yum! Brands, NYSE:YUM).
5. Revenue Growth
Examining a company’s long-term performance can provide clues about its quality. Even a bad business can shine for one or two quarters, but a top-tier one grows for years.
With $1.35 billion in revenue over the past 12 months, Jack in the Box is a mid-sized restaurant chain, which sometimes brings disadvantages compared to larger competitors benefiting from better brand awareness and economies of scale.
As you can see below, Jack in the Box grew its sales at a tepid 5.7% compounded annual growth rate over the last six years as it closed restaurants.
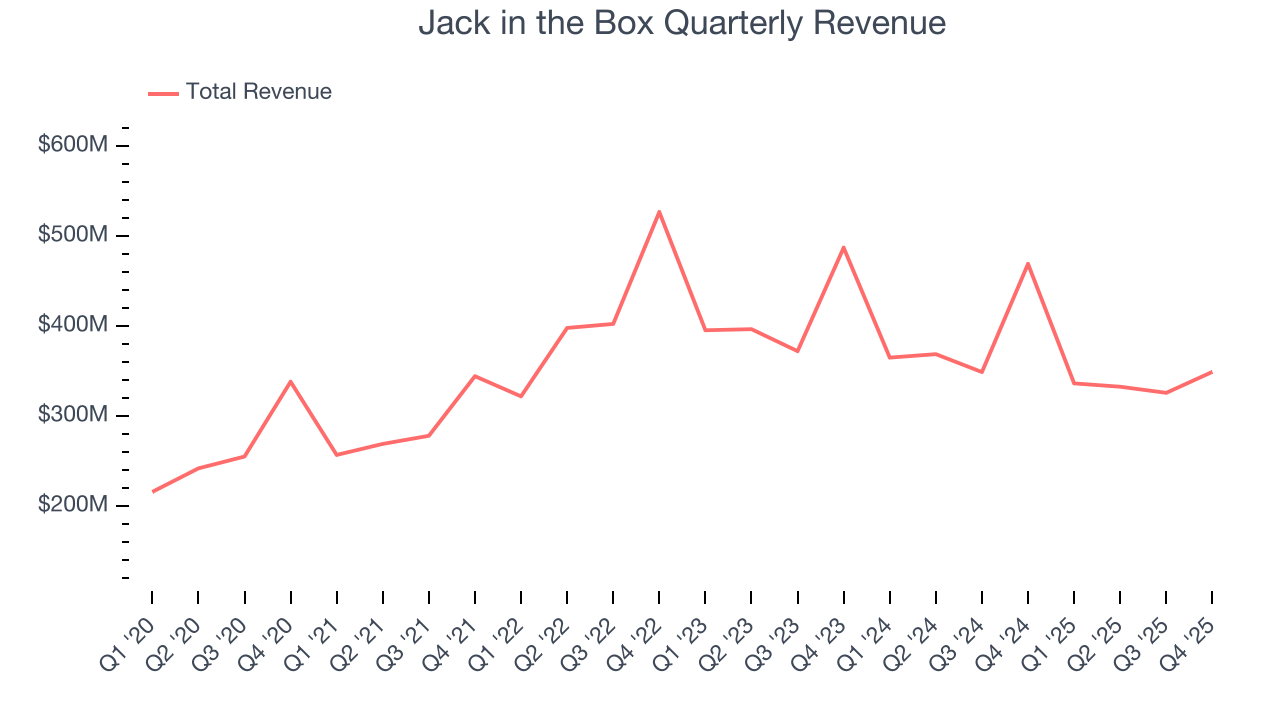
This quarter, Jack in the Box missed Wall Street’s estimates and reported a rather uninspiring 25.5% year-on-year revenue decline, generating $349.5 million of revenue.
Looking ahead, sell-side analysts expect revenue to decline by 16.2% over the next 12 months, a deceleration versus the last six years. This projection is underwhelming and suggests its menu offerings will see some demand headwinds.
6. Restaurant Performance
Number of Restaurants
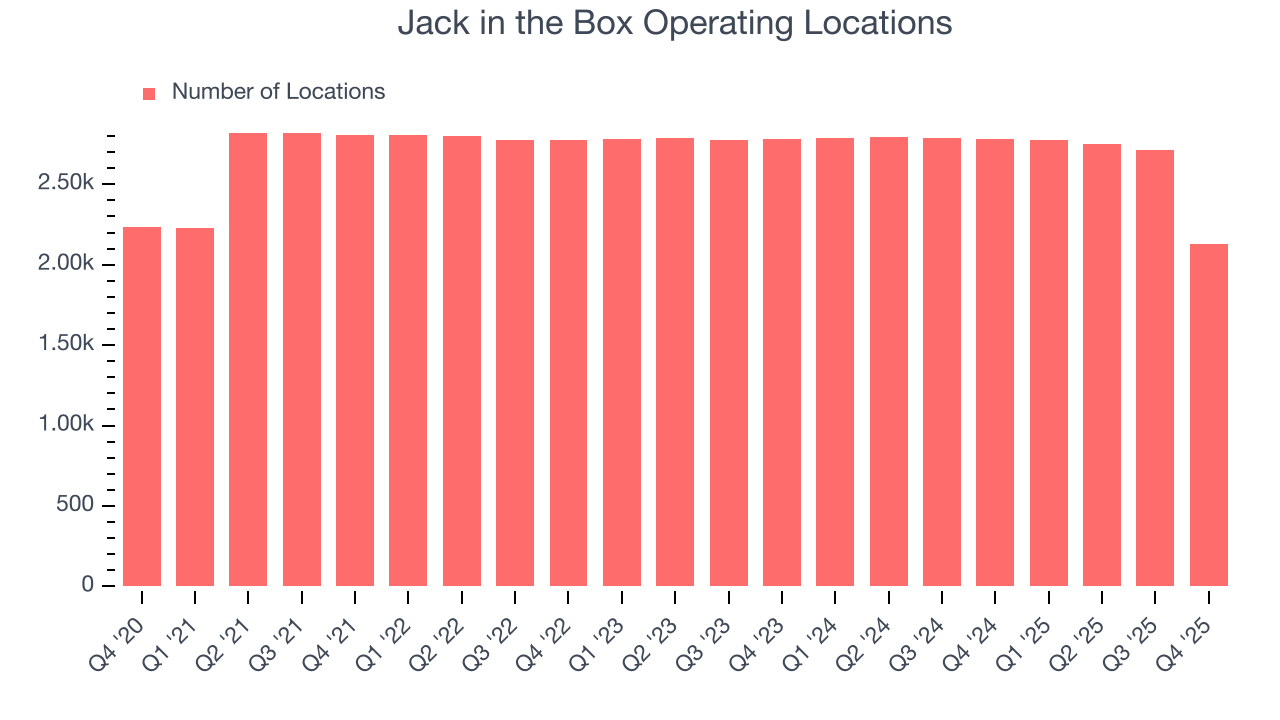
Jack in the Box listed 2,128 locations in the latest quarter and has generally closed its restaurants over the last two years, averaging 3.4% annual declines.
When a chain shutters restaurants, it usually means demand for its meals is waning, and it is responding by closing underperforming locations to improve profitability.
Same-Store Sales
A company's restaurant base only paints one part of the picture. When demand is high, it makes sense to open more. But when demand is low, it’s prudent to close some locations and use the money in other ways. Same-store sales gives us insight into this topic because it measures organic growth at restaurants open for at least a year.
Jack in the Box’s demand has been shrinking over the last two years as its same-store sales have averaged 4% annual declines. This performance isn’t ideal, and Jack in the Box is attempting to boost same-store sales by closing restaurants (fewer locations sometimes lead to higher same-store sales).
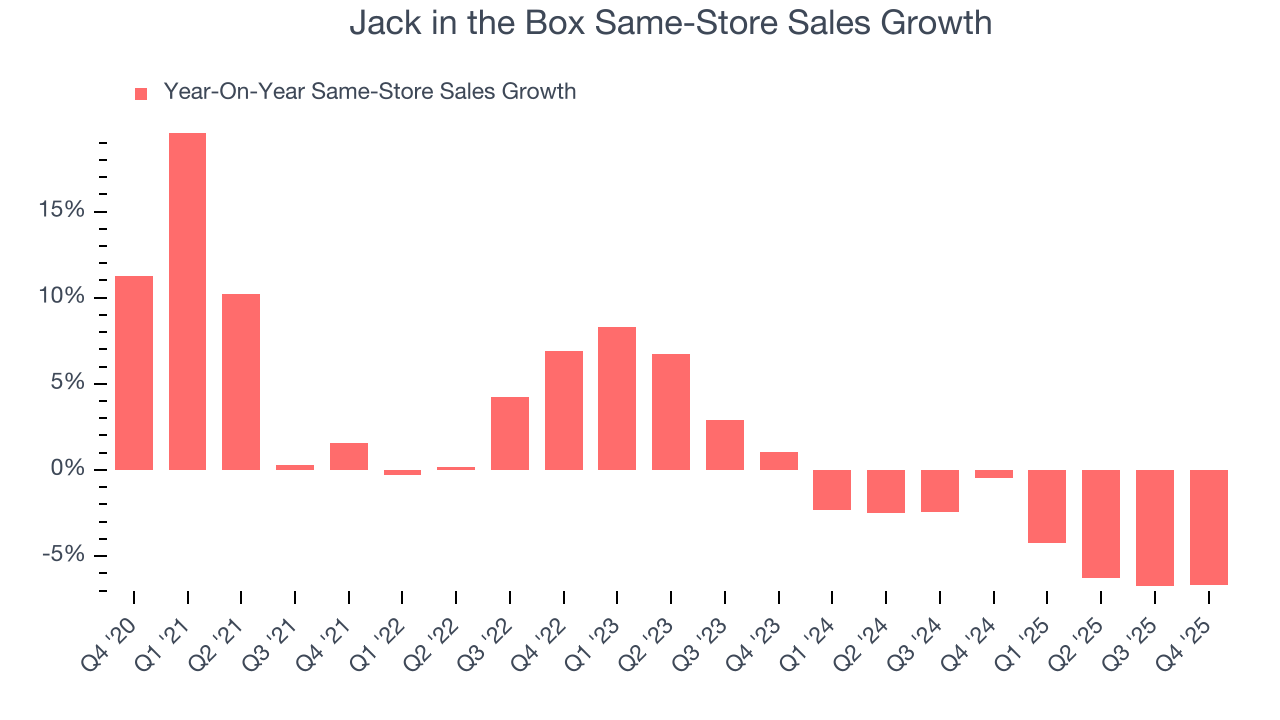
In the latest quarter, Jack in the Box’s same-store sales fell by 6.7% year on year. This decrease represents a further deceleration from its historical levels. We hope the business can get back on track.
7. Gross Margin & Pricing Power
We prefer higher gross margins because they not only make it easier to generate more operating profits but also indicate pricing power and differentiation, whether it be the dining experience or quality and taste of food.
Jack in the Box’s unit economics are higher than the typical restaurant company, giving it the flexibility to invest in areas such as marketing and talent to reach more consumers. As you can see below, it averaged a decent 29.1% gross margin over the last two years. Said differently, Jack in the Box paid its suppliers $70.90 for every $100 in revenue. 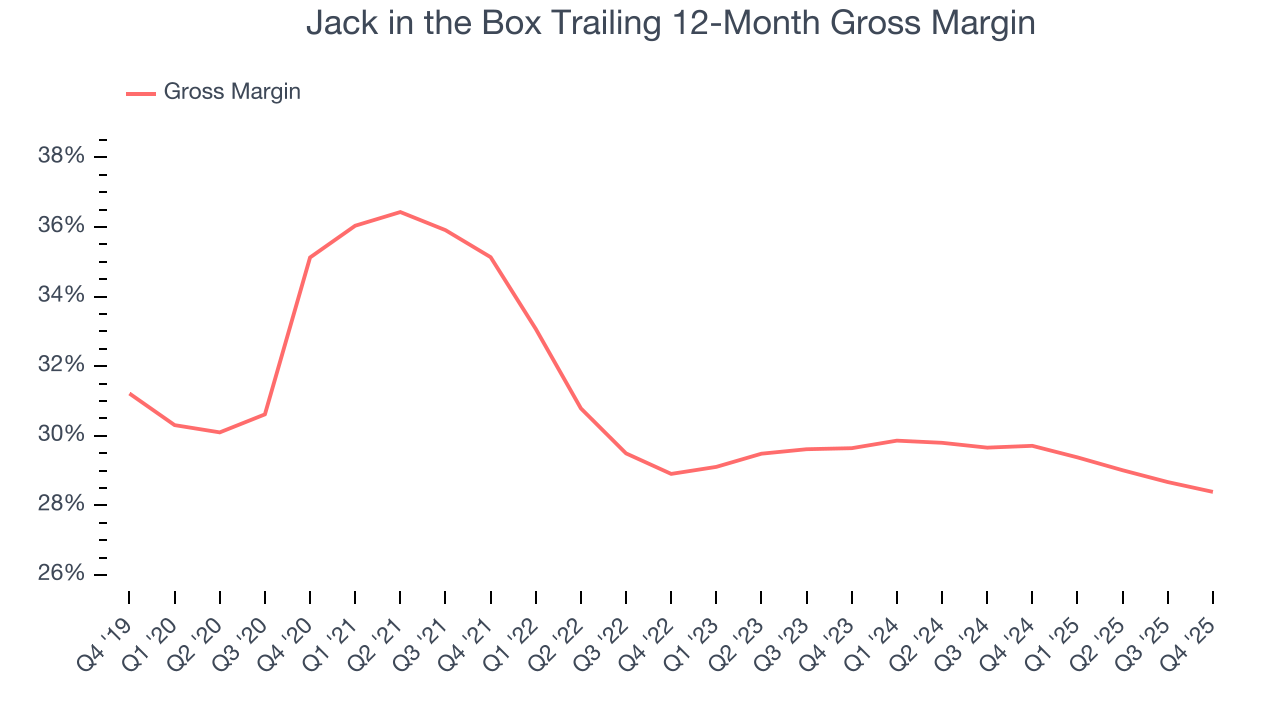
This quarter, Jack in the Box’s gross profit margin was 30.1%, in line with the same quarter last year. Zooming out, Jack in the Box’s full-year margin has been trending down over the past 12 months, decreasing by 1.3 percentage points. If this move continues, it could suggest a more competitive environment with some pressure to lower prices and higher input costs (such as ingredients and transportation expenses).
8. Operating Margin
Jack in the Box was profitable over the last two years but held back by its large cost base. Its average operating margin of 1.1% was weak for a restaurant business.
Looking at the trend in its profitability, Jack in the Box’s operating margin decreased by 8.4 percentage points over the last year. This raises questions about the company’s expense base because its revenue growth should have given it leverage on its fixed costs, resulting in better economies of scale and profitability. Jack in the Box’s performance was poor no matter how you look at it - it shows that costs were rising and it couldn’t pass them onto its customers.
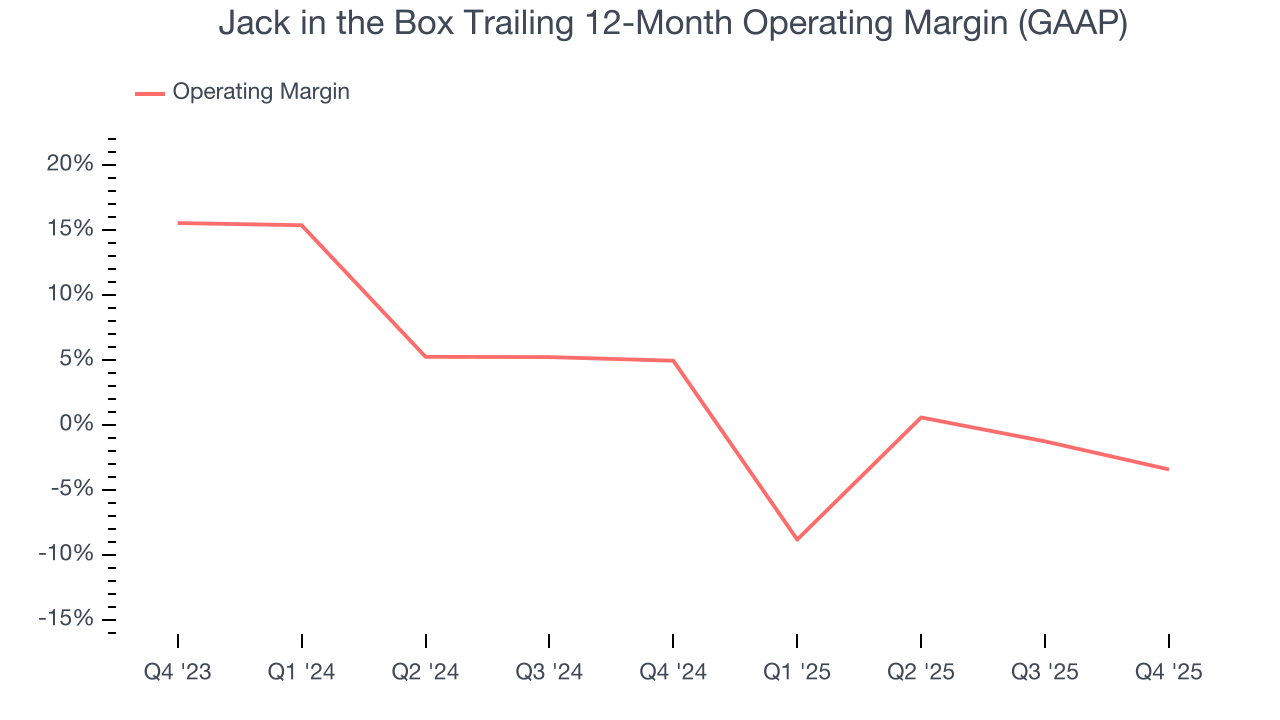
This quarter, Jack in the Box generated an operating margin profit margin of 13.3%, down 2.5 percentage points year on year. Since Jack in the Box’s operating margin decreased more than its gross margin, we can assume it was less efficient because expenses such as marketing, and administrative overhead increased.
9. Earnings Per Share
Revenue trends explain a company’s historical growth, but the long-term change in earnings per share (EPS) points to the profitability of that growth – for example, a company could inflate its sales through excessive spending on advertising and promotions.
Sadly for Jack in the Box, its EPS declined by 27.5% annually over the last six years while its revenue grew by 5.7%. This tells us the company became less profitable on a per-share basis as it expanded due to non-fundamental factors such as interest expenses and taxes.
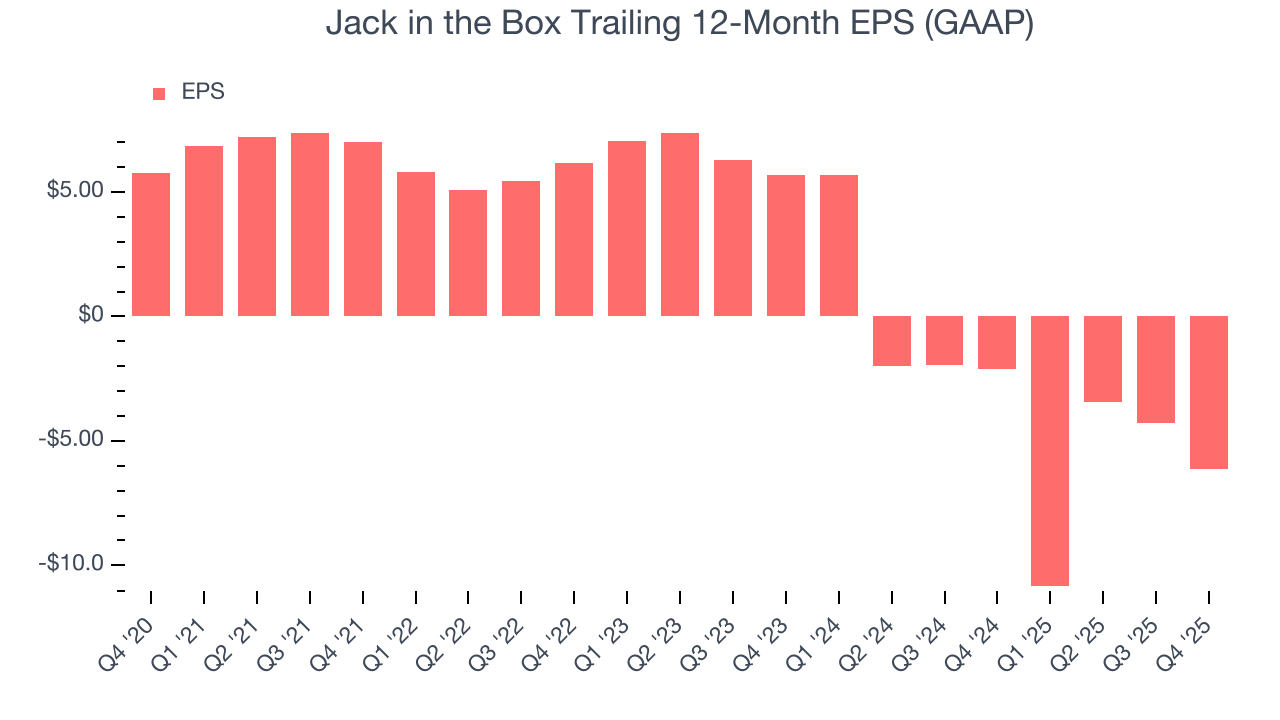
In Q4, Jack in the Box reported EPS of negative $0.13, down from $1.75 in the same quarter last year. This print missed analysts’ estimates. Over the next 12 months, Wall Street is optimistic. Analysts forecast Jack in the Box’s full-year EPS of negative $6.15 will flip to positive $3.75.
10. Cash Is King
Although earnings are undoubtedly valuable for assessing company performance, we believe cash is king because you can’t use accounting profits to pay the bills.
Jack in the Box has shown decent cash profitability, giving it some flexibility to reinvest or return capital to investors. The company’s free cash flow margin averaged 3.3% over the last two years, slightly better than the broader restaurant sector.
Taking a step back, we can see that Jack in the Box’s margin dropped by 4.7 percentage points over the last year. This decrease warrants extra caution because Jack in the Box failed to grow its same-store sales. Its cash profitability could decay further if it tries to reignite growth by opening new restaurants.
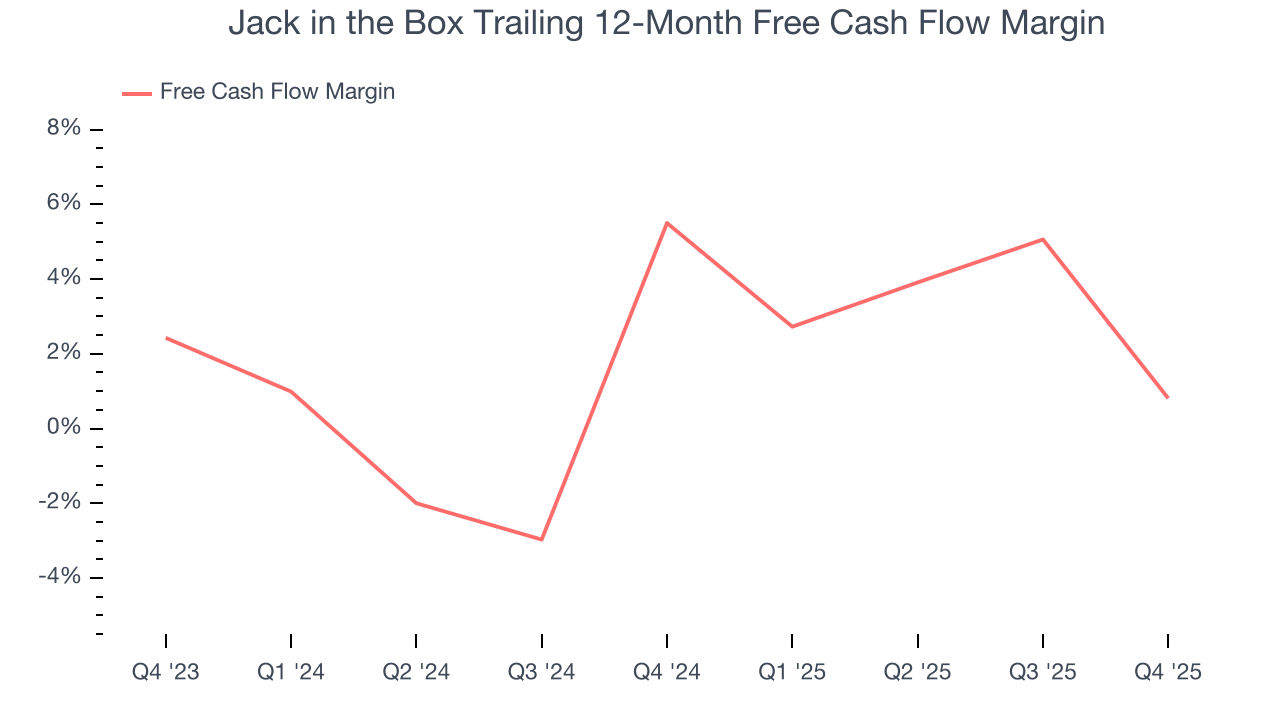
Jack in the Box’s free cash flow clocked in at $7.33 million in Q4, equivalent to a 2.1% margin. The company’s cash profitability regressed as it was 12.9 percentage points lower than in the same quarter last year, suggesting its historical struggles have dragged on.
11. Return on Invested Capital (ROIC)
EPS and free cash flow tell us whether a company was profitable while growing its revenue. But was it capital-efficient? A company’s ROIC explains this by showing how much operating profit it makes compared to the money it has raised (debt and equity).
Jack in the Box historically did a mediocre job investing in profitable growth initiatives. Its five-year average ROIC was 6.6%, somewhat low compared to the best restaurant companies that consistently pump out 15%+.
12. Balance Sheet Risk
Debt is a tool that can boost company returns but presents risks if used irresponsibly. As long-term investors, we aim to avoid companies taking excessive advantage of this instrument because it could lead to insolvency.
Jack in the Box’s $2.63 billion of debt exceeds the $99.37 million of cash on its balance sheet. Furthermore, its 10× net-debt-to-EBITDA ratio (based on its EBITDA of $241.9 million over the last 12 months) shows the company is overleveraged.
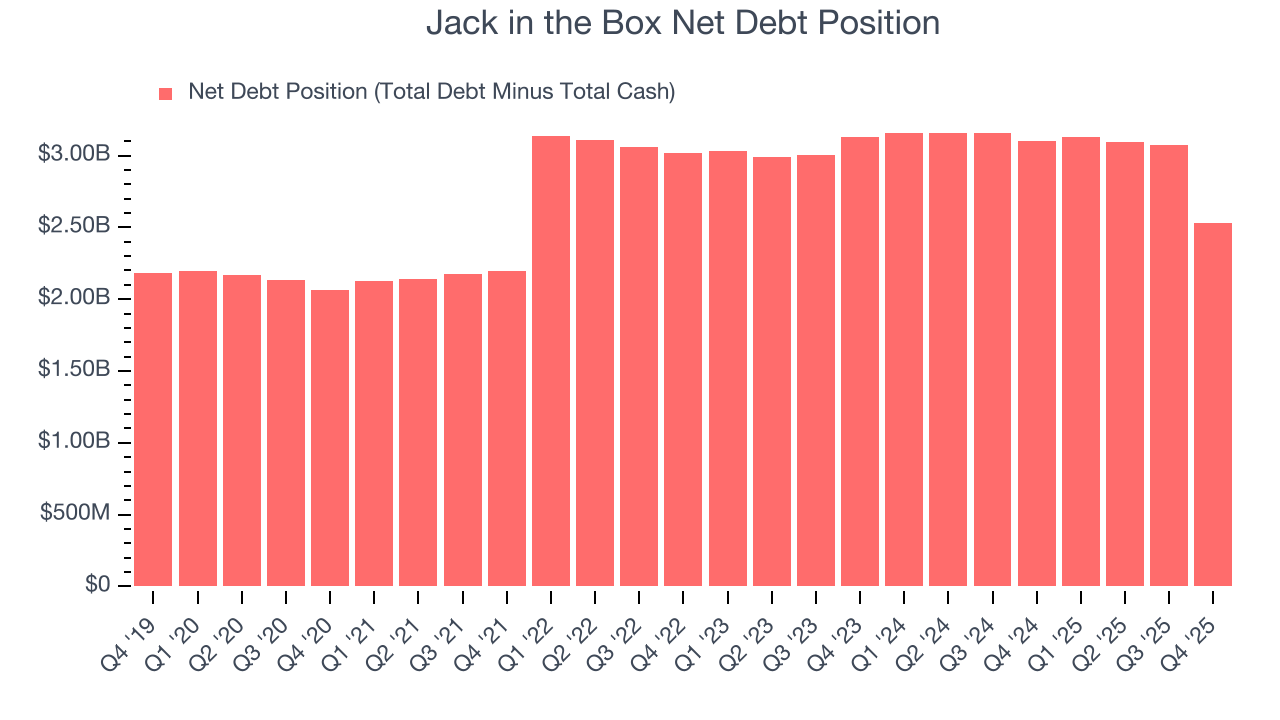
At this level of debt, incremental borrowing becomes increasingly expensive and credit agencies could downgrade the company’s rating if profitability falls. Jack in the Box could also be backed into a corner if the market turns unexpectedly – a situation we seek to avoid as investors in high-quality companies.
We hope Jack in the Box can improve its balance sheet and remain cautious until it increases its profitability or pays down its debt.
13. Key Takeaways from Jack in the Box’s Q4 Results
It was good to see Jack in the Box provide full-year EBITDA guidance that slightly beat analysts’ expectations. On the other hand, its revenue missed and its EPS fell short of Wall Street’s estimates. Overall, this was a weaker quarter. The stock traded down 3.5% to $21.26 immediately following the results.
14. Is Now The Time To Buy Jack in the Box?
Updated: March 14, 2026 at 10:44 PM EDT
We think that the latest earnings result is only one piece of the bigger puzzle. If you’re deciding whether to own Jack in the Box, you should also grasp the company’s longer-term business quality and valuation.
Jack in the Box falls short of our quality standards. To kick things off, its revenue growth was weak over the last six years, and analysts expect its demand to deteriorate over the next 12 months. On top of that, Jack in the Box’s shrinking same-store sales tell us it will need to change its strategy to succeed, and its falling restaurant base has made it challenging to grow revenue.
Jack in the Box’s P/E ratio based on the next 12 months is 3.4x. While this valuation is optically cheap, the potential downside is huge given its shaky fundamentals. There are more exciting stocks to buy at the moment.
Wall Street analysts have a consensus one-year price target of $23.44 on the company (compared to the current share price of $12.57).
Although the price target is bullish, readers should exercise caution because analysts tend to be overly optimistic. The firms they work for, often big banks, have relationships with companies that extend into fundraising, M&A advisory, and other rewarding business lines. As a result, they typically hesitate to say bad things for fear they will lose out. We at StockStory do not suffer from such conflicts of interest, so we’ll always tell it like it is.