
Transcat (TRNS)
We aren’t fans of Transcat. Its sales have underperformed and its low returns on capital show it has few growth opportunities.― StockStory Analyst Team
1. News


2. Summary
Why We Think Transcat Will Underperform
Serving the pharmaceutical, industrial manufacturing, energy, and chemical process industries, Transcat (NASDAQ:TRNS) provides measurement instruments and supplies.
- ROIC of 7.8% reflects management’s challenges in identifying attractive investment opportunities, and its shrinking returns suggest its past profit sources are losing steam
- Subpar operating margin constrains its ability to invest in process improvements or effectively respond to new competitive threats
- On the plus side, its impressive 13.4% annual revenue growth over the last five years indicates it’s winning market share this cycle


Transcat falls below our quality standards. We’re redirecting our focus to better businesses.
Why There Are Better Opportunities Than Transcat


Transcat’s stock price of $73.83 implies a valuation ratio of 37.5x forward P/E. This multiple is higher than that of industrials peers; it’s also rich for the business quality. Not a great combination.
We prefer to invest in similarly-priced but higher-quality companies with superior earnings growth.
3. Transcat (TRNS) Research Report: Q4 CY2025 Update
Measurement equipment distributor Transcat (NASDAQ:TRNS) announced better-than-expected revenue in Q4 CY2025, with sales up 25.6% year on year to $83.86 million. Its non-GAAP profit of $0.26 per share was 17.5% below analysts’ consensus estimates.
Transcat (TRNS) Q4 CY2025 Highlights:
- Revenue: $83.86 million vs analyst estimates of $80.58 million (25.6% year-on-year growth, 4.1% beat)
- Adjusted EPS: $0.26 vs analyst expectations of $0.32 (17.5% miss)
- Adjusted EBITDA: $10.07 million vs analyst estimates of $10.78 million (12% margin, 6.6% miss)
- Operating Margin: 0.1%, down from 4.3% in the same quarter last year
- Free Cash Flow Margin: 11.3%, down from 14.6% in the same quarter last year
- Market Capitalization: $588.2 million
Company Overview
Serving the pharmaceutical, industrial manufacturing, energy, and chemical process industries, Transcat (NASDAQ:TRNS) provides measurement instruments and supplies.
The company was founded in 1964 under the name Transmation, a designer and manufacturer of industrial-grade calibration and testing equipment. Throughout its life, the company broadened its scope by acquiring various businesses including Transcat (its current name) in 1982, which originally served as its distribution arm.
Today, Transcat continues to pursue an acquisitive strategy, primarily targeting small businesses (it has made 30+ acquisitions since 2005). Its most important deal in recent history was its acquisition of NEXA in 2021, a services provider that helps calibrate, inspect, and repair equipment. This deal was critical to executing Transcat’s growth strategy, which is to evolve from a distributor to a more recurring and predictable services business.
On the distribution side, Transcat sells and rents new and refurbished instruments for calibration, testing, measurement, and industrial process monitoring. While the company primarily sells and rents to the life sciences, aerospace, and defense industries, its product lines include everything from multimeters used to measure voltage to centrifuges that separate different densities in a sample by spinning at higher speeds.
Many of Transcat’s products require servicing, such as repair, inspection, and preventative maintenance. This segment provides ancillary revenue streams for the company that are less transactional and one-off than its distribution business. It serves its clients by going to their facilities on a scheduled or as-needed basis while also offering equipment pick-up and delivery services.
4. Maintenance and Repair Distributors
Supply chain and inventory management are themes that grew in focus after COVID wreaked havoc on the global movement of raw materials and components. Maintenance and repair distributors that boast reliable selection and quickly deliver products to customers can benefit from this theme. While e-commerce hasn’t disrupted industrial distribution as much as consumer retail, it is still a real threat, forcing investment in omnichannel capabilities to serve customers everywhere. Additionally, maintenance and repair distributors are at the whim of economic cycles that impact the capital spending and construction projects that can juice demand.
Competitors offering similar products include Keysight (NYSE:KEYS), Ametek (NYSE:AME), and Fortive (NYSE:FTV).
5. Revenue Growth
A company’s long-term sales performance can indicate its overall quality. Any business can experience short-term success, but top-performing ones enjoy sustained growth for years. Thankfully, Transcat’s 13.4% annualized revenue growth over the last five years was excellent. Its growth beat the average industrials company and shows its offerings resonate with customers.
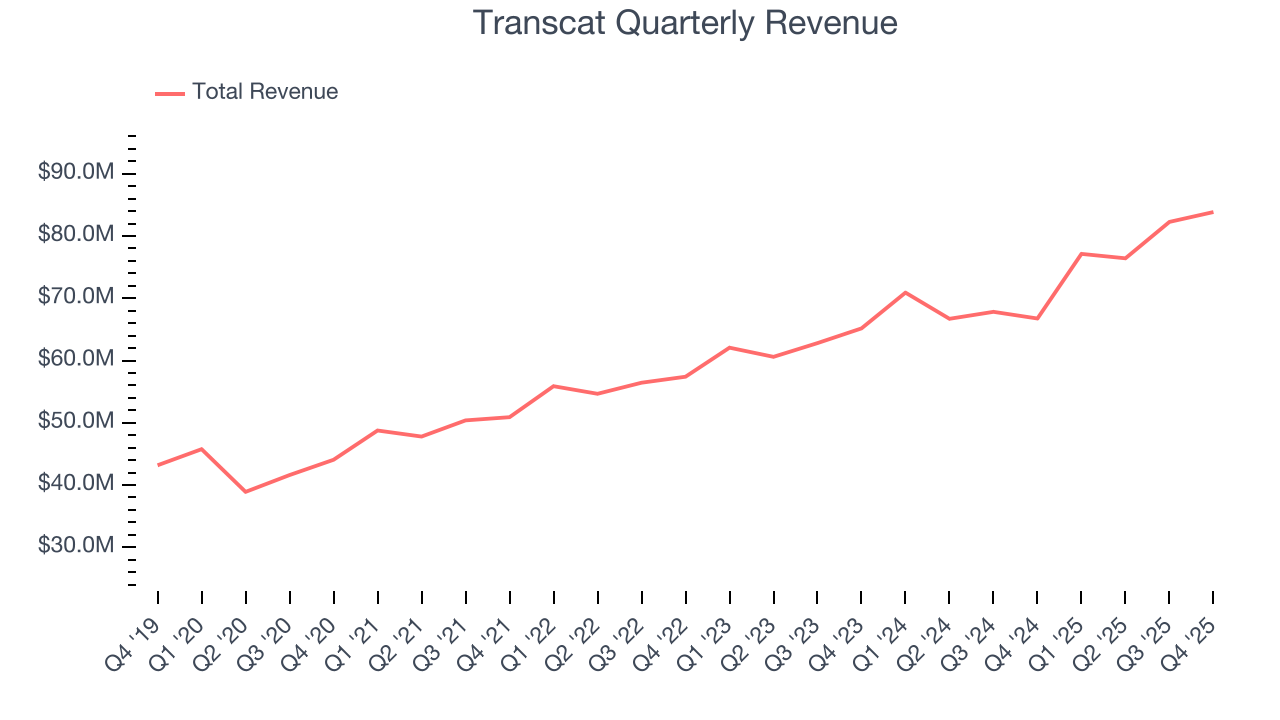
We at StockStory place the most emphasis on long-term growth, but within industrials, a half-decade historical view may miss cycles, industry trends, or a company capitalizing on catalysts such as a new contract win or a successful product line. Transcat’s annualized revenue growth of 12.9% over the last two years aligns with its five-year trend, suggesting its demand was predictably strong. 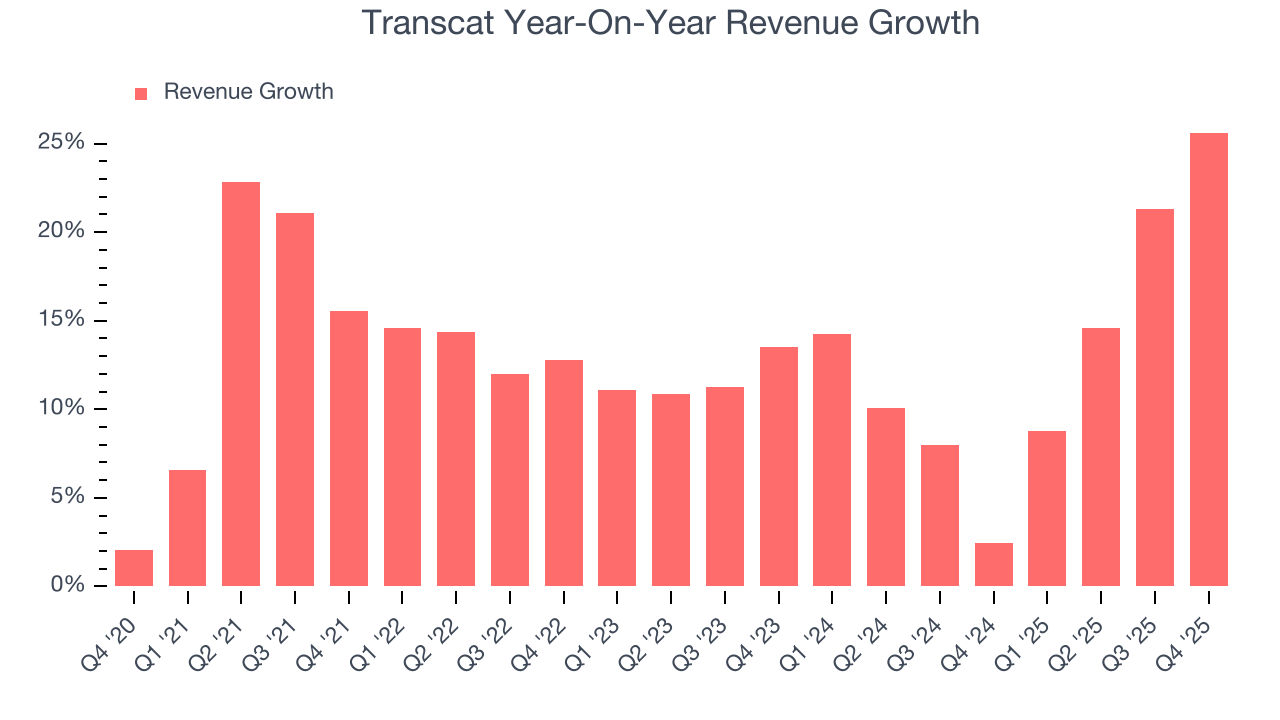
This quarter, Transcat reported robust year-on-year revenue growth of 25.6%, and its $83.86 million of revenue topped Wall Street estimates by 4.1%.
Looking ahead, sell-side analysts expect revenue to grow 8.5% over the next 12 months, a deceleration versus the last two years. Still, this projection is above average for the sector and indicates the market is forecasting some success for its newer products and services.
6. Gross Margin & Pricing Power
All else equal, we prefer higher gross margins because they usually indicate that a company sells more differentiated products and commands stronger pricing power.
Transcat’s unit economics are better than the typical industrials business, signaling its products are somewhat differentiated through quality or brand.As you can see below, it averaged a decent 31% gross margin over the last five years. Said differently, Transcat paid its suppliers $69.02 for every $100 in revenue. 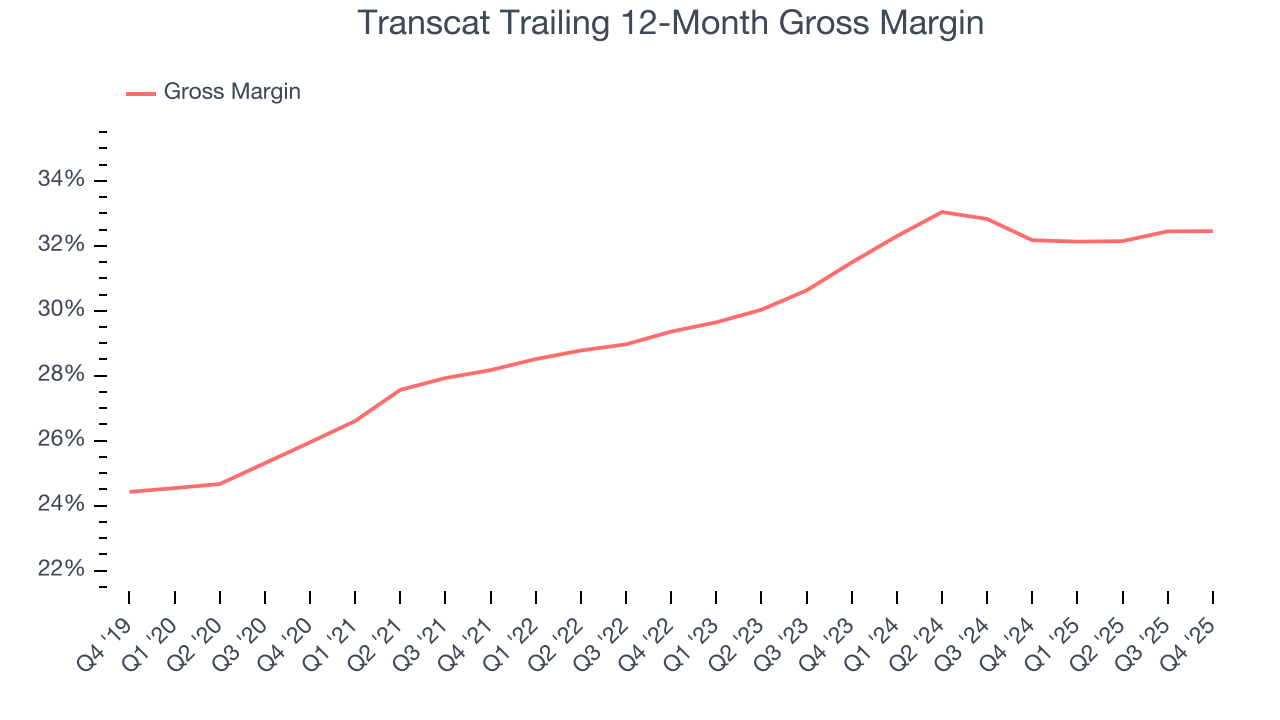
This quarter, Transcat’s gross profit margin was 30.1%, in line with the same quarter last year. On a wider time horizon, the company’s full-year margin has remained steady over the past four quarters, suggesting its input costs (such as raw materials and manufacturing expenses) have been stable and it isn’t under pressure to lower prices.
7. Operating Margin
Transcat was profitable over the last five years but held back by its large cost base. Its average operating margin of 6.5% was weak for an industrials business.
Looking at the trend in its profitability, Transcat’s operating margin decreased by 3.4 percentage points over the last five years. This raises questions about the company’s expense base because its revenue growth should have given it leverage on its fixed costs, resulting in better economies of scale and profitability. Transcat’s performance was poor no matter how you look at it - it shows that costs were rising and it couldn’t pass them onto its customers.
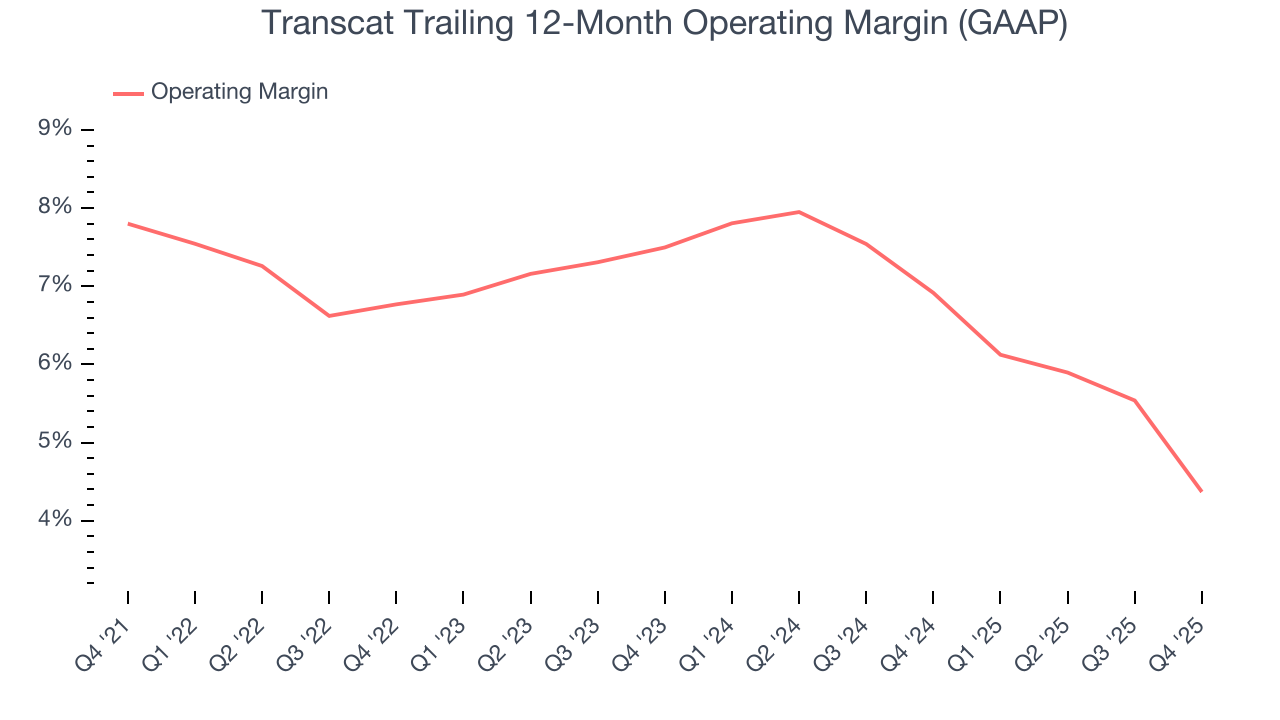
In Q4, Transcat’s breakeven margin was down 4.2 percentage points year on year. Since Transcat’s operating margin decreased more than its gross margin, we can assume it was less efficient because expenses such as marketing, R&D, and administrative overhead increased.
8. Earnings Per Share
We track the long-term change in earnings per share (EPS) for the same reason as long-term revenue growth. Compared to revenue, however, EPS highlights whether a company’s growth is profitable.
Transcat’s remarkable 14.2% annual EPS growth over the last five years aligns with its revenue performance. This tells us it maintained its per-share profitability as it expanded.
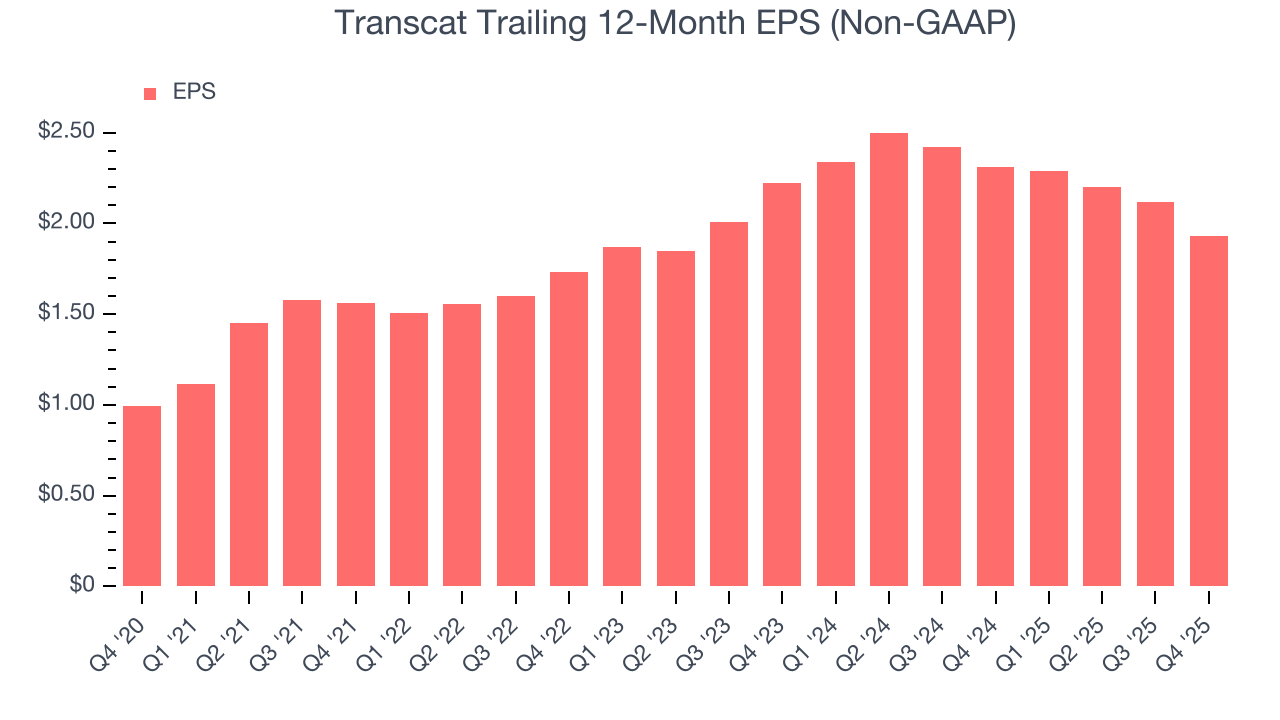
Like with revenue, we analyze EPS over a more recent period because it can provide insight into an emerging theme or development for the business.
Transcat’s two-year annual EPS declines of 6.8% were bad and lower than its 12.9% two-year revenue growth.
We can take a deeper look into Transcat’s earnings to better understand the drivers of its performance. Transcat’s operating margin has declined over the last two yearswhile its share count has grown 6.6%. This means the company not only became less efficient with its operating expenses but also diluted its shareholders. 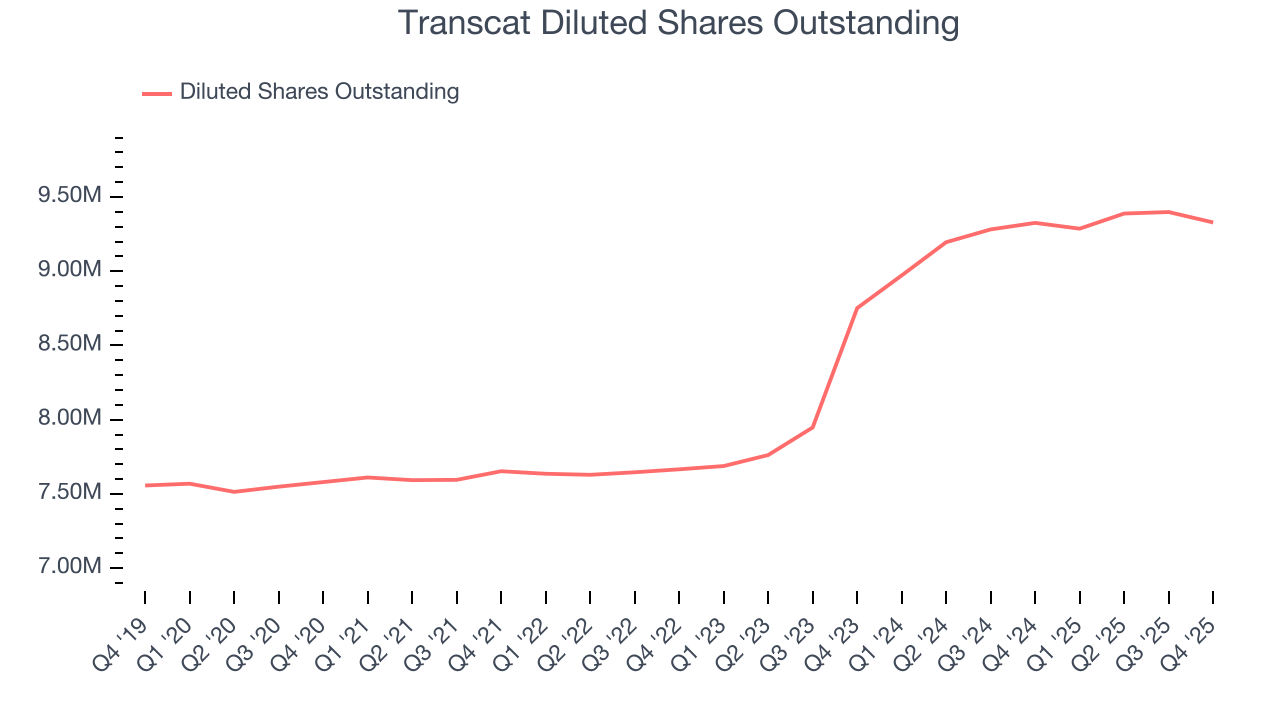
In Q4, Transcat reported adjusted EPS of $0.26, down from $0.45 in the same quarter last year. This print missed analysts’ estimates, but we care more about long-term adjusted EPS growth than short-term movements. Over the next 12 months, Wall Street expects Transcat’s full-year EPS of $1.93 to grow 12.2%.
9. Cash Is King
Although earnings are undoubtedly valuable for assessing company performance, we believe cash is king because you can’t use accounting profits to pay the bills.
Transcat has shown decent cash profitability, giving it some flexibility to reinvest or return capital to investors. The company’s free cash flow margin averaged 6.5% over the last five years, slightly better than the broader industrials sector.
Taking a step back, we can see that Transcat’s margin expanded by 1.6 percentage points during that time. This shows the company is heading in the right direction, and we can see it became a less capital-intensive business because its free cash flow profitability rose while its operating profitability fell.
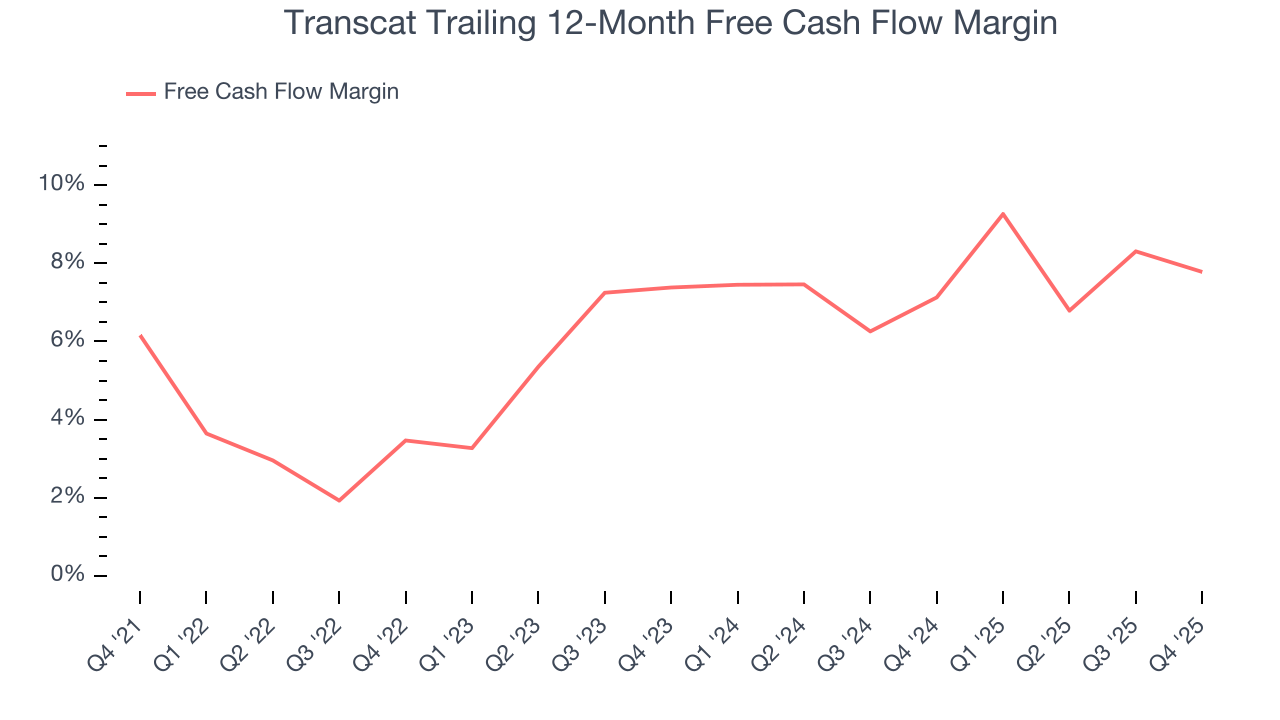
Transcat’s free cash flow clocked in at $9.47 million in Q4, equivalent to a 11.3% margin. The company’s cash profitability regressed as it was 3.3 percentage points lower than in the same quarter last year, but it’s still above its five-year average. We wouldn’t put too much weight on this quarter’s decline because capital expenditures can be seasonal and companies often stockpile inventory in anticipation of higher demand, causing short-term swings. Long-term trends are more important.
10. Return on Invested Capital (ROIC)
EPS and free cash flow tell us whether a company was profitable while growing its revenue. But was it capital-efficient? Enter ROIC, a metric showing how much operating profit a company generates relative to the money it has raised (debt and equity).
Transcat historically did a mediocre job investing in profitable growth initiatives. Its five-year average ROIC was 7.7%, somewhat low compared to the best industrials companies that consistently pump out 20%+.
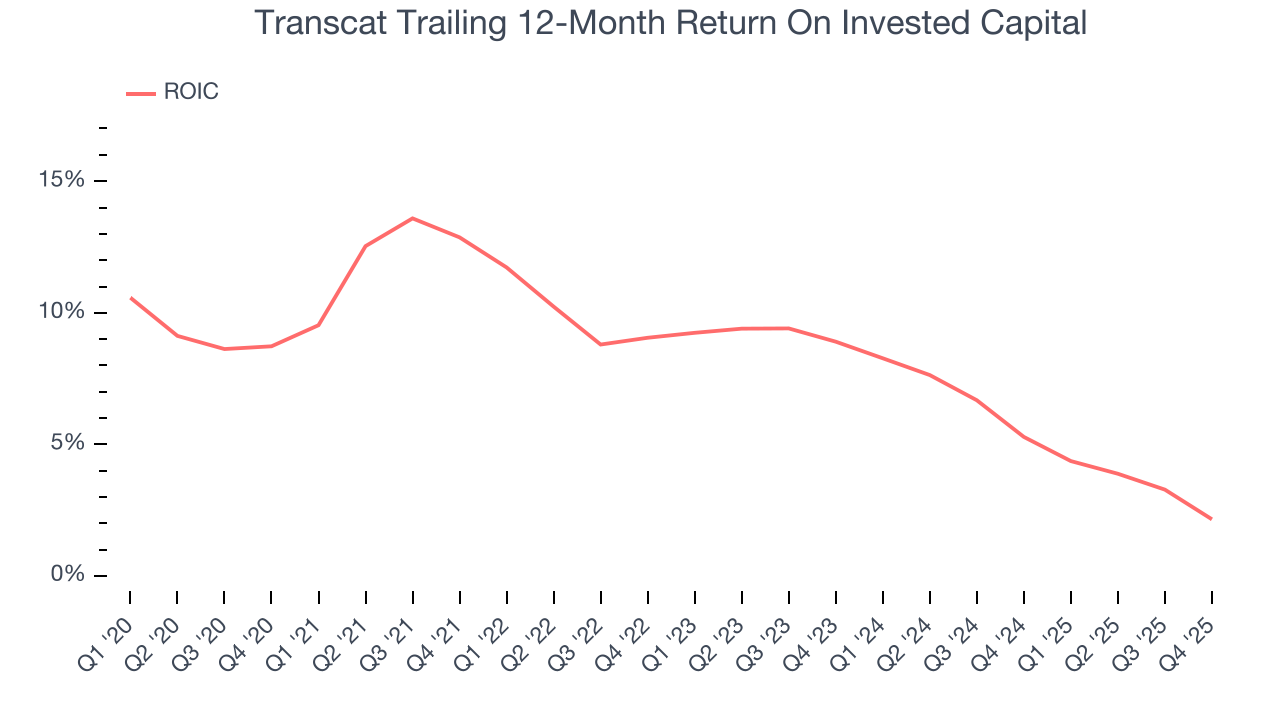
We like to invest in businesses with high returns, but the trend in a company’s ROIC is what often surprises the market and moves the stock price. Over the last few years, Transcat’s ROIC has unfortunately decreased. Paired with its already low returns, these declines suggest its profitable growth opportunities are few and far between.
11. Balance Sheet Assessment
Transcat reported $3.47 million of cash and $129.1 million of debt on its balance sheet in the most recent quarter. As investors in high-quality companies, we primarily focus on two things: 1) that a company’s debt level isn’t too high and 2) that its interest payments are not excessively burdening the business.
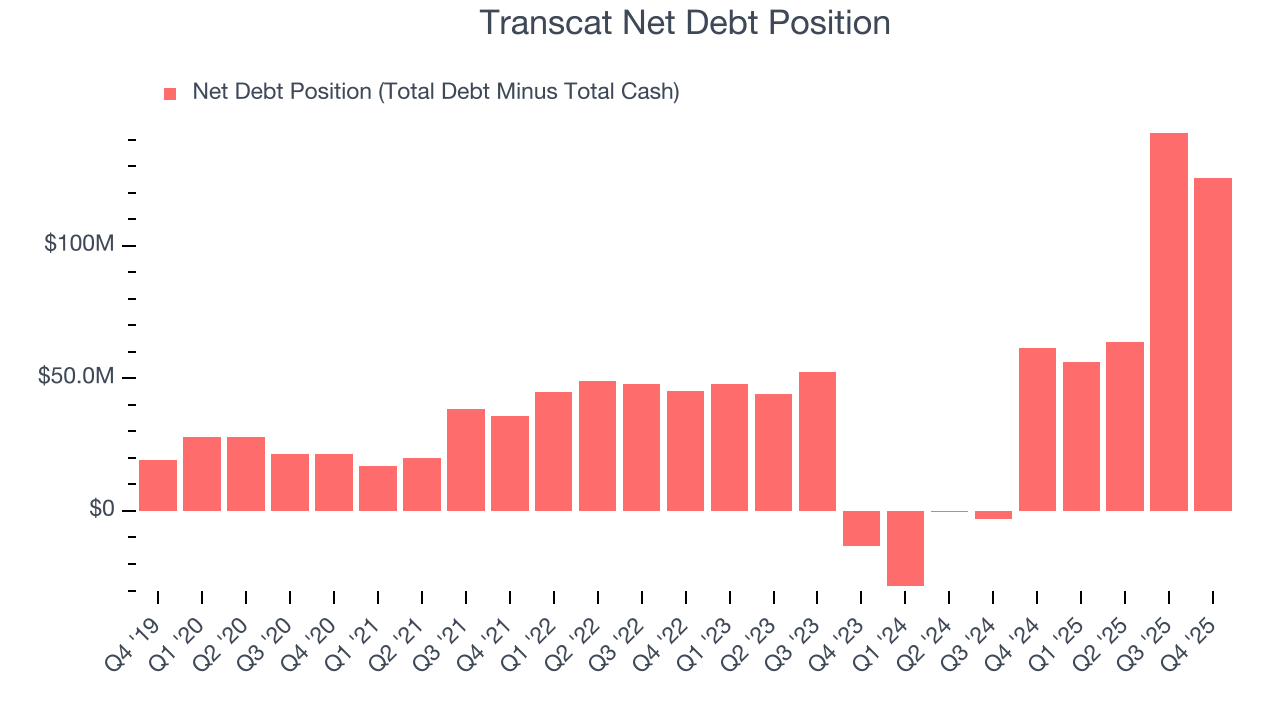
With $46.7 million of EBITDA over the last 12 months, we view Transcat’s 2.7× net-debt-to-EBITDA ratio as safe. We also see its $667,000 of annual interest expenses as appropriate. The company’s profits give it plenty of breathing room, allowing it to continue investing in growth initiatives.
12. Key Takeaways from Transcat’s Q4 Results
We were impressed by how significantly Transcat blew past analysts’ revenue expectations this quarter. On the other hand, its EBITDA missed and its EPS fell short of Wall Street’s estimates. Overall, this was a weaker quarter. The stock remained flat at $63.45 immediately after reporting.
13. Is Now The Time To Buy Transcat?
Updated: March 15, 2026 at 11:13 PM EDT
When considering an investment in Transcat, investors should account for its valuation and business qualities as well as what’s happened in the latest quarter.
Transcat isn’t a terrible business, but it doesn’t pass our bar. Although its revenue growth was impressive over the last five years, it’s expected to deteriorate over the next 12 months and its diminishing returns show management's prior bets haven't worked out. And while the company’s remarkable EPS growth over the last five years shows its profits are trickling down to shareholders, the downside is its projected EPS for the next year is lacking.
Transcat’s P/E ratio based on the next 12 months is 37.5x. This valuation tells us it’s a bit of a market darling with a lot of good news priced in - we think there are better stocks to buy right now.
Wall Street analysts have a consensus one-year price target of $101.33 on the company (compared to the current share price of $73.83).
Although the price target is bullish, readers should exercise caution because analysts tend to be overly optimistic. The firms they work for, often big banks, have relationships with companies that extend into fundraising, M&A advisory, and other rewarding business lines. As a result, they typically hesitate to say bad things for fear they will lose out. We at StockStory do not suffer from such conflicts of interest, so we’ll always tell it like it is.