
MSC Industrial (MSM)
We wouldn’t recommend MSC Industrial. Its poor sales growth and falling returns on capital suggest its growth opportunities are shrinking.― StockStory Analyst Team
1. News


2. Summary
Why We Think MSC Industrial Will Underperform
Founded in NYC’s Little Italy, MSC Industrial Direct (NYSE:MSM) provides industrial supplies and equipment, offering vast and reliable selection for customers such as contractors
- Customers postponed purchases of its products and services this cycle as its revenue declined by 2.5% annually over the last two years
- Performance over the past five years shows its incremental sales were much less profitable, as its earnings per share fell by 3.3% annually
- Demand will likely be soft over the next 12 months as Wall Street’s estimates imply tepid growth of 5.2%


MSC Industrial’s quality isn’t great. We’re redirecting our focus to better businesses.
Why There Are Better Opportunities Than MSC Industrial


MSC Industrial is trading at $91.25 per share, or 20.6x forward P/E. This multiple is lower than most industrials companies, but for good reason.
Cheap stocks can look like a great deal at first glance, but they can be value traps. They often have less earnings power, meaning there is more reliance on a re-rating to generate good returns - an unlikely scenario for low-quality companies.
3. MSC Industrial (MSM) Research Report: Q4 CY2025 Update
Industrial supplies company MSC Industrial Direct (NYSE:MSM) met Wall Streets revenue expectations in Q4 CY2025, with sales up 4% year on year to $965.7 million. Its non-GAAP profit of $0.99 per share was 4.8% above analysts’ consensus estimates.
MSC Industrial (MSM) Q4 CY2025 Highlights:
- Revenue: $965.7 million vs analyst estimates of $962.5 million (4% year-on-year growth, in line)
- Adjusted EPS: $0.99 vs analyst estimates of $0.95 (4.8% beat)
- Adjusted EBITDA: $105.7 million vs analyst estimates of $102.5 million (10.9% margin, 3.1% beat)
- Operating Margin: 7.9%, in line with the same quarter last year
- Free Cash Flow Margin: 0.8%, down from 8.8% in the same quarter last year
- Market Capitalization: $4.74 billion
Company Overview
Founded in NYC’s Little Italy, MSC Industrial Direct (NYSE:MSM) provides industrial supplies and equipment, offering vast and reliable selection for customers such as contractors
Specifically, MSC’s origins date back to 1941 when Sidney Jacobson began selling cutting tools and abrasives to local businesses. Over the decades, the company expanded its product offerings into areas like janitorial supplies and into services like inventory management. Today, MSC is a distributor of everything from cutting tools (saws) to materials handling (industrial containers) to safety products (orange cones). Services such as procurement analysis round out the MSC offering and make relationships stickier by providing valuable insights on spend.
For customers such as manufacturing plants and contractors, time is money; the last thing they want is to buy different product categories from multiple suppliers and wait for those products. MSC addresses this pain point by carrying broad and reliable inventory as well as the capabilities to get those goods to their destination quickly. This maintains smooth operations by supplying essential components and tools, ensuring minimal downtime and optimal performance.
The primary revenue sources for MSC come from the sale of industrial supplies and equipment. The company operates on a business model that includes direct sales, e-commerce platforms, and a network of distribution centers. MSC is able to generate a small portion of more predictable revenue through inventory management services that involve regular replenishment of essential supplies.
4. Maintenance and Repair Distributors
Supply chain and inventory management are themes that grew in focus after COVID wreaked havoc on the global movement of raw materials and components. Maintenance and repair distributors that boast reliable selection and quickly deliver products to customers can benefit from this theme. While e-commerce hasn’t disrupted industrial distribution as much as consumer retail, it is still a real threat, forcing investment in omnichannel capabilities to serve customers everywhere. Additionally, maintenance and repair distributors are at the whim of economic cycles that impact the capital spending and construction projects that can juice demand.
Competitors in the industrial products and services industry include W.W. Grainger (NYSE:GWW), Fastenal (NASDAQ:FAST), and Applied Industrial Technologies (NYSE:AIT).
5. Revenue Growth
Reviewing a company’s long-term sales performance reveals insights into its quality. Any business can have short-term success, but a top-tier one grows for years. Unfortunately, MSC Industrial’s 3.9% annualized revenue growth over the last five years was sluggish. This fell short of our benchmark for the industrials sector and is a tough starting point for our analysis.
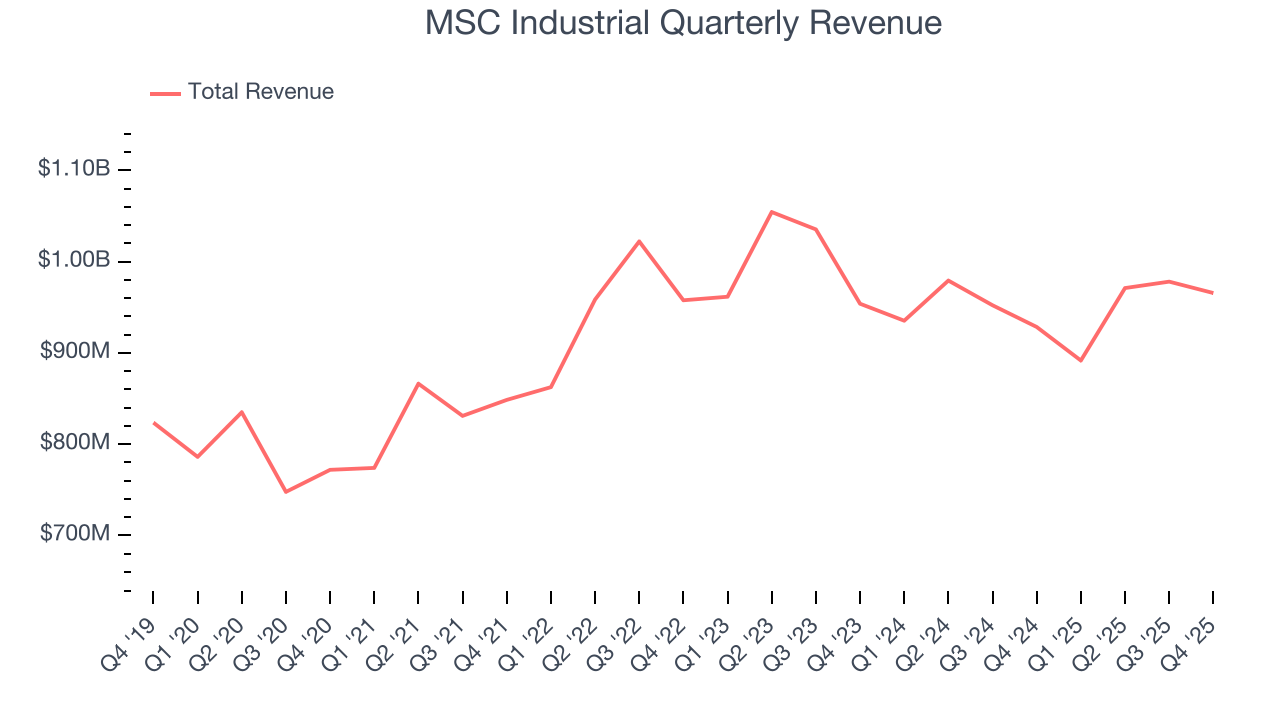
We at StockStory place the most emphasis on long-term growth, but within industrials, a half-decade historical view may miss cycles, industry trends, or a company capitalizing on catalysts such as a new contract win or a successful product line. MSC Industrial’s performance shows it grew in the past but relinquished its gains over the last two years, as its revenue fell by 2.5% annually. 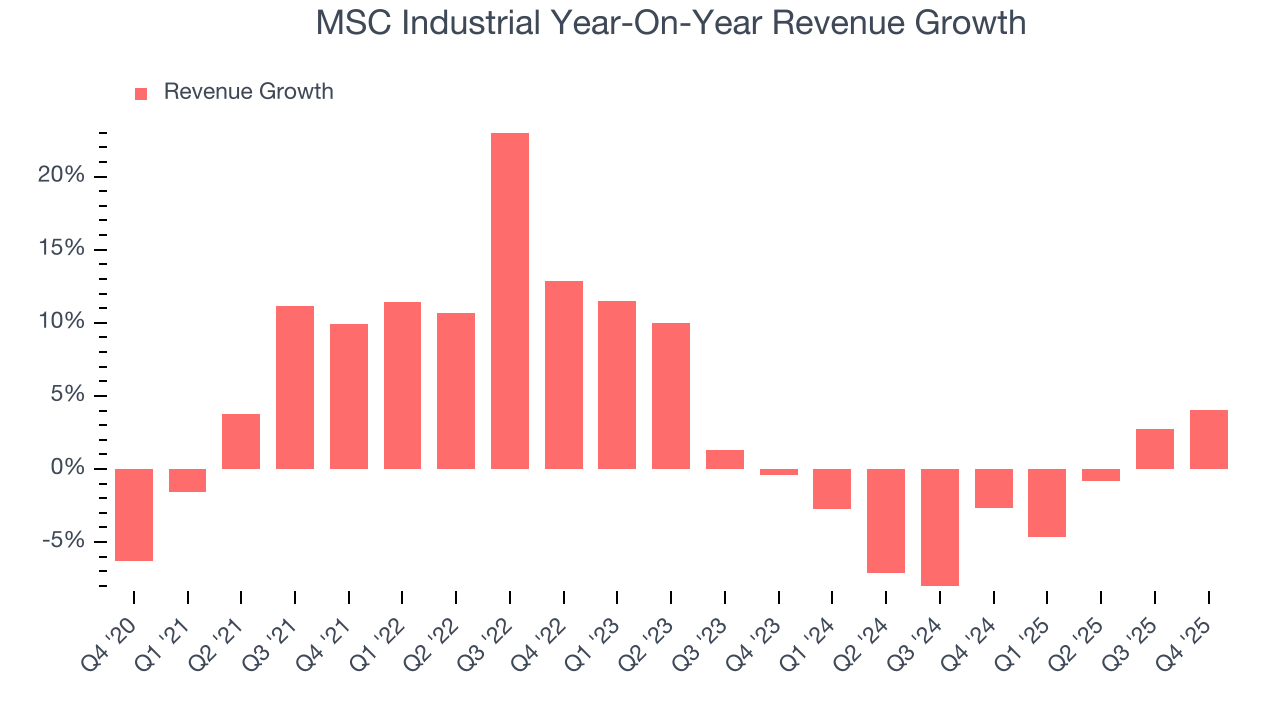
This quarter, MSC Industrial grew its revenue by 4% year on year, and its $965.7 million of revenue was in line with Wall Street’s estimates.
Looking ahead, sell-side analysts expect revenue to grow 5.5% over the next 12 months. Although this projection suggests its newer products and services will fuel better top-line performance, it is still below the sector average.
6. Gross Margin & Pricing Power
All else equal, we prefer higher gross margins because they usually indicate that a company sells more differentiated products and commands stronger pricing power.
MSC Industrial’s unit economics are great compared to the broader industrials sector and signal that it enjoys product differentiation through quality or brand. As you can see below, it averaged an excellent 41.5% gross margin over the last five years. Said differently, roughly $41.50 was left to spend on selling, marketing, R&D, and general administrative overhead for every $100 in revenue. 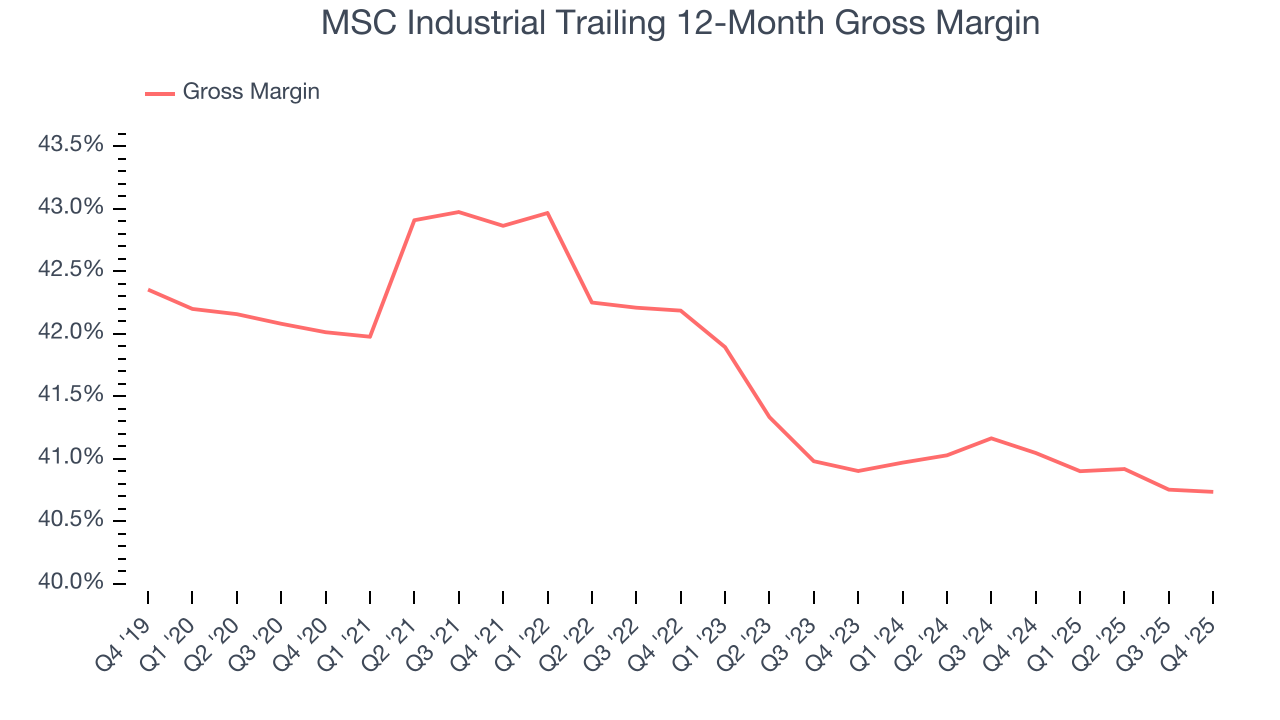
MSC Industrial produced a 40.7% gross profit margin in Q4, in line with the same quarter last year. On a wider time horizon, the company’s full-year margin has remained steady over the past four quarters, suggesting its input costs (such as raw materials and manufacturing expenses) have been stable and it isn’t under pressure to lower prices.
7. Operating Margin
Operating margin is one of the best measures of profitability because it tells us how much money a company takes home after procuring and manufacturing its products, marketing and selling those products, and most importantly, keeping them relevant through research and development.
MSC Industrial has managed its cost base well over the last five years. It demonstrated solid profitability for an industrials business, producing an average operating margin of 10.5%. This result isn’t surprising as its high gross margin gives it a favorable starting point.
Looking at the trend in its profitability, MSC Industrial’s operating margin decreased by 2.2 percentage points over the last five years. This raises questions about the company’s expense base because its revenue growth should have given it leverage on its fixed costs, resulting in better economies of scale and profitability.
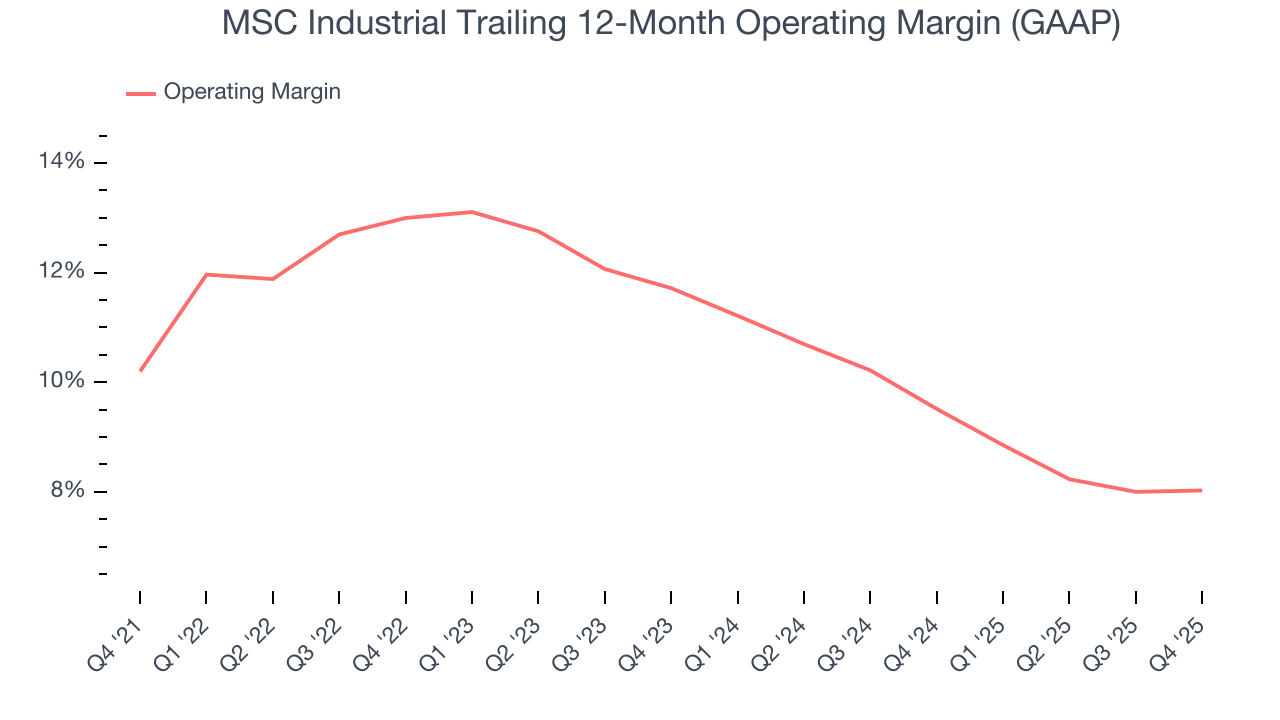
This quarter, MSC Industrial generated an operating margin profit margin of 7.9%, in line with the same quarter last year. This indicates the company’s cost structure has recently been stable.
8. Earnings Per Share
We track the long-term change in earnings per share (EPS) for the same reason as long-term revenue growth. Compared to revenue, however, EPS highlights whether a company’s growth is profitable.
Sadly for MSC Industrial, its EPS declined by 3.3% annually over the last five years while its revenue grew by 3.9%. This tells us the company became less profitable on a per-share basis as it expanded.
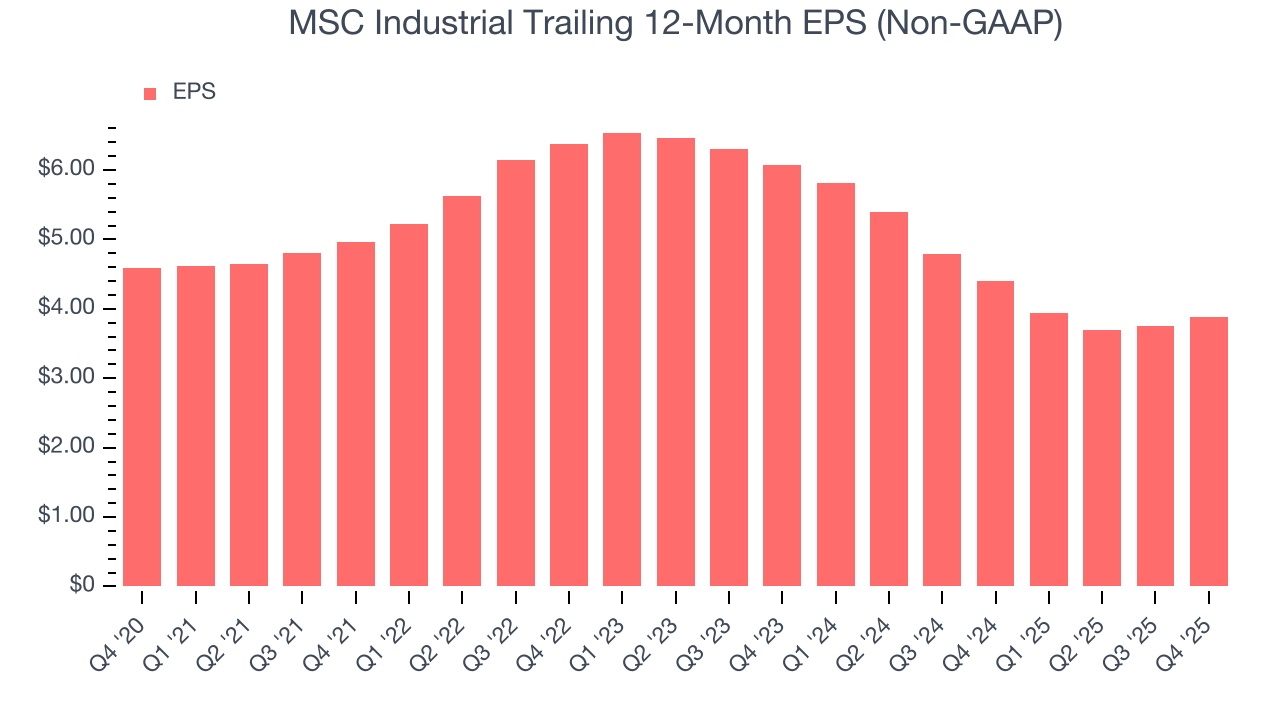
We can take a deeper look into MSC Industrial’s earnings to better understand the drivers of its performance. As we mentioned earlier, MSC Industrial’s operating margin was flat this quarter but declined by 2.2 percentage points over the last five years. This was the most relevant factor (aside from the revenue impact) behind its lower earnings; interest expenses and taxes can also affect EPS but don’t tell us as much about a company’s fundamentals.
Like with revenue, we analyze EPS over a shorter period to see if we are missing a change in the business.
MSC Industrial’s two-year annual EPS declines of 20.1% were bad and lower than its two-year revenue losses.
In Q4, MSC Industrial reported adjusted EPS of $0.99, up from $0.86 in the same quarter last year. This print beat analysts’ estimates by 4.8%. Over the next 12 months, Wall Street expects MSC Industrial’s full-year EPS of $3.88 to grow 13.4%.
9. Cash Is King
If you’ve followed StockStory for a while, you know we emphasize free cash flow. Why, you ask? We believe that in the end, cash is king, and you can’t use accounting profits to pay the bills.
MSC Industrial has shown decent cash profitability, giving it some flexibility to reinvest or return capital to investors. The company’s free cash flow margin averaged 7.7% over the last five years, slightly better than the broader industrials sector.
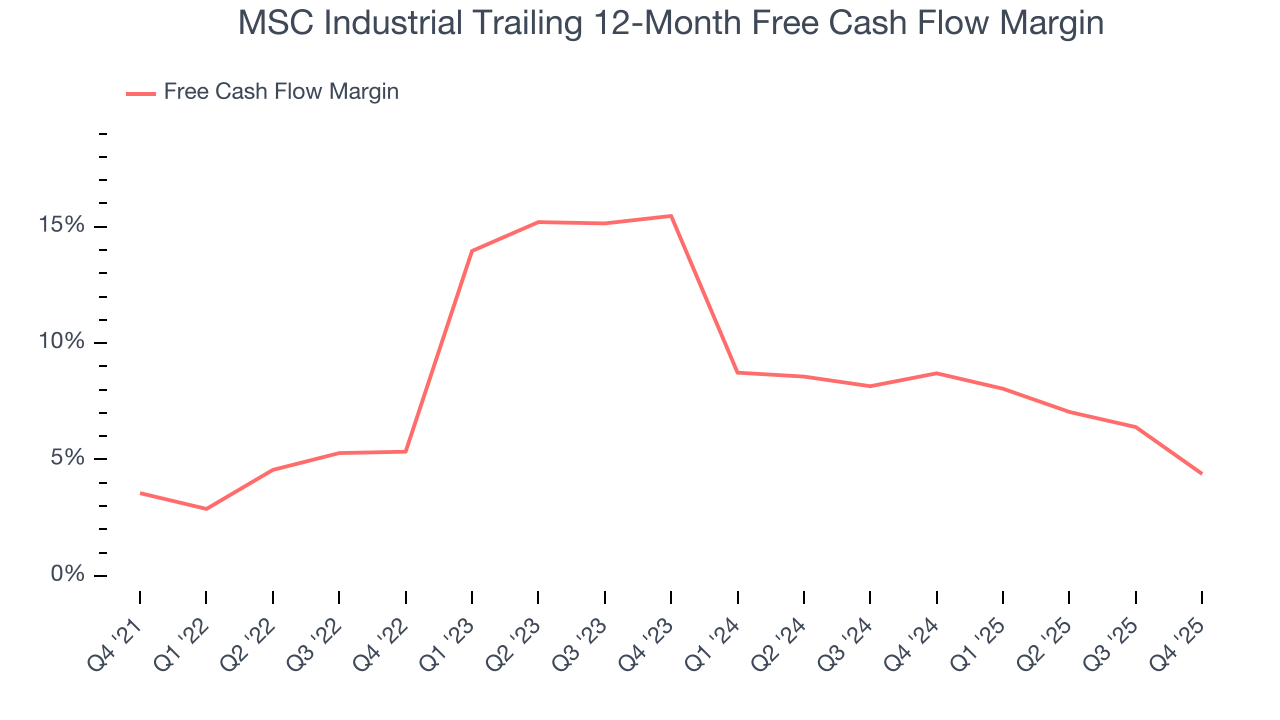
MSC Industrial broke even from a free cash flow perspective in Q4. The company’s cash profitability regressed as it was 8 percentage points lower than in the same quarter last year, prompting us to pay closer attention. Short-term fluctuations typically aren’t a big deal because investment needs can be seasonal, but we’ll be watching to see if the trend extrapolates into future quarters.
10. Return on Invested Capital (ROIC)
EPS and free cash flow tell us whether a company was profitable while growing its revenue. But was it capital-efficient? A company’s ROIC explains this by showing how much operating profit it makes compared to the money it has raised (debt and equity).
Although MSC Industrial hasn’t been the highest-quality company lately because of its poor revenue and EPS performance, it historically found a few growth initiatives that worked out well. Its five-year average ROIC was 16.8%, impressive for an industrials business.
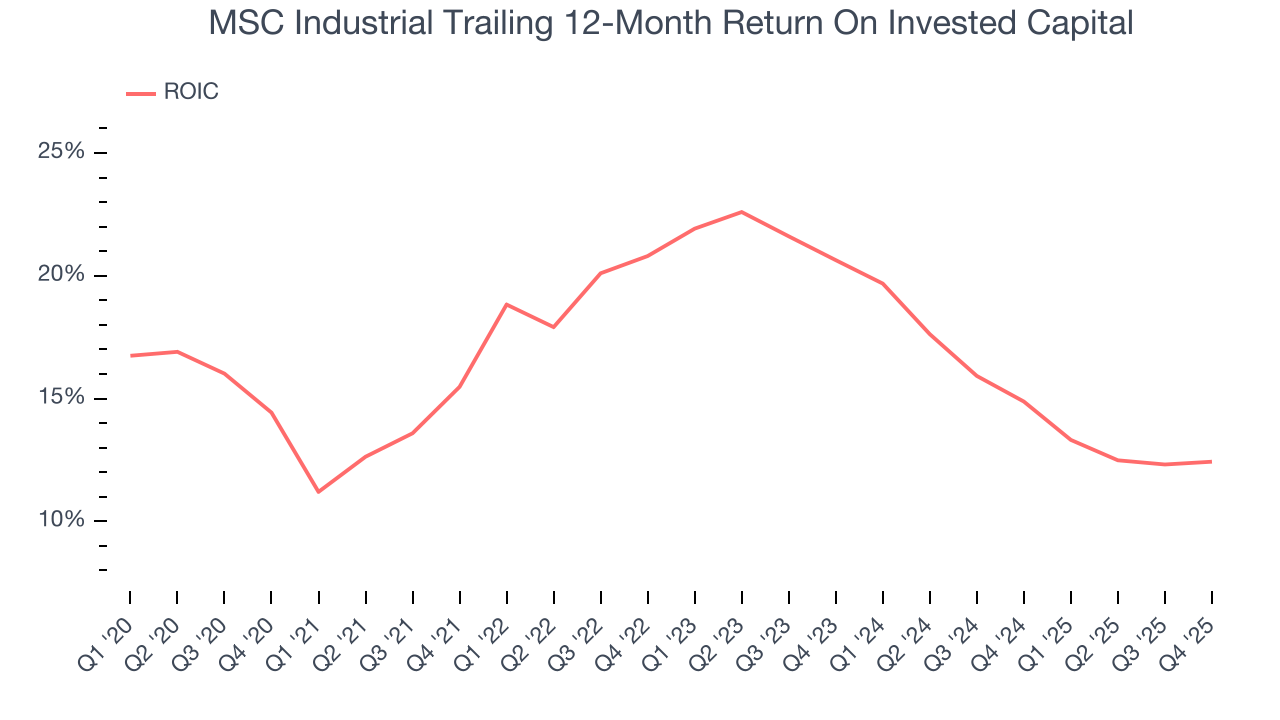
We like to invest in businesses with high returns, but the trend in a company’s ROIC is what often surprises the market and moves the stock price. Over the last few years, MSC Industrial’s ROIC averaged 4.5 percentage point decreases each year. We like what management has done in the past, but its declining returns are perhaps a symptom of fewer profitable growth opportunities.
11. Balance Sheet Assessment
MSC Industrial reported $40.25 million of cash and $580 million of debt on its balance sheet in the most recent quarter. As investors in high-quality companies, we primarily focus on two things: 1) that a company’s debt level isn’t too high and 2) that its interest payments are not excessively burdening the business.
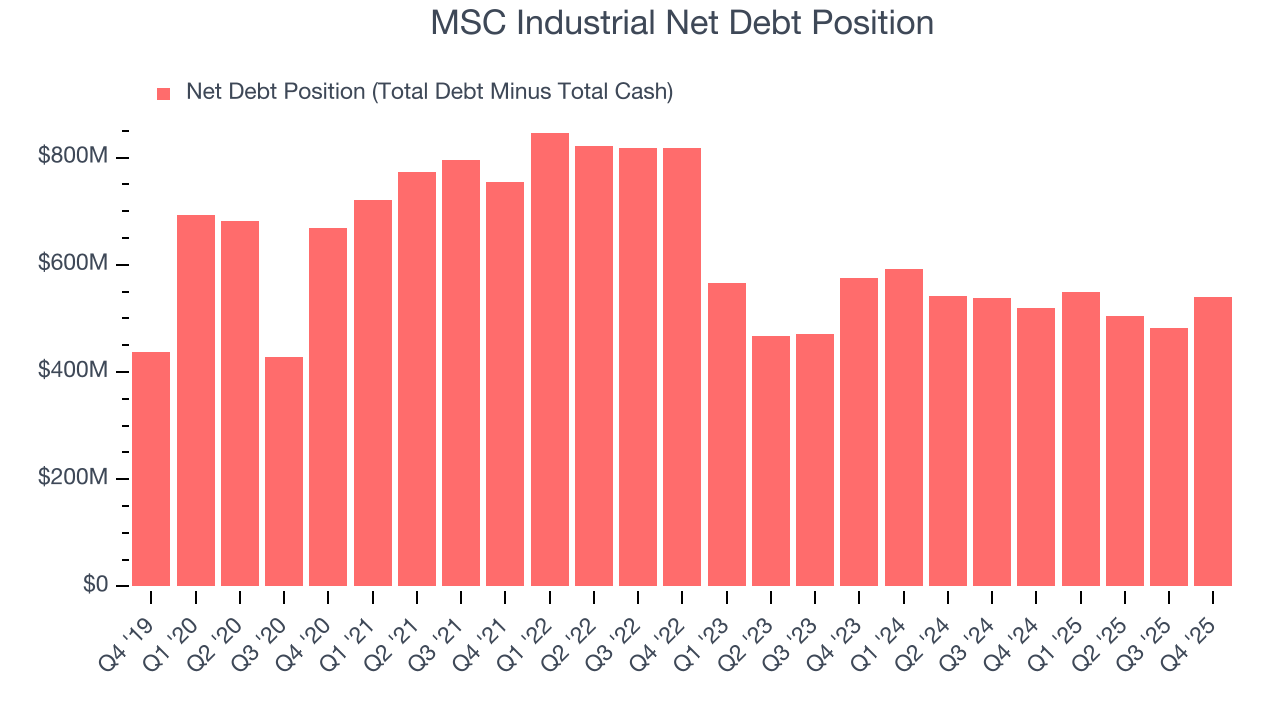
With $417.2 million of EBITDA over the last 12 months, we view MSC Industrial’s 1.3× net-debt-to-EBITDA ratio as safe. We also see its $12.06 million of annual interest expenses as appropriate. The company’s profits give it plenty of breathing room, allowing it to continue investing in growth initiatives.
12. Key Takeaways from MSC Industrial’s Q4 Results
It was encouraging to see MSC Industrial beat analysts’ EBITDA expectations this quarter. We were also glad its EPS outperformed Wall Street’s estimates. Overall, this print had some key positives. The stock remained flat at $84.44 immediately after reporting.
13. Is Now The Time To Buy MSC Industrial?
Updated: March 15, 2026 at 11:36 PM EDT
Before deciding whether to buy MSC Industrial or pass, we urge investors to consider business quality, valuation, and the latest quarterly results.
MSC Industrial falls short of our quality standards. For starters, its revenue growth was uninspiring over the last five years. While its admirable gross margins indicate the mission-critical nature of its offerings, the downside is its declining EPS over the last five years makes it a less attractive asset to the public markets. On top of that, its diminishing returns show management's prior bets haven't worked out.
MSC Industrial’s P/E ratio based on the next 12 months is 20.6x. This multiple tells us a lot of good news is priced in - we think other companies feature superior fundamentals at the moment.
Wall Street analysts have a consensus one-year price target of $85.83 on the company (compared to the current share price of $91.25), implying they don’t see much short-term potential in MSC Industrial.