
W.W. Grainger (GWW)
We’re not sold on W.W. Grainger. Its decelerating revenue growth and even worse EPS performance give us little confidence it can beat the market.― StockStory Analyst Team
1. News


2. Summary
Why W.W. Grainger Is Not Exciting
Founded as a supplier of motors, W.W. Grainger (NYSE:GWW) provides maintenance, repair, and operating (MRO) supplies and services to businesses and institutions.
- Organic sales performance over the past two years indicates the company may need to make strategic adjustments or rely on M&A to catalyze faster growth
- Estimated sales growth of 5.5% for the next 12 months is soft and implies weaker demand
- The good news is that its ROIC punches in at 36.8%, illustrating management’s expertise in identifying profitable investments, and its rising returns show it’s making even more lucrative bets


W.W. Grainger’s quality is lacking. Better businesses are for sale in the market.
Why There Are Better Opportunities Than W.W. Grainger


At $1,068 per share, W.W. Grainger trades at 24.8x forward P/E. This multiple is quite expensive for the quality you get.
Paying a premium for high-quality companies with strong long-term earnings potential is preferable to owning challenged businesses with questionable prospects. That helps the prudent investor sleep well at night.
3. W.W. Grainger (GWW) Research Report: Q4 CY2025 Update
Maintenance and repair supplier W.W. Grainger (NYSE:GWW) reported Q4 CY2025 results beating Wall Street’s revenue expectations, with sales up 4.5% year on year to $4.43 billion. The company expects the full year’s revenue to be around $18.9 billion, close to analysts’ estimates. Its GAAP profit of $9.44 per share was 4.1% below analysts’ consensus estimates.
W.W. Grainger (GWW) Q4 CY2025 Highlights:
- Revenue: $4.43 billion vs analyst estimates of $4.39 billion (4.5% year-on-year growth, 0.7% beat)
- EPS (GAAP): $9.44 vs analyst expectations of $9.85 (4.1% miss)
- Adjusted EBITDA: $713 million vs analyst estimates of $702.9 million (16.1% margin, 1.4% beat)
- EPS (GAAP) guidance for the upcoming financial year 2026 is $43.50 at the midpoint, missing analyst estimates by 0.8%
- Operating Margin: 14.3%, in line with the same quarter last year
- Free Cash Flow Margin: 6.1%, up from 4% in the same quarter last year
- Organic Revenue rose 4.6% year on year (beat)
- Market Capitalization: $52.12 billion
Company Overview
Founded as a supplier of motors, W.W. Grainger (NYSE:GWW) provides maintenance, repair, and operating (MRO) supplies and services to businesses and institutions.
William W. Grainger started W.W. Grainger in 1927 to fill what the founder thought was a big market void. The company addressed demand for maintenance, repair, and operating (MRO) supplies such as motors, tools, and safety supplies such as eye protection, sold through a catalog. Instead of wasting time and resources buying different products from different retailers, a factory or industrial customer could rely on a one-stop-shop that was reliable and cost effective.
Today, Grainger offers an extensive range of MRO supplies and services, including safety products, material handling equipment, lighting solutions, and inventory management services. The company solves the problem of sourcing and procuring necessary MRO products by being a single supplier for businesses and institutions. For instance, Grainger helps manufacturing plants maintain operational efficiency by supplying spare parts and tools, while also offering safety equipment to ensure workplace compliance with regulations.
The primary revenue sources for Grainger come from the sale of these MRO products. The company's business model emphasizes direct sales. Historically, the company and industry peers distributed catalogs to customers, who would in turn call in their orders via telephone, and supplemented these catalogs with physical retail branches. Today, however, Grainger has an extensive online presence to meet more digitized customers where they are. Despite a shift from catalogs to e-commerce though, Grainger's value has always rested on its ability to offer a very broad selection of quality products that the company can get to customers in a timely manner so as not to disrupt factory or other operations.
4. Maintenance and Repair Distributors
Supply chain and inventory management are themes that grew in focus after COVID wreaked havoc on the global movement of raw materials and components. Maintenance and repair distributors that boast reliable selection and quickly deliver products to customers can benefit from this theme. While e-commerce hasn’t disrupted industrial distribution as much as consumer retail, it is still a real threat, forcing investment in omnichannel capabilities to serve customers everywhere. Additionally, maintenance and repair distributors are at the whim of economic cycles that impact the capital spending and construction projects that can juice demand.
Competitors in the operating (MRO) supplies industry include Fastenal (NASDAQ:FAST), MSC Industrial Direct (NYSE:MSM), and HD Supply (NASDAQ:HDS).
5. Revenue Growth
Examining a company’s long-term performance can provide clues about its quality. Any business can have short-term success, but a top-tier one grows for years. Thankfully, W.W. Grainger’s 8.7% annualized revenue growth over the last five years was decent. Its growth was slightly above the average industrials company and shows its offerings resonate with customers.
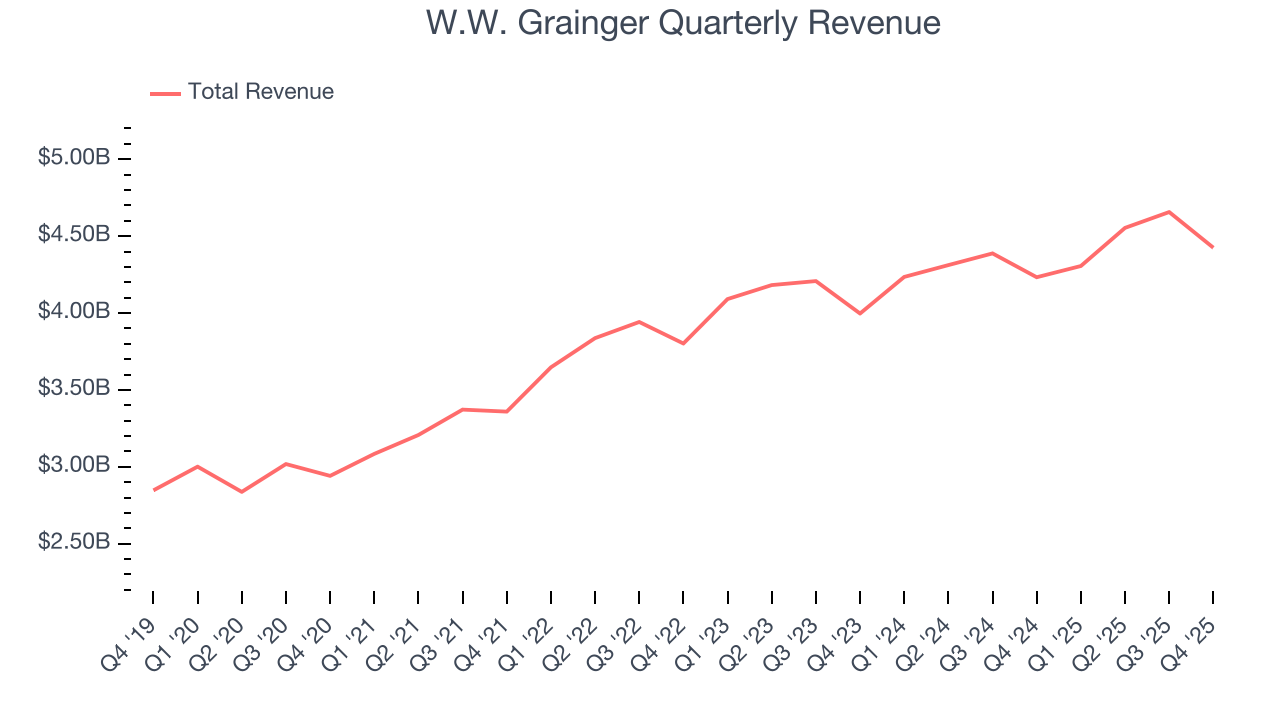
We at StockStory place the most emphasis on long-term growth, but within industrials, a half-decade historical view may miss cycles, industry trends, or a company capitalizing on catalysts such as a new contract win or a successful product line. W.W. Grainger’s recent performance shows its demand has slowed as its annualized revenue growth of 4.3% over the last two years was below its five-year trend. 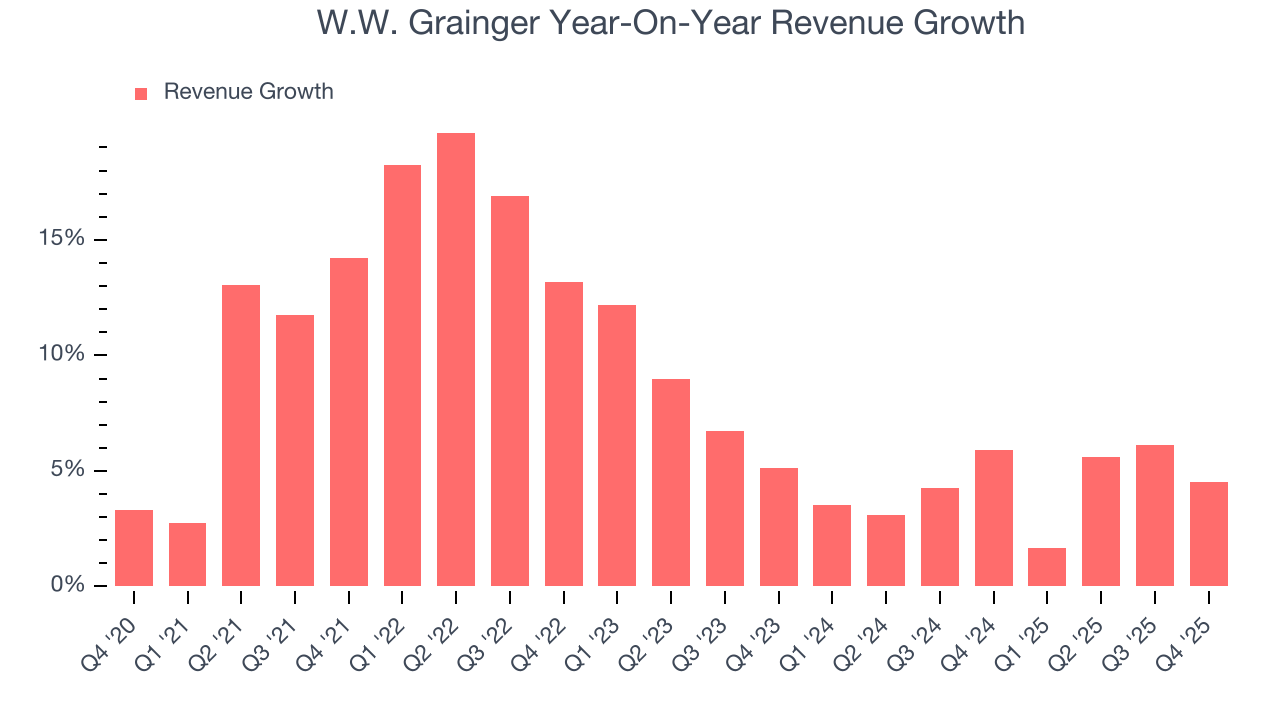
We can better understand the company’s sales dynamics by analyzing its organic revenue, which strips out one-time events like acquisitions and currency fluctuations that don’t accurately reflect its fundamentals. Over the last two years, W.W. Grainger’s organic revenue averaged 4.8% year-on-year growth. Because this number aligns with its two-year revenue growth, we can see the company’s core operations (not acquisitions and divestitures) drove most of its results. 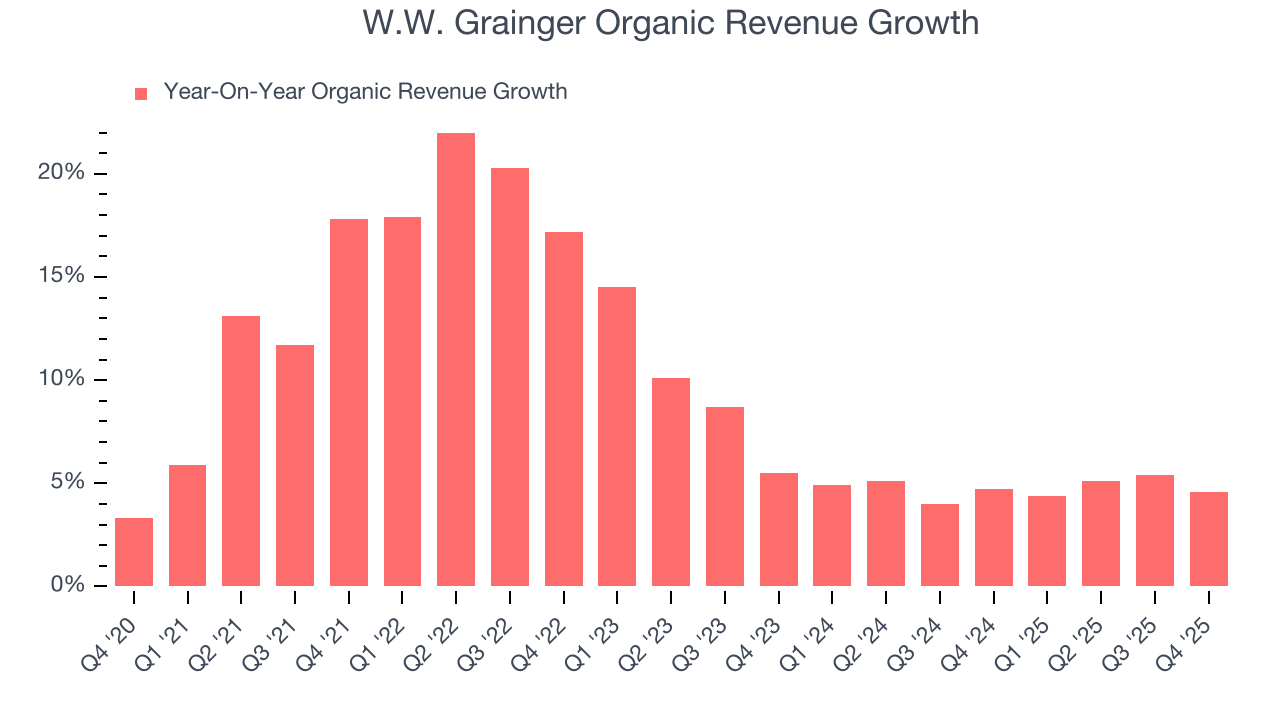
This quarter, W.W. Grainger reported modest year-on-year revenue growth of 4.5% but beat Wall Street’s estimates by 0.7%.
Looking ahead, sell-side analysts expect revenue to grow 4.9% over the next 12 months, similar to its two-year rate. This projection doesn't excite us and implies its newer products and services will not lead to better top-line performance yet.
6. Gross Margin & Pricing Power
At StockStory, we prefer high gross margin businesses because they indicate the company has pricing power or differentiated products, giving it a chance to generate higher operating profits.
W.W. Grainger’s unit economics are great compared to the broader industrials sector and signal that it enjoys product differentiation through quality or brand. As you can see below, it averaged an excellent 38.6% gross margin over the last five years. Said differently, roughly $38.62 was left to spend on selling, marketing, R&D, and general administrative overhead for every $100 in revenue. 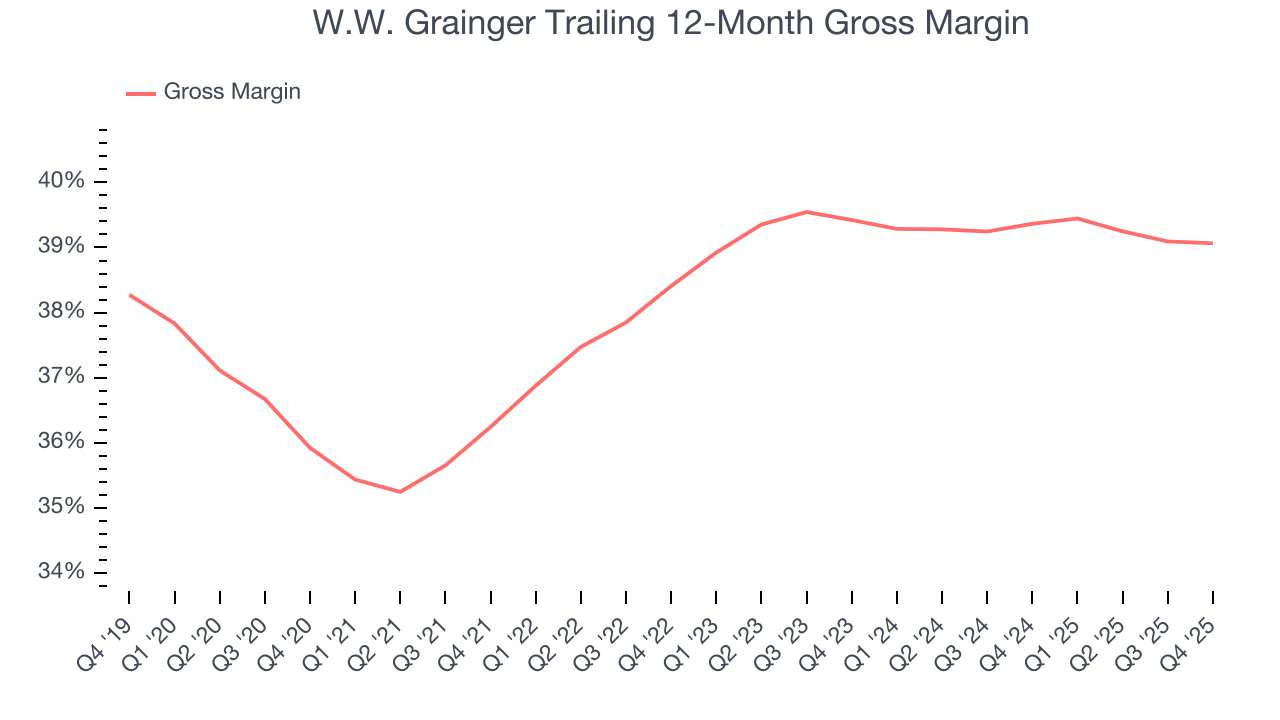
W.W. Grainger produced a 39.5% gross profit margin in Q4, in line with the same quarter last year. Zooming out, the company’s full-year margin has remained steady over the past 12 months, suggesting its input costs (such as raw materials and manufacturing expenses) have been stable and it isn’t under pressure to lower prices.
7. Operating Margin
Operating margin is an important measure of profitability as it shows the portion of revenue left after accounting for all core expenses – everything from the cost of goods sold to advertising and wages. It’s also useful for comparing profitability across companies with different levels of debt and tax rates because it excludes interest and taxes.
W.W. Grainger has been an efficient company over the last five years. It was one of the more profitable businesses in the industrials sector, boasting an average operating margin of 14.4%. This result isn’t surprising as its high gross margin gives it a favorable starting point.
Analyzing the trend in its profitability, W.W. Grainger’s operating margin rose by 2 percentage points over the last five years, as its sales growth gave it operating leverage.
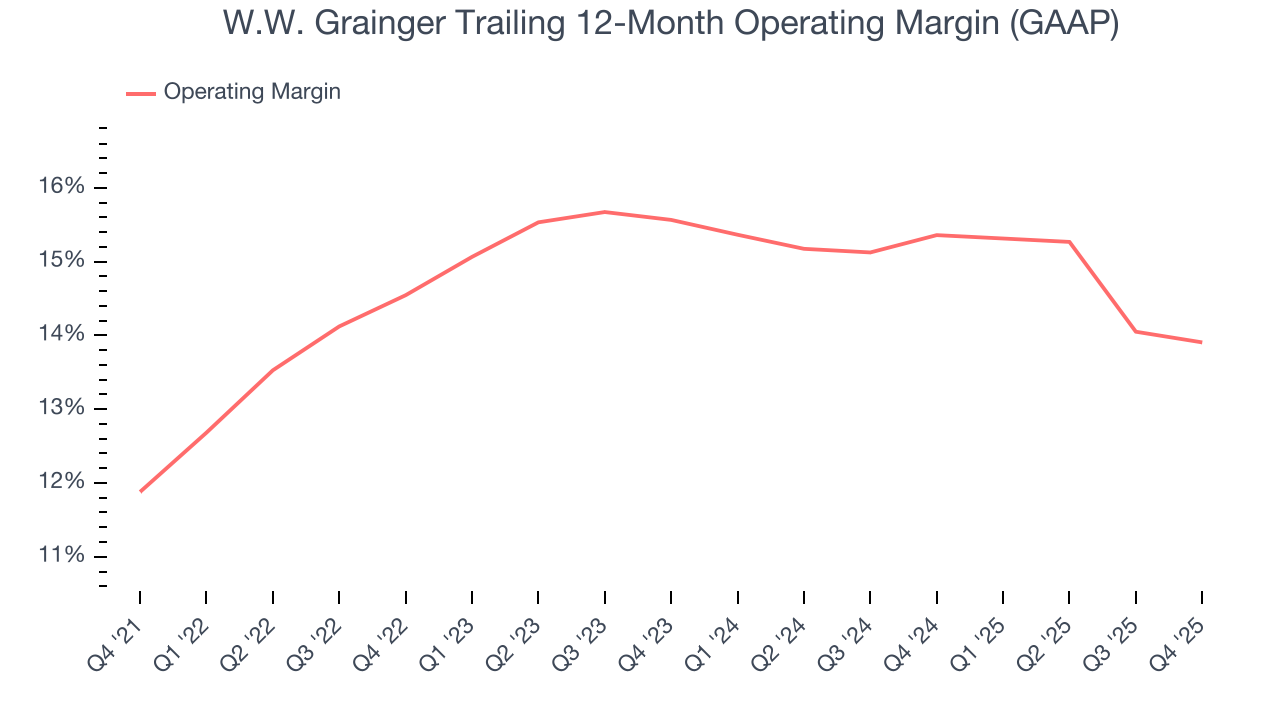
This quarter, W.W. Grainger generated an operating margin profit margin of 14.3%, in line with the same quarter last year. This indicates the company’s cost structure has recently been stable.
8. Earnings Per Share
We track the long-term change in earnings per share (EPS) for the same reason as long-term revenue growth. Compared to revenue, however, EPS highlights whether a company’s growth is profitable.
W.W. Grainger’s EPS grew at an astounding 22.5% compounded annual growth rate over the last five years, higher than its 8.7% annualized revenue growth. This tells us the company became more profitable on a per-share basis as it expanded.
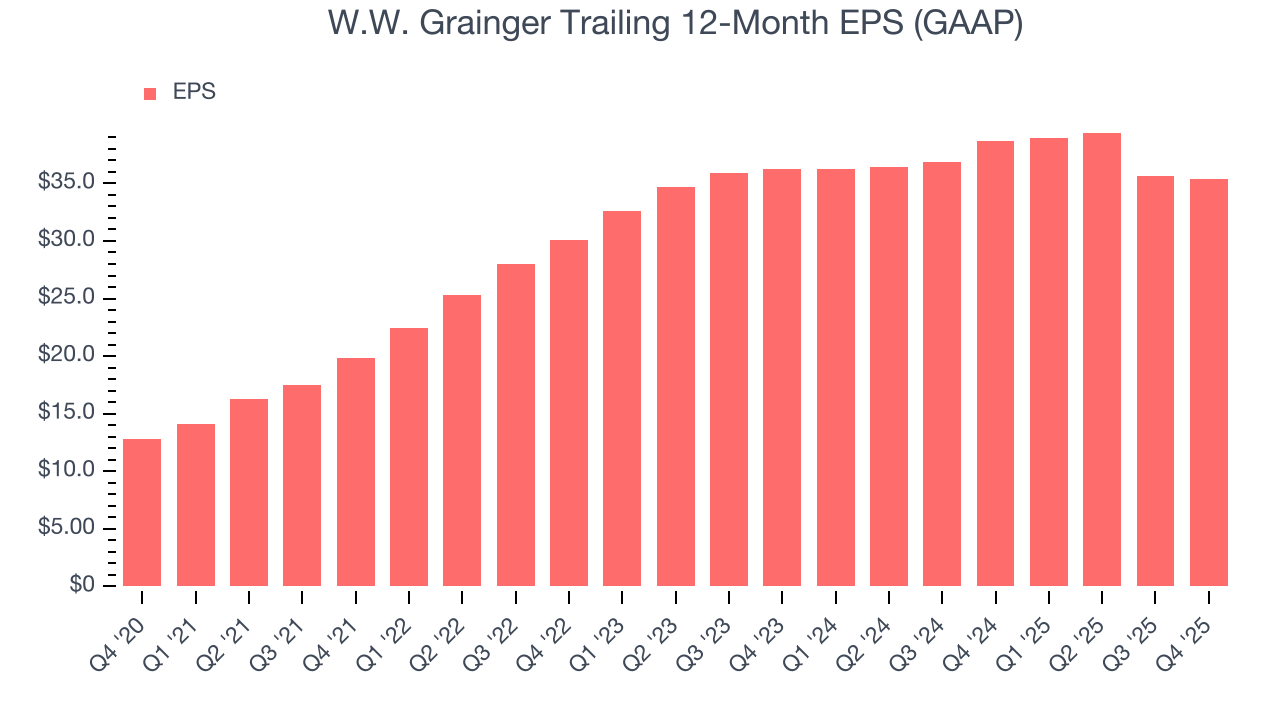
Diving into the nuances of W.W. Grainger’s earnings can give us a better understanding of its performance. As we mentioned earlier, W.W. Grainger’s operating margin was flat this quarter but expanded by 2 percentage points over the last five years. On top of that, its share count shrank by 11.2%. These are positive signs for shareholders because improving profitability and share buybacks turbocharge EPS growth relative to revenue growth. 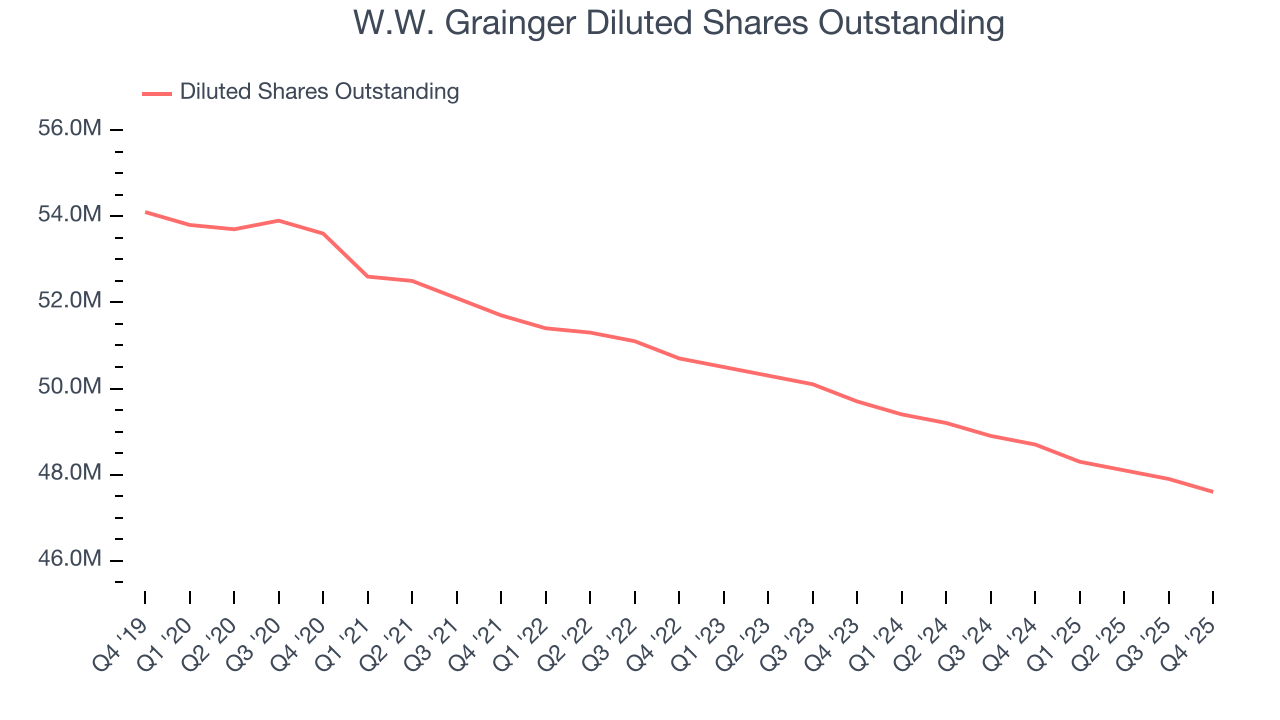
Like with revenue, we analyze EPS over a shorter period to see if we are missing a change in the business.
For W.W. Grainger, its two-year annual EPS declines of 1.1% mark a reversal from its (seemingly) healthy five-year trend. We hope W.W. Grainger can return to earnings growth in the future.
In Q4, W.W. Grainger reported EPS of $9.44, down from $9.71 in the same quarter last year. This print missed analysts’ estimates, but we care more about long-term EPS growth than short-term movements. Over the next 12 months, Wall Street expects W.W. Grainger’s full-year EPS of $35.39 to grow 23.5%.
9. Cash Is King
If you’ve followed StockStory for a while, you know we emphasize free cash flow. Why, you ask? We believe that in the end, cash is king, and you can’t use accounting profits to pay the bills.
W.W. Grainger has shown impressive cash profitability, enabling it to ride out cyclical downturns more easily while maintaining its investments in new and existing offerings. The company’s free cash flow margin averaged 7.8% over the last five years, better than the broader industrials sector.
Taking a step back, we can see that W.W. Grainger’s margin expanded by 2.2 percentage points during that time. This is encouraging because it gives the company more optionality.
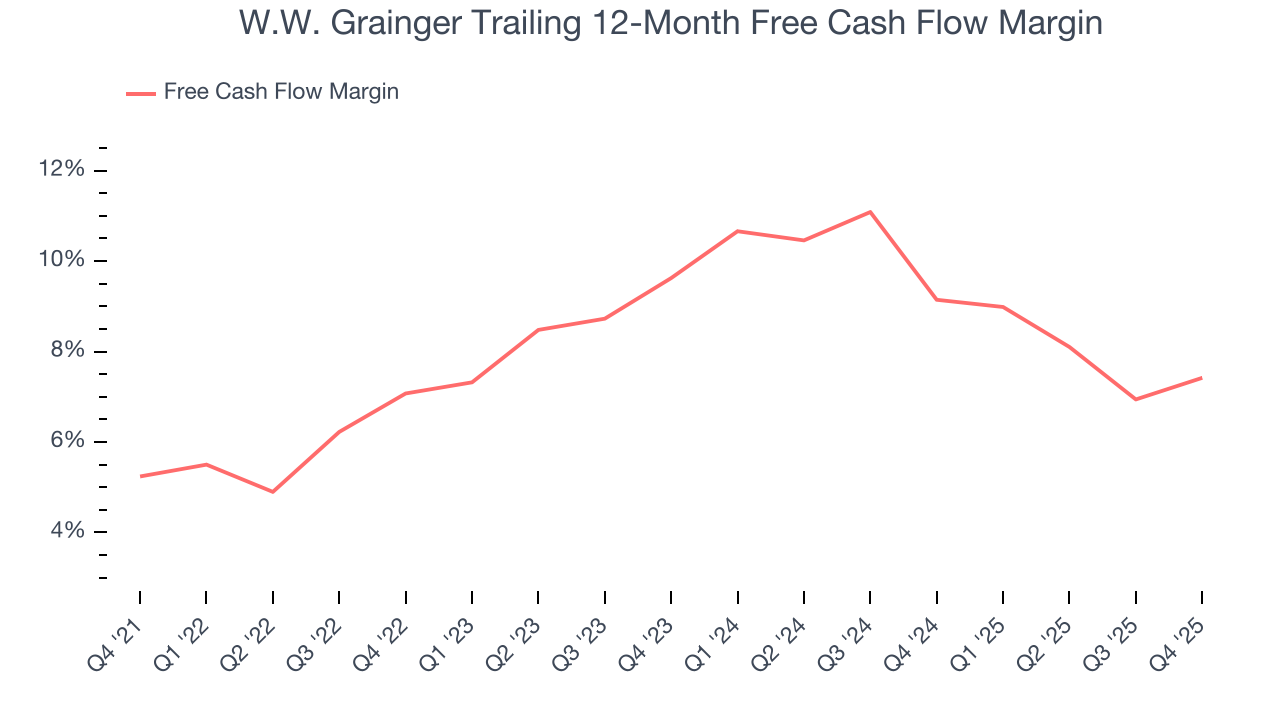
W.W. Grainger’s free cash flow clocked in at $269 million in Q4, equivalent to a 6.1% margin. This result was good as its margin was 2.1 percentage points higher than in the same quarter last year, building on its favorable historical trend.
10. Return on Invested Capital (ROIC)
EPS and free cash flow tell us whether a company was profitable while growing its revenue. But was it capital-efficient? A company’s ROIC explains this by showing how much operating profit it makes compared to the money it has raised (debt and equity).
Although W.W. Grainger hasn’t been the highest-quality company lately, it found a few growth initiatives in the past that worked out wonderfully. Its five-year average ROIC was 36.6%, splendid for an industrials business.
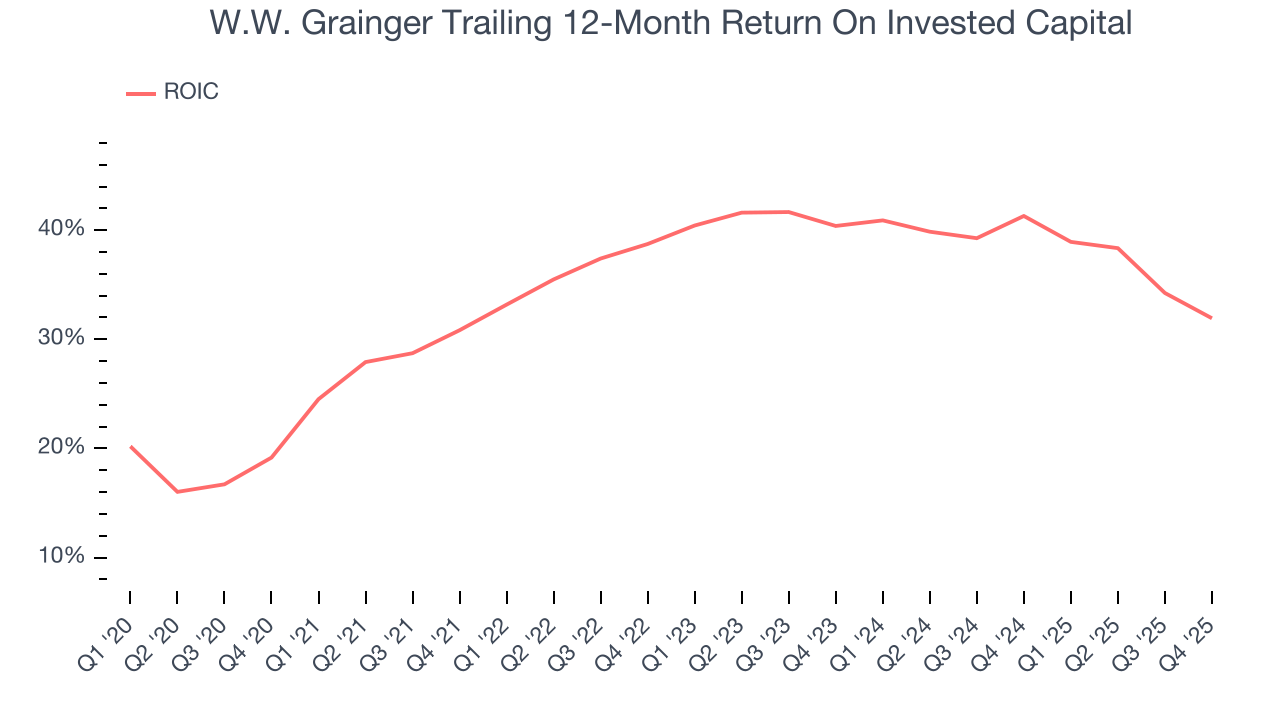
We like to invest in businesses with high returns, but the trend in a company’s ROIC is what often surprises the market and moves the stock price. On average, W.W. Grainger’s ROIC increased by 1.8 percentage points annually over the last few years. This is a good sign, and if its returns keep rising, there’s a chance it could evolve into an investable business.
11. Balance Sheet Assessment
W.W. Grainger reported $585 million of cash and $2.86 billion of debt on its balance sheet in the most recent quarter. As investors in high-quality companies, we primarily focus on two things: 1) that a company’s debt level isn’t too high and 2) that its interest payments are not excessively burdening the business.
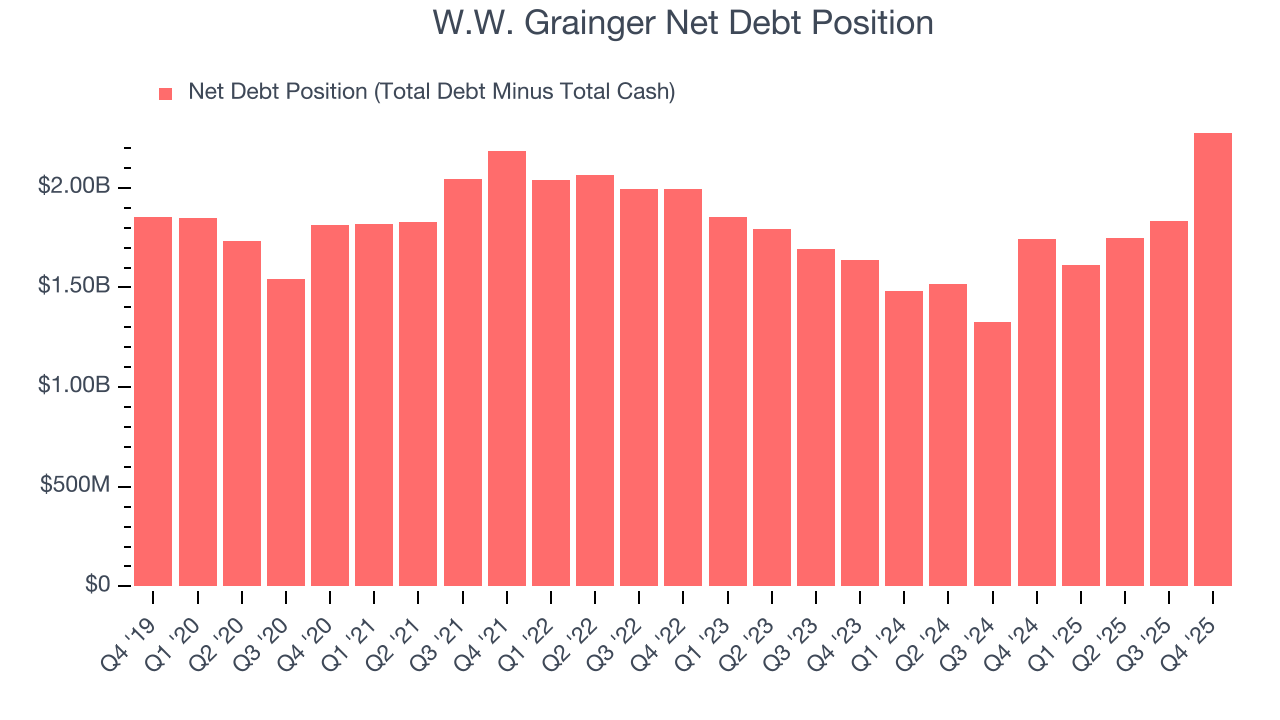
With $2.96 billion of EBITDA over the last 12 months, we view W.W. Grainger’s 0.8× net-debt-to-EBITDA ratio as safe. We also see its $41 million of annual interest expenses as appropriate. The company’s profits give it plenty of breathing room, allowing it to continue investing in growth initiatives.
12. Key Takeaways from W.W. Grainger’s Q4 Results
It was good to see W.W. Grainger narrowly top analysts’ revenue expectations this quarter. We were also happy its EBITDA narrowly outperformed Wall Street’s estimates. On the other hand, its EPS missed and its full-year EPS guidance fell slightly short of Wall Street’s estimates. Overall, this was a softer quarter. The stock remained flat at $1,102 immediately following the results.
13. Is Now The Time To Buy W.W. Grainger?
Updated: March 13, 2026 at 11:03 PM EDT
Before deciding whether to buy W.W. Grainger or pass, we urge investors to consider business quality, valuation, and the latest quarterly results.
W.W. Grainger has some positive attributes, but it isn’t one of our picks. First off, its revenue growth was good over the last five years. And while W.W. Grainger’s organic revenue growth has disappointed, its astounding EPS growth over the last five years shows its profits are trickling down to shareholders.
W.W. Grainger’s P/E ratio based on the next 12 months is 24.8x. Investors with a higher risk tolerance might like the company, but we don’t really see a big opportunity at the moment. We're pretty confident there are more exciting stocks to buy at the moment.
Wall Street analysts have a consensus one-year price target of $1,144 on the company (compared to the current share price of $1,068).