
The Trade Desk (TTD)
The Trade Desk is an exciting business. Its combination of extraordinary growth and robust profitability makes it a beloved asset.― StockStory Analyst Team
1. News


2. Summary
Why We Like The Trade Desk
Built as an alternative to "walled garden" advertising ecosystems, The Trade Desk (NASDAQ:TTD) provides a cloud-based platform that helps advertisers and agencies plan, manage, and optimize digital advertising campaigns across multiple channels and devices.
- Excellent operating margin highlights the strength of its business model, and it turbocharged its profits by achieving some fixed cost leverage
- User-friendly software enables clients to ramp up spending quickly, leading to the speedy recovery of customer acquisition costs
- Market share has increased as its 22% annual revenue growth over the last two years was exceptional


The Trade Desk is a top-tier company. The valuation looks fair when considering its quality, so this might be a prudent time to buy some shares.
Why Is Now The Time To Buy The Trade Desk?


At $27.22 per share, The Trade Desk trades at 3.9x forward price-to-sales. This multiple is cheap, and we think the stock is a bargain considering its quality characteristics.
We jump for joy when high-quality companies trade at bargain prices because shareholders can benefit from both earnings growth and a positive re-rating - a powerful one-two punch.
3. The Trade Desk (TTD) Research Report: Q4 CY2025 Update
Digital advertising platform The Trade Desk (NASDAQ:TTD) beat Wall Street’s revenue expectations in Q4 CY2025, with sales up 14.3% year on year to $846.8 million. On the other hand, next quarter’s revenue guidance of $678 million was less impressive, coming in 1.5% below analysts’ estimates. Its non-GAAP profit of $0.59 per share was in line with analysts’ consensus estimates.
The Trade Desk (TTD) Q4 CY2025 Highlights:
- Revenue: $846.8 million vs analyst estimates of $841.9 million (14.3% year-on-year growth, 0.6% beat)
- Adjusted EPS: $0.59 vs analyst estimates of $0.58 (in line)
- Adjusted EBITDA: $400.3 million vs analyst estimates of $376.4 million (47.3% margin, 6.4% beat)
- Revenue Guidance for Q1 CY2026 is "at least" $678 million vs analyst estimates of $688.1 million
- EBITDA guidance for Q1 CY2026 is $195 million at the midpoint, below analyst estimates of $222.4 million
- Operating Margin: 30.3%, up from 26.4% in the same quarter last year
- Free Cash Flow Margin: 33.3%, up from 21% in the previous quarter
- Market Capitalization: $12.06 billion
Company Overview
Built as an alternative to "walled garden" advertising ecosystems, The Trade Desk (NASDAQ:TTD) provides a cloud-based platform that helps advertisers and agencies plan, manage, and optimize digital advertising campaigns across multiple channels and devices.
The company's self-service platform allows clients to execute advertising campaigns across various formats including connected television (CTV), display, audio, digital-out-of-home, native, and social media. What makes The Trade Desk's technology distinctive is its bid-factor architecture, which enables advertisers to define specific targeting parameters and values, allowing the platform to calculate the worth of ad impressions in real-time and bid only for optimal placements.
For example, a national retailer might use The Trade Desk to target consumers who have previously visited their website with video ads across streaming services, while simultaneously running audio ads on music platforms for users who match their target demographic profile. The platform's data management capabilities let advertisers incorporate both third-party and their own first-party data to refine targeting.
The Trade Desk generates revenue primarily by charging platform fees based on a percentage of clients' advertising spend, rather than through a traditional SaaS subscription model. The company also offers enhanced data services and platform features for additional fees. Its client base consists predominantly of advertising agencies and their clients, with the company maintaining master service agreements that provide ongoing platform access. The Trade Desk has expanded internationally beyond its U.S. origins to serve global advertising needs.
4. Advertising Software
The digital advertising market is large, growing, and becoming more diverse, both in terms of audiences and media. As a result, there is a growing need for software that enables advertisers to use data to automate and optimize ad placements.
The Trade Desk's primary competitors include Google's ad tech solutions, particularly Display & Video 360 (part of Google Marketing Platform), as well as Adobe's advertising cloud. The company also competes with demand-side platforms operated by various ad tech companies.
5. Revenue Growth
A company’s long-term sales performance can indicate its overall quality. Any business can put up a good quarter or two, but many enduring ones grow for years. Thankfully, The Trade Desk’s 28.2% annualized revenue growth over the last five years was impressive. Its growth surpassed the average software company and shows its offerings resonate with customers, a great starting point for our analysis.
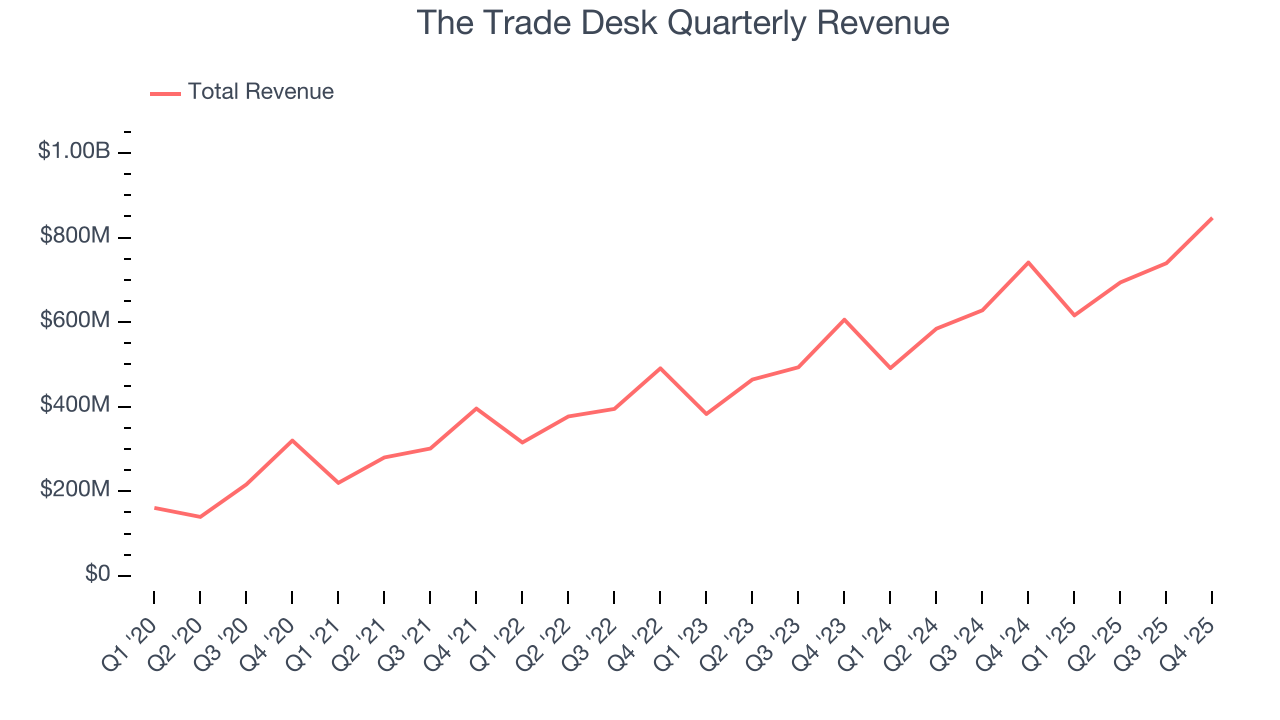
We at StockStory place the most emphasis on long-term growth, but within software, a half-decade historical view may miss recent innovations or disruptive industry trends. The Trade Desk’s annualized revenue growth of 22% over the last two years is below its five-year trend, but we still think the results suggest healthy demand. 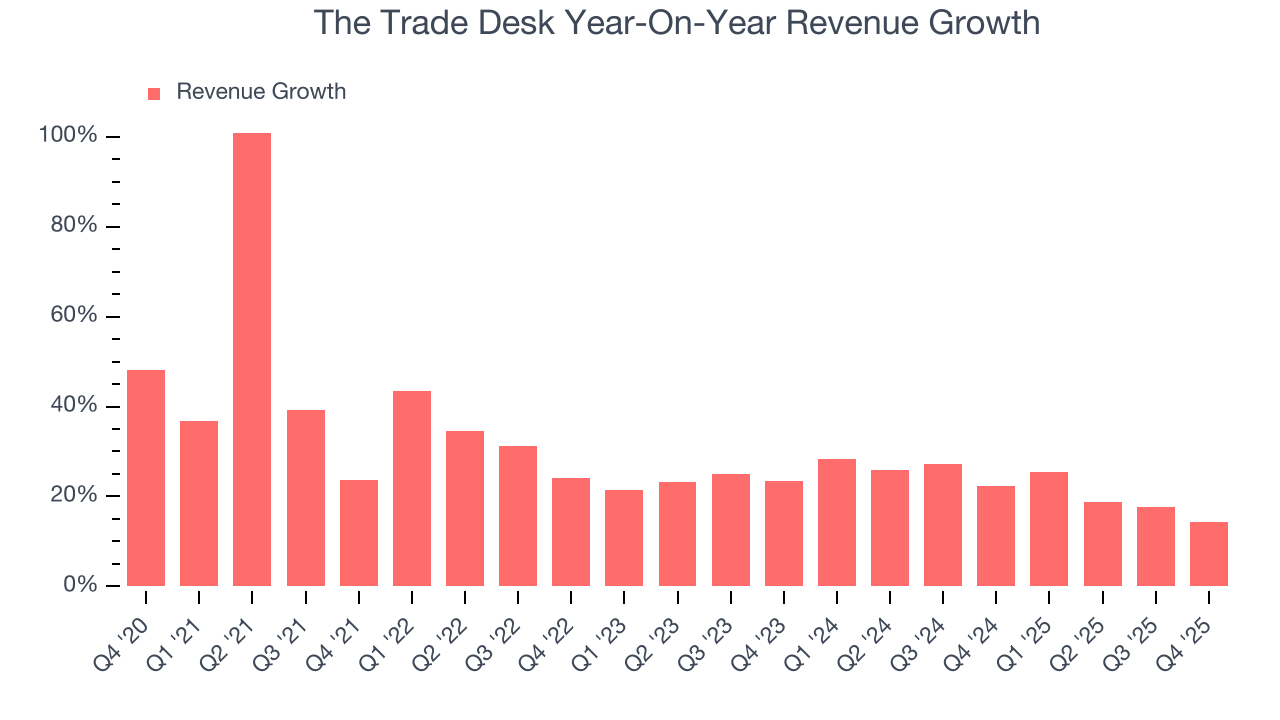
This quarter, The Trade Desk reported year-on-year revenue growth of 14.3%, and its $846.8 million of revenue exceeded Wall Street’s estimates by 0.6%. Company management is currently guiding for a 10.1% year-on-year increase in sales next quarter.
Looking further ahead, sell-side analysts expect revenue to grow 15.6% over the next 12 months, a deceleration versus the last two years. Despite the slowdown, this projection is above average for the sector and indicates the market is baking in some success for its newer products and services.
6. Billings
Billings is a non-GAAP metric that is often called “cash revenue” because it shows how much money the company has collected from customers in a certain period. This is different from revenue, which must be recognized in pieces over the length of a contract.
The Trade Desk’s billings punched in at $3.90 billion in Q4, and over the last four quarters, its growth slightly outpaced the sector as it averaged 16.4% year-on-year increases. This alternate topline metric grew slower than total sales, meaning the company recognizes revenue faster than it collects cash - a headwind for its liquidity that could also signal a slowdown in future revenue growth. 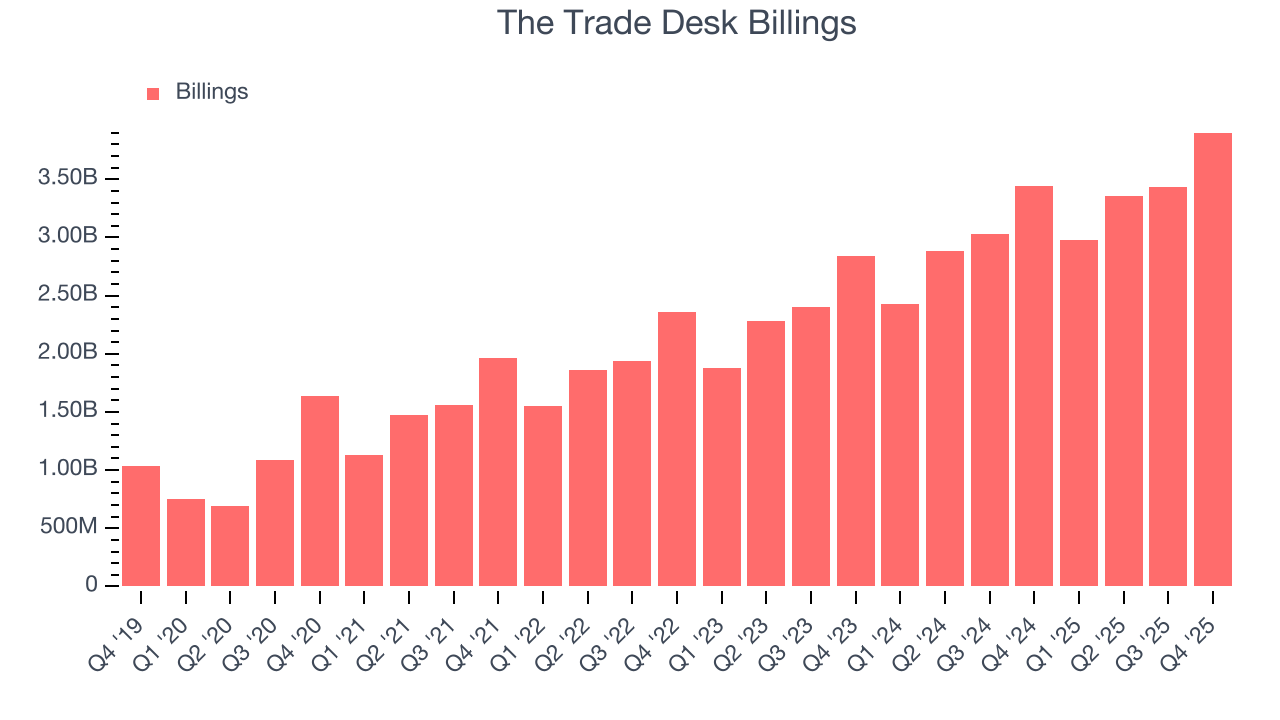
7. Customer Acquisition Efficiency
The customer acquisition cost (CAC) payback period measures the months a company needs to recoup the money spent on acquiring a new customer. This metric helps assess how quickly a business can break even on its sales and marketing investments.
The Trade Desk is extremely efficient at acquiring new customers, and its CAC payback period checked in at 5.5 months this quarter. The company’s rapid recovery of its customer acquisition costs indicates it has a highly differentiated product offering and a strong brand reputation. These dynamics give The Trade Desk more resources to pursue new product initiatives while maintaining the flexibility to increase its sales and marketing investments.
8. Gross Margin & Pricing Power
What makes the software-as-a-service model so attractive is that once the software is developed, it usually doesn’t cost much to provide it as an ongoing service. These minimal costs can include servers, licenses, and certain personnel.
The Trade Desk’s robust unit economics are better than the broader software industry, an output of its asset-lite business model and pricing power. They also enable the company to fund large investments in new products and sales during periods of rapid growth to achieve higher profits in the future. As you can see below, it averaged an excellent 78.6% gross margin over the last year. That means The Trade Desk only paid its providers $21.37 for every $100 in revenue.
The market not only cares about gross margin levels but also how they change over time because expansion creates firepower for profitability and free cash generation. The Trade Desk has seen gross margins decline by 2.6 percentage points over the last 2 year, which is among the worst in the software space.
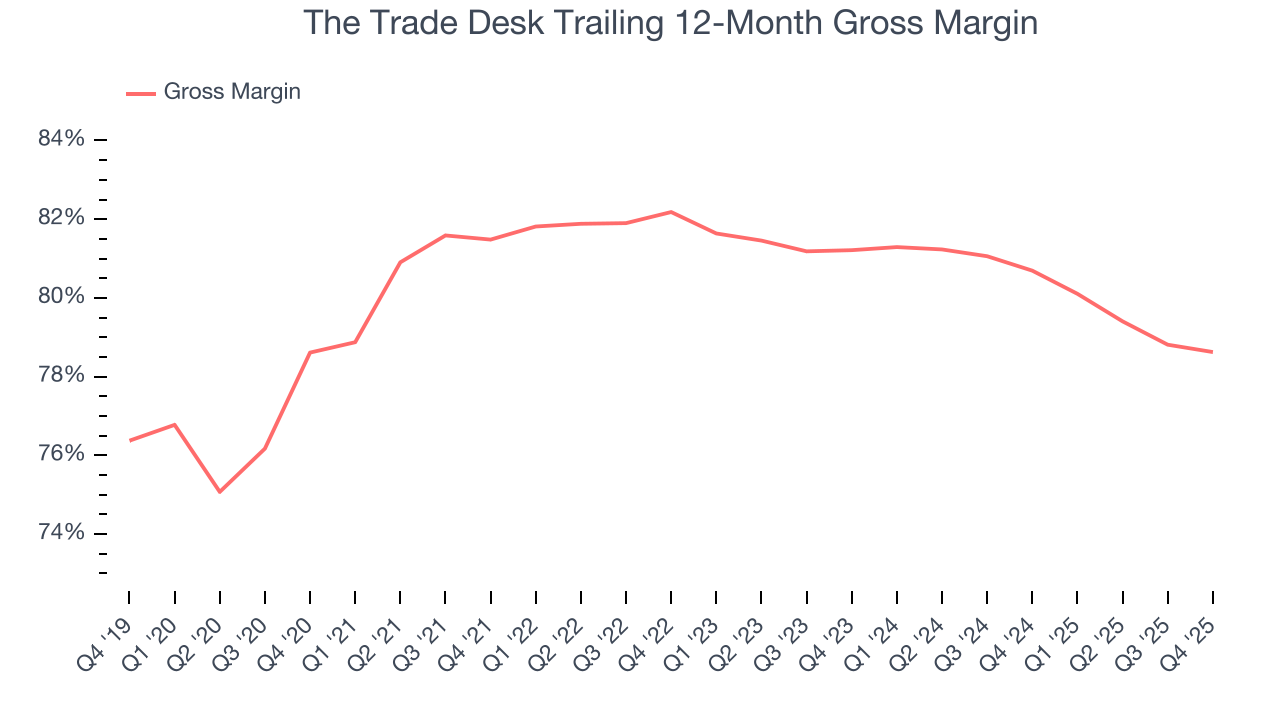
In Q4, The Trade Desk produced a 80.7% gross profit margin , marking a 1 percentage point decrease from 81.7% in the same quarter last year. The Trade Desk’s full-year margin has also been trending down over the past 12 months, decreasing by 2.1 percentage points. If this move continues, it could suggest a more competitive environment with some pressure to lower prices and higher input costs.
9. Operating Margin
Many software businesses adjust their profits for stock-based compensation (SBC), but we prioritize GAAP operating margin because SBC is a real expense used to attract and retain engineering and sales talent. This metric shows how much revenue remains after accounting for all core expenses – everything from the cost of goods sold to sales and R&D.
The Trade Desk has been a well-oiled machine over the last year. It demonstrated elite profitability for a software business, boasting an average operating margin of 20.3%. This result isn’t surprising as its high gross margin gives it a favorable starting point.
Looking at the trend in its profitability, The Trade Desk’s operating margin rose by 2.9 percentage points over the last two years, as its sales growth gave it operating leverage.

In Q4, The Trade Desk generated an operating margin profit margin of 30.3%, up 4 percentage points year on year. The increase was encouraging, and because its gross margin actually decreased, we can assume it was more efficient because its operating expenses like marketing, R&D, and administrative overhead grew slower than its revenue.
10. Cash Is King
Free cash flow isn't a prominently featured metric in company financials and earnings releases, but we think it's telling because it accounts for all operating and capital expenses, making it tough to manipulate. Cash is king.
The Trade Desk has shown robust cash profitability, driven by its attractive business model and cost-effective customer acquisition strategy that enable it to invest in new products and services rather than sales and marketing. The company’s free cash flow margin averaged 27% over the last year, quite impressive for a software business.
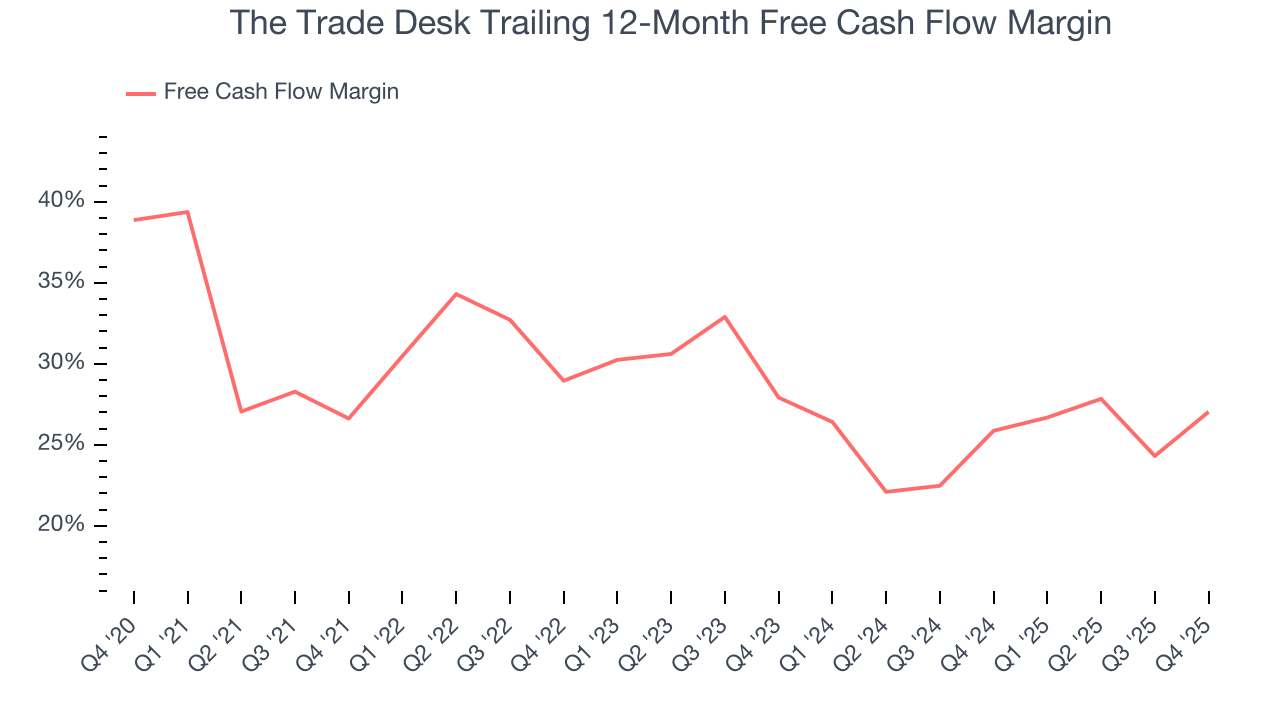
The Trade Desk’s free cash flow clocked in at $281.6 million in Q4, equivalent to a 33.3% margin. This result was good as its margin was 9.4 percentage points higher than in the same quarter last year. Its cash profitability was also above its one-year level, and we hope the company can build on this trend.
Over the next year, analysts’ consensus estimates show they’re expecting The Trade Desk’s free cash flow margin of 27% for the last 12 months to remain the same.
11. Balance Sheet Assessment
Businesses that maintain a cash surplus face reduced bankruptcy risk.
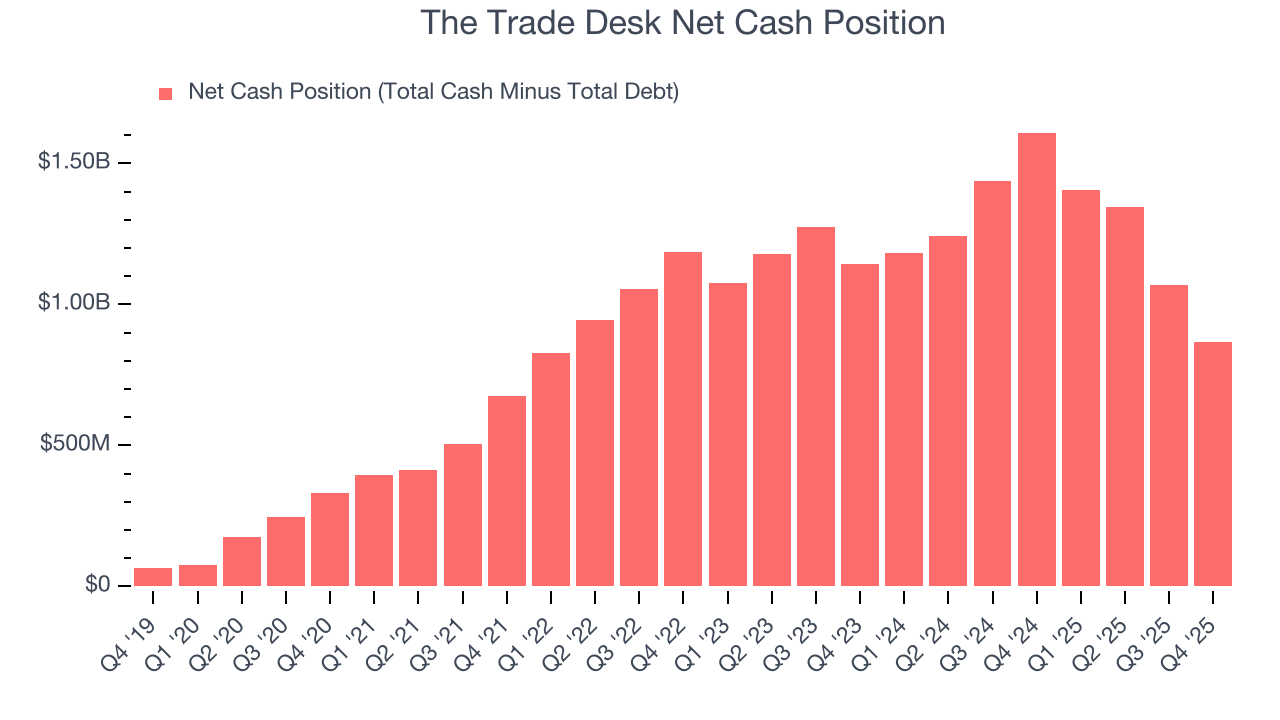
The Trade Desk is a profitable, well-capitalized company with $1.30 billion of cash and $436.3 million of debt on its balance sheet. This $866.7 million net cash position is 7.2% of its market cap and gives it the freedom to borrow money, return capital to shareholders, or invest in growth initiatives. Leverage is not an issue here.
12. Key Takeaways from The Trade Desk’s Q4 Results
We enjoyed seeing The Trade Desk beat analysts’ EBITDA expectations this quarter. On the other hand, its revenue guidance for next quarter slightly missed and its EBITDA guidance for next quarter also fell short of Wall Street’s estimates. Overall, this was a softer quarter that is not convincing enough after a few uneven quarters from the company that have led to fears that competition is hurting The Trade Desk or that its AI capabilities are falling behind. The stock traded down 15.6% to $21.41 immediately after reporting.
13. Is Now The Time To Buy The Trade Desk?
Updated: March 15, 2026 at 10:04 PM EDT
Before investing in or passing on The Trade Desk, we urge you to understand the company’s business quality (or lack thereof), valuation, and the latest quarterly results - in that order.
The Trade Desk is an amazing business ranking highly on our list. For starters, its revenue growth was strong over the last five years. And while its expanding operating margin shows it’s becoming more efficient at building and selling its software, its efficient sales strategy allows it to target and onboard new users at scale. Additionally, The Trade Desk’s impressive operating margins show it has a highly efficient business model.
The Trade Desk’s price-to-sales ratio based on the next 12 months is 3.9x. Looking across the spectrum of software companies today, The Trade Desk’s fundamentals shine bright. We like the stock at this price.
Wall Street analysts have a consensus one-year price target of $32.64 on the company (compared to the current share price of $27.22), implying they see 19.9% upside in buying The Trade Desk in the short term.