
BJ's (BJ)
BJ's doesn’t excite us. Its weak sales growth and low returns on capital show it struggled to generate demand and profits.― StockStory Analyst Team
1. News
2. Summary
Why We Think BJ's Will Underperform
Appealing to the budget-conscious individual shopping for a household, BJ’s Wholesale Club (NYSE:BJ) is a membership-only retail chain that sells groceries, appliances, electronics, and household items, often in bulk quantities.
- Commoditized inventory, bad unit economics, and high competition are reflected in its low gross margin of 18.5%
- Responsiveness to unforeseen market trends is restricted due to its substandard operating margin profitability
- Rollout of new stores raises questions since current locations haven’t demonstrated acceptable same-store sales growth


BJ's falls short of our quality standards. We see more attractive opportunities in the market.
Why There Are Better Opportunities Than BJ's


BJ’s stock price of $97.08 implies a valuation ratio of 21.4x forward P/E. This multiple rich for the business quality. Not a great combination.
Paying up for elite businesses with strong earnings potential is better than investing in lower-quality companies with shaky fundamentals. That’s how you avoid big downside over the long term.
3. BJ's (BJ) Research Report: Q4 CY2025 Update
Membership-only discount retailer BJ’s Wholesale Club (NYSE:BJ) met Wall Street’s revenue expectations in Q4 CY2025, with sales up 5.6% year on year to $5.58 billion. Its non-GAAP profit of $0.96 per share was 3.3% above analysts’ consensus estimates.
BJ's (BJ) Q4 CY2025 Highlights:
- Revenue: $5.58 billion vs analyst estimates of $5.55 billion (5.6% year-on-year growth, in line)
- Adjusted EPS: $0.96 vs analyst estimates of $0.93 (3.3% beat)
- Adjusted EPS guidance for the upcoming financial year 2026 is $4.50 at the midpoint, missing analyst estimates by 3.4%
- Operating Margin: 3.2%, in line with the same quarter last year
- Free Cash Flow Margin: 3.4%, up from 2.1% in the same quarter last year
- Locations: 263 at quarter end, up from 250 in the same quarter last year
- Same-Store Sales rose 1.6% year on year (4% in the same quarter last year)
- Market Capitalization: $13.08 billion
Company Overview
Appealing to the budget-conscious individual shopping for a household, BJ’s Wholesale Club (NYSE:BJ) is a membership-only retail chain that sells groceries, appliances, electronics, and household items, often in bulk quantities.
The company offers these products at lower prices than traditional retailers. In return, customers often have to buy in bulk. BJ’s is able to offer low prices due to its merchandising and purchasing approaches. By offering a more limited selection within categories, it is able to buy larger quantities of what it does carry. This ensures volume discounts from suppliers and lower logistics costs per unit. BJ’s stores also have a no-frills warehouse format that minimizes store operating costs.
BJ’s core customer is the value-conscious suburban shopper who is willing to buy in bulk to save money. These customers must pay for an annual membership, as non-members are not allowed to enter the company’s stores.
The typical BJ’s store is roughly 130,000 square feet. The entrance usually features a customer service desk for membership inquiries, followed by featured bulk items. Beyond this is typically a grocery section, and BJ’s differentiates itself with more fresh food than a typical membership warehouse retailer. Additional sections may include apparel, electronics, and home goods situated towards the back of the store.
4. Large-format Grocery & General Merchandise Retailer
Big-box retailers operate large stores that sell groceries and general merchandise at highly competitive prices. Because of their scale and resulting purchasing power, these big-box retailers–with annual sales in the tens to hundreds of billions of dollars–are able to get attractive volume discounts and sell at often the lowest prices. While e-commerce is a threat, these retailers have been able to weather the storm by either providing a unique in-store shopping experience or by reinvesting their hefty profits into omnichannel investments.
Competitors that offer groceries and/or other general merchandise in large-format stores include Costco (NASDAQ:COST), Walmart (NYSE:WMT), and Kroger (NYSE:KR).
5. Revenue Growth
A company’s long-term performance is an indicator of its overall quality. Any business can put up a good quarter or two, but the best consistently grow over the long haul.
With $21.46 billion in revenue over the past 12 months, BJ's is one of the larger companies in the consumer retail industry and benefits from a well-known brand that influences purchasing decisions. However, its scale is a double-edged sword because there is only so much real estate to build new stores, placing a ceiling on its growth. To accelerate sales, BJ's likely needs to optimize its pricing or lean into international expansion.
As you can see below, BJ’s 3.6% annualized revenue growth over the last three years was sluggish as it barely increased sales at existing, established locations.
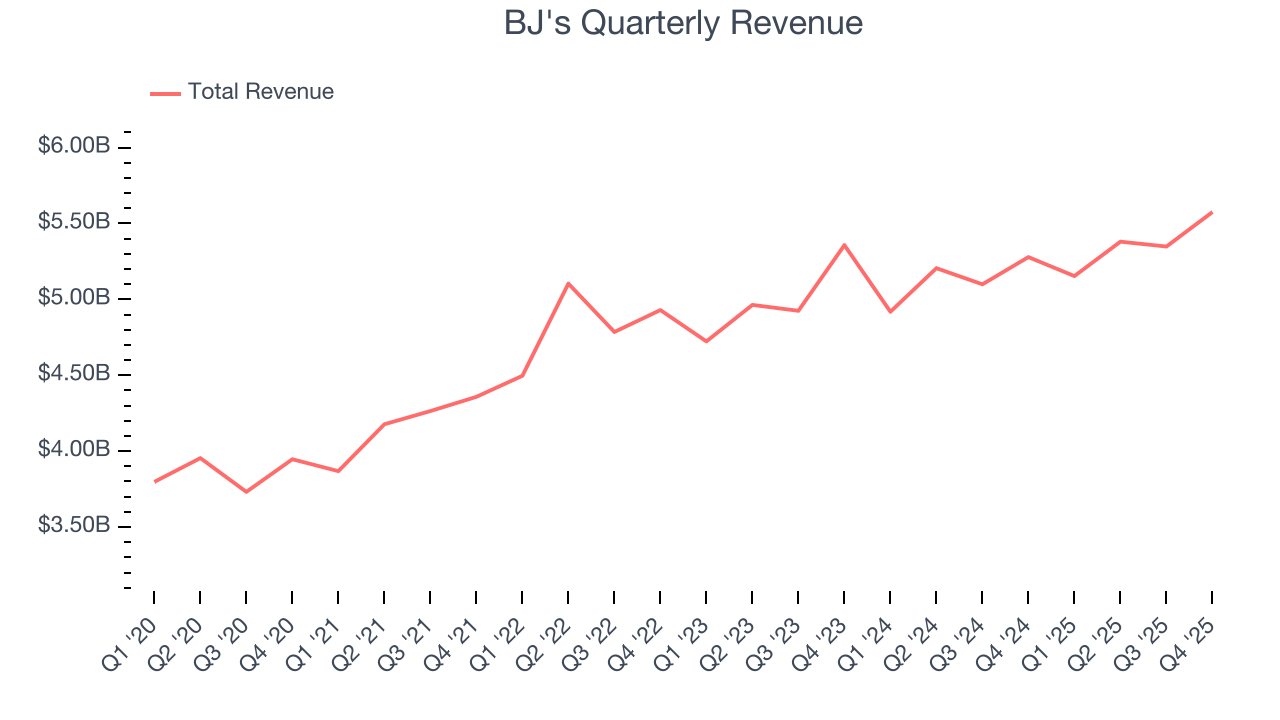
This quarter, BJ's grew its revenue by 5.6% year on year, and its $5.58 billion of revenue was in line with Wall Street’s estimates.
Looking ahead, sell-side analysts expect revenue to grow 6.1% over the next 12 months, an acceleration versus the last three years. This projection is particularly noteworthy for a company of its scale and suggests its newer products will spur better top-line performance.
6. Store Performance
Number of Stores
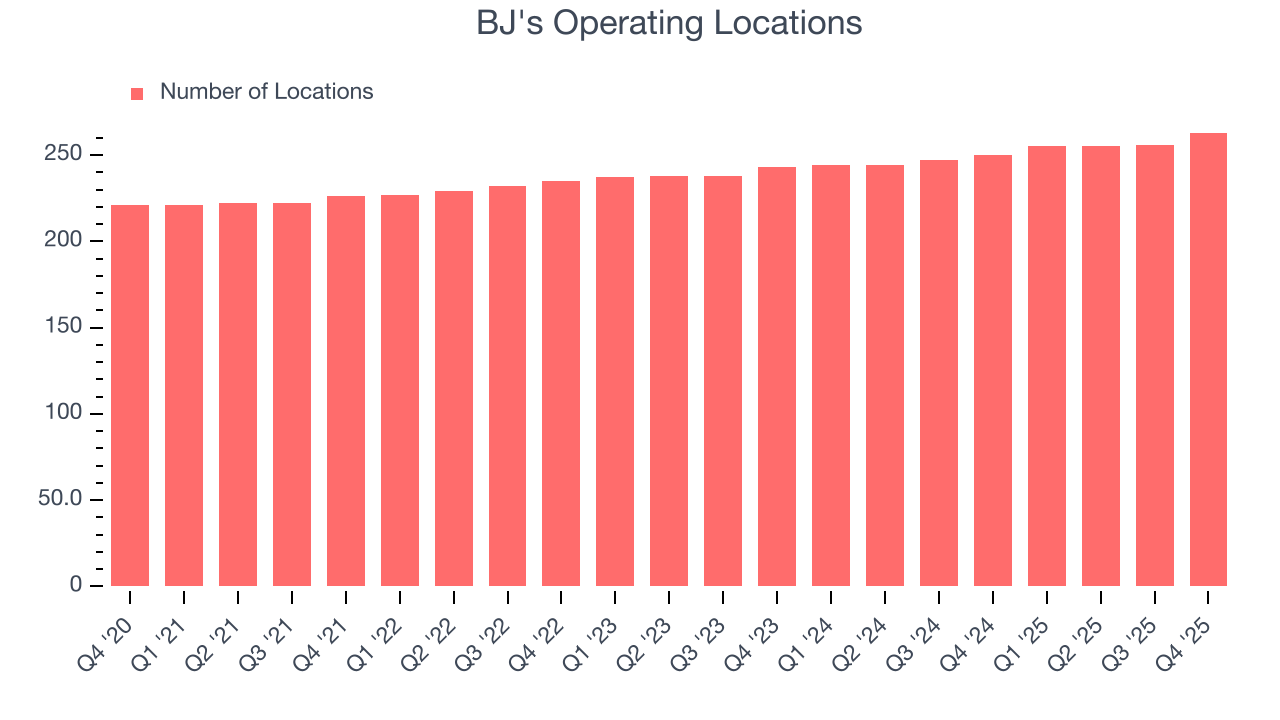
A retailer’s store count often determines how much revenue it can generate.
BJ's sported 263 locations in the latest quarter. Over the last two years, it has opened new stores quickly, averaging 3.7% annual growth. This was faster than the broader consumer retail sector.
When a retailer opens new stores, it usually means it’s investing for growth because demand is greater than supply, especially in areas where consumers may not have a store within reasonable driving distance.
Same-Store Sales
The change in a company's store base only tells one side of the story. The other is the performance of its existing locations and e-commerce sales, which informs management teams whether they should expand or downsize their physical footprints. Same-store sales provides a deeper understanding of this issue because it measures organic growth at brick-and-mortar shops for at least a year.
BJ’s demand within its existing locations has been relatively stable over the last two years but was below most retailers. On average, the company’s same-store sales have grown by 1.8% per year. This performance suggests it should consider improving its foot traffic and efficiency before expanding its store base.
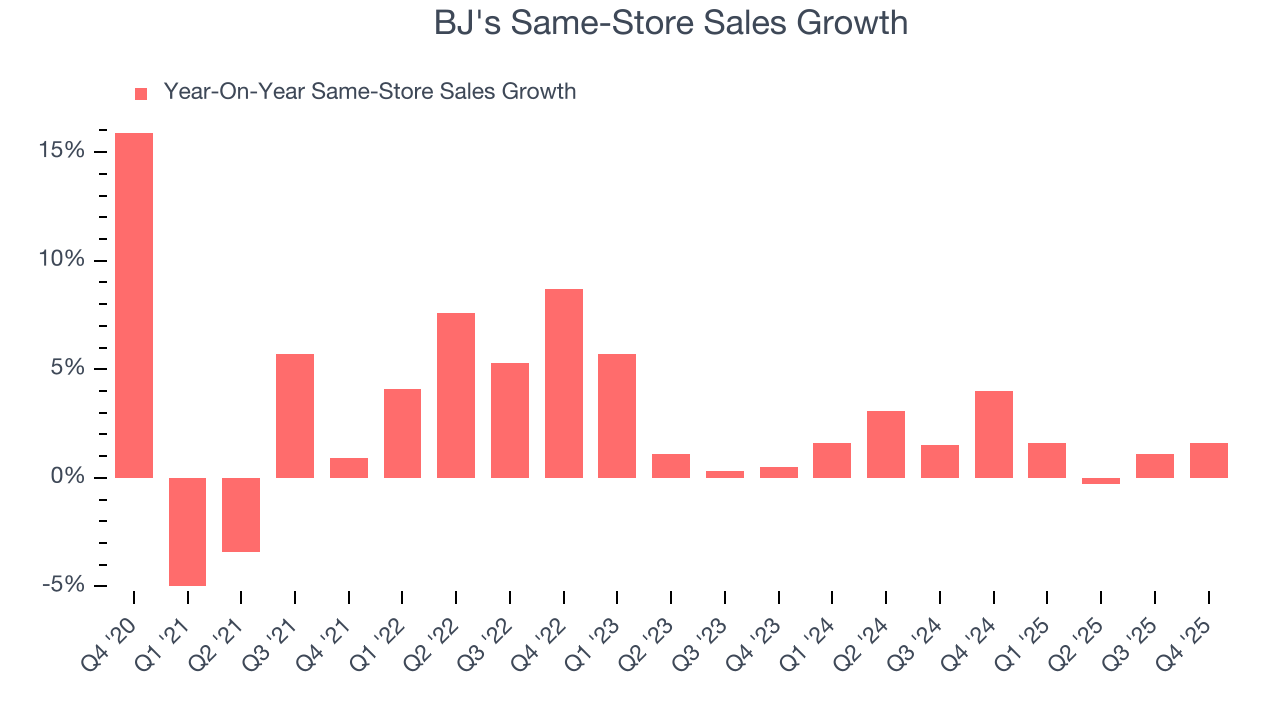
In the latest quarter, BJ’s same-store sales rose 1.6% year on year. This performance was more or less in line with its historical levels.
7. Gross Margin & Pricing Power
At StockStory, we prefer high gross margin businesses because they indicate pricing power or differentiated products, giving the company a chance to generate higher operating profits.
BJ's has bad unit economics for a retailer, signaling it operates in a competitive market and lacks pricing power because its inventory is sold in many places. As you can see below, it averaged a 18.5% gross margin over the last two years.
Non-discretionary retailers, however, must be viewed through a different lens because they compete on the lowest price, sell products easily found elsewhere, and have high transportation costs to move goods. These dynamics lead to structurally lower gross margins, so the best metrics to assess them are free cash flow margin, operating leverage, and profit volatility, which account for their scale advantages and non-cyclical demand.
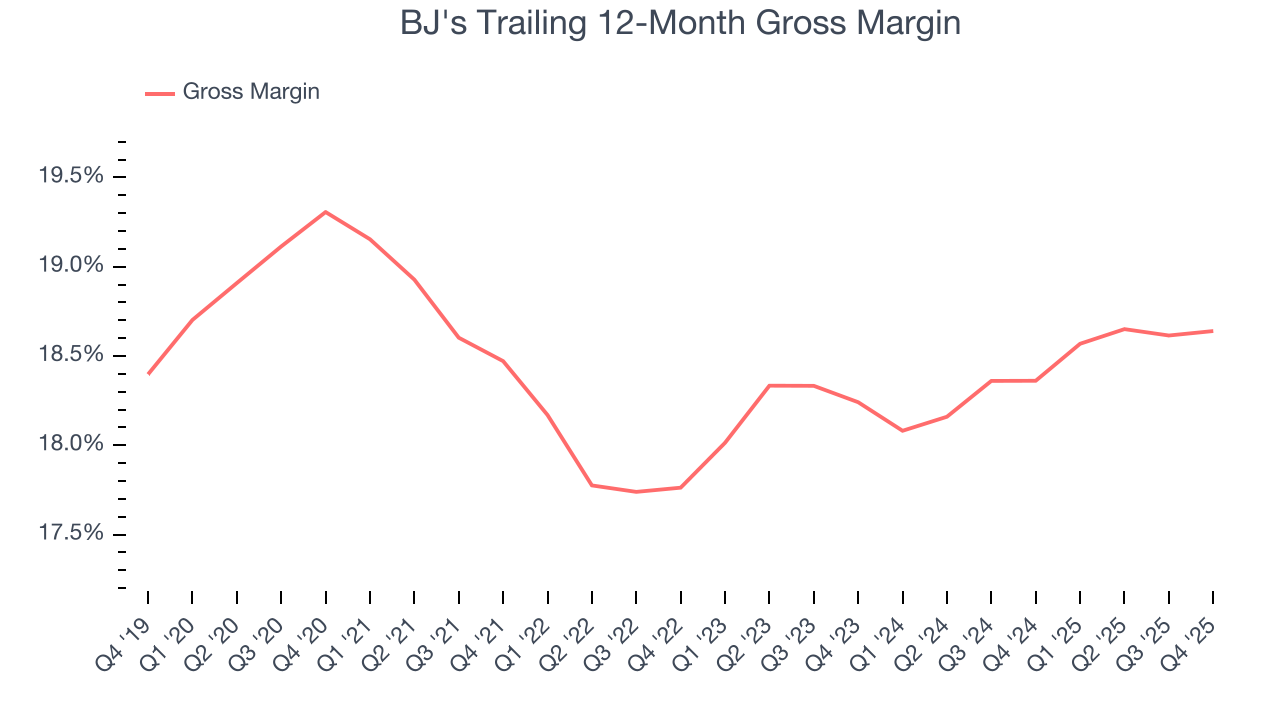
BJ's produced a 18.1% gross profit margin in Q4, in line with the same quarter last year. On a wider time horizon, the company’s full-year margin has remained steady over the past four quarters, suggesting it strives to keep prices low for customers and has stable input costs (such as labor and freight expenses to transport goods).
8. Operating Margin
BJ’s operating margin has more or less stayed the same over the last 12 months , averaging 3.8% over the last two years. This profitability was lousy for a consumer retail business and caused by its suboptimal cost structureand low gross margin.
Analyzing the trend in its profitability, BJ’s operating margin might fluctuated slightly but has generally stayed the same over the last year. This raises questions about the company’s expense base because its revenue growth should have given it leverage on its fixed costs, resulting in better economies of scale and profitability.
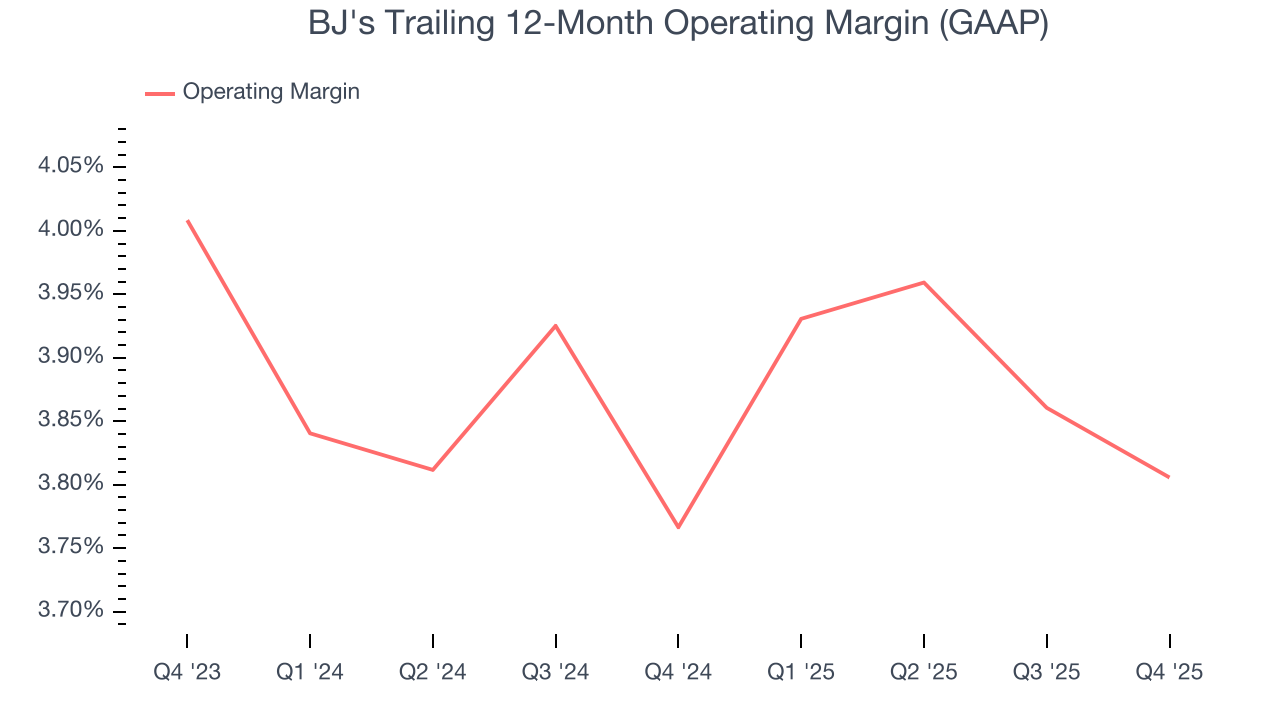
In Q4, BJ's generated an operating margin profit margin of 3.2%, in line with the same quarter last year. This indicates the company’s cost structure has recently been stable.
9. Earnings Per Share
Revenue trends explain a company’s historical growth, but the long-term change in earnings per share (EPS) points to the profitability of that growth – for example, a company could inflate its sales through excessive spending on advertising and promotions.
BJ’s unimpressive 3.9% annual EPS growth over the last three years aligns with its revenue performance. This tells us it maintained its per-share profitability as it expanded.
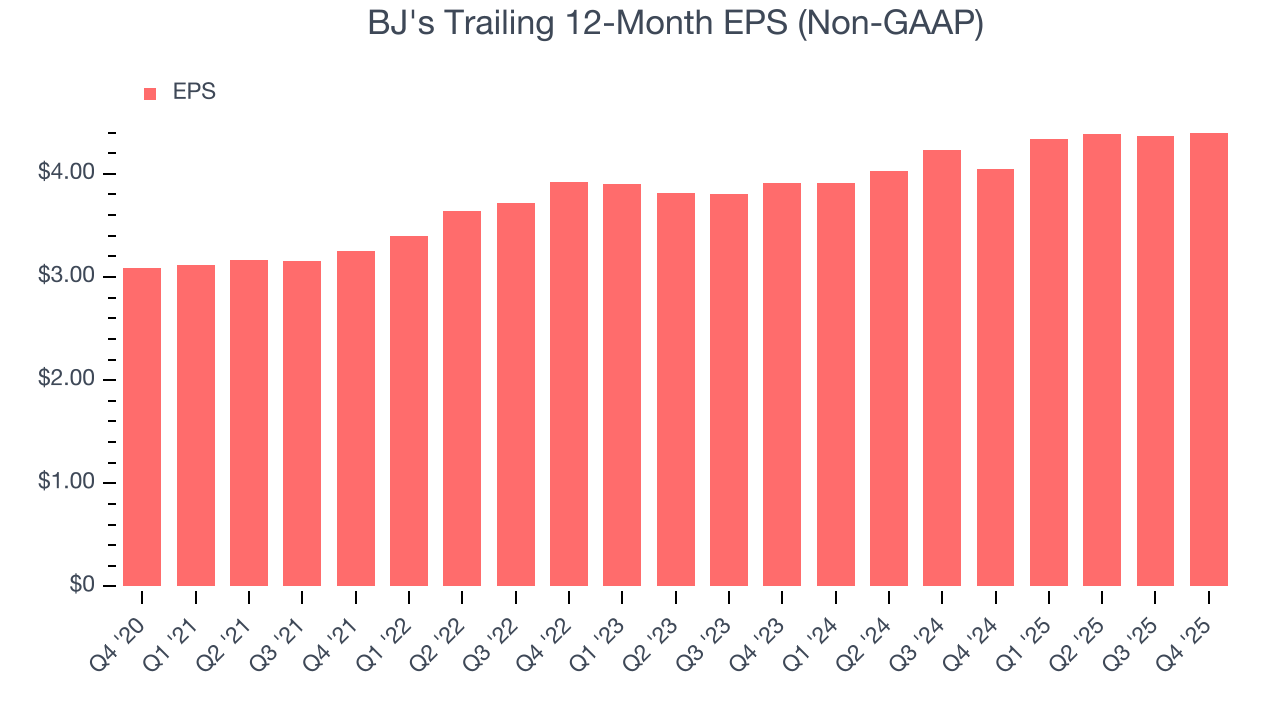
In Q4, BJ's reported adjusted EPS of $0.96, up from $0.93 in the same quarter last year. This print beat analysts’ estimates by 3.3%. Over the next 12 months, Wall Street expects BJ’s full-year EPS of $4.40 to grow 5.9%.
10. Cash Is King
If you’ve followed StockStory for a while, you know we emphasize free cash flow. Why, you ask? We believe that in the end, cash is king, and you can’t use accounting profits to pay the bills.
BJ's has shown mediocre cash profitability relative to peers over the last two years, giving the company fewer opportunities to return capital to shareholders. Its free cash flow margin averaged 1.5%, below what we’d expect for a consumer retail business.
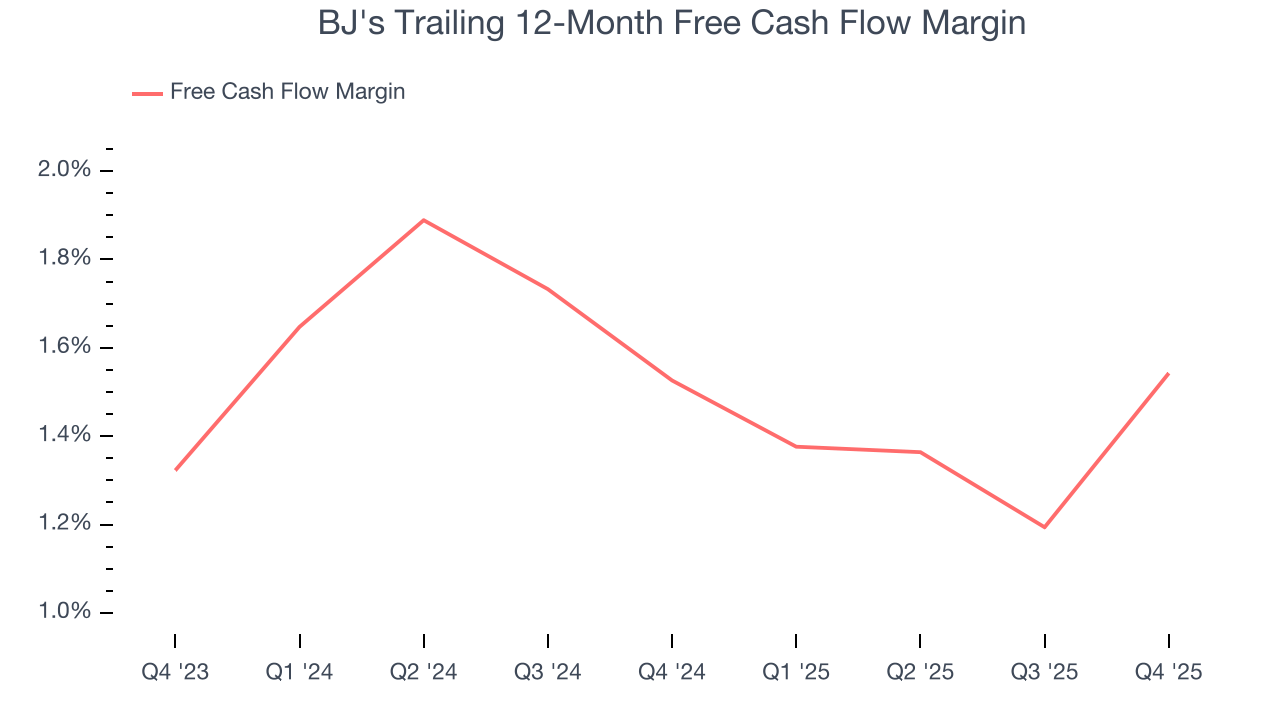
BJ’s free cash flow clocked in at $189.9 million in Q4, equivalent to a 3.4% margin. This result was good as its margin was 1.3 percentage points higher than in the same quarter last year, but we wouldn’t put too much weight on the short term because investment needs can be seasonal, causing temporary swings. Long-term trends trump fluctuations.
11. Return on Invested Capital (ROIC)
EPS and free cash flow tell us whether a company was profitable while growing its revenue. But was it capital-efficient? Enter ROIC, a metric showing how much operating profit a company generates relative to the money it has raised (debt and equity).
BJ's historically did a mediocre job investing in profitable growth initiatives. Its five-year average ROIC was 13.7%, somewhat low compared to the best consumer retail companies that consistently pump out 25%+.
12. Balance Sheet Assessment
BJ's reported $46.25 million of cash and $2.61 billion of debt on its balance sheet in the most recent quarter. As investors in high-quality companies, we primarily focus on two things: 1) that a company’s debt level isn’t too high and 2) that its interest payments are not excessively burdening the business.
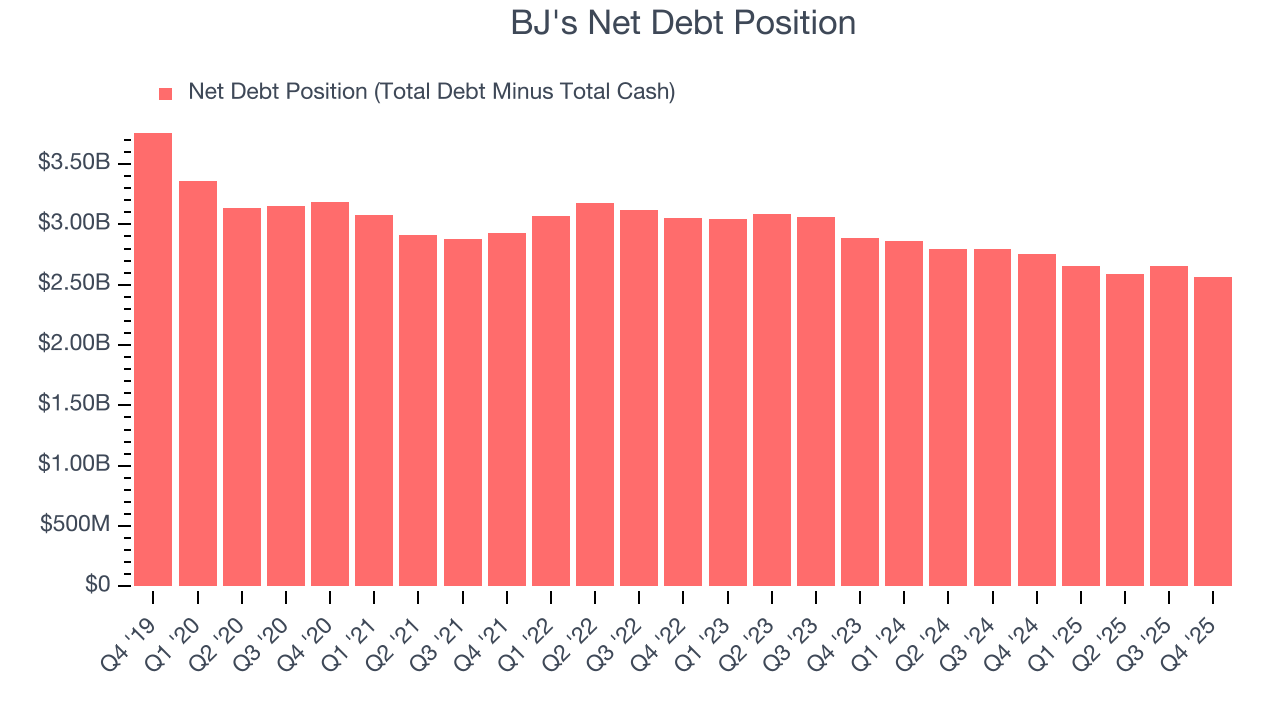
With $1.12 billion of EBITDA over the last 12 months, we view BJ’s 2.3× net-debt-to-EBITDA ratio as safe. We also see its $21.21 million of annual interest expenses as appropriate. The company’s profits give it plenty of breathing room, allowing it to continue investing in growth initiatives.
13. Key Takeaways from BJ’s Q4 Results
It was good to see BJ's narrowly top analysts’ gross margin expectations this quarter. We were also happy its revenue was in line with Wall Street’s estimates. On the other hand, its full-year EPS guidance missed. Overall, this was a weaker quarter. The stock traded down 3.1% to $96.90 immediately following the results.
14. Is Now The Time To Buy BJ's?
Updated: March 20, 2026 at 10:46 PM EDT
When considering an investment in BJ's, investors should account for its valuation and business qualities as well as what’s happened in the latest quarter.
BJ's isn’t a terrible business, but it isn’t one of our picks. To kick things off, its revenue growth was uninspiring over the last three years. While its expanding store base shows it’s playing offense to grow its brand, the downside is its gross margins make it more challenging to reach positive operating profits compared to other consumer retail businesses. On top of that, its operating margins reveal poor profitability compared to other retailers.
BJ’s P/E ratio based on the next 12 months is 21.4x. Beauty is in the eye of the beholder, but our analysis shows the upside isn’t great compared to the potential downside. We're fairly confident there are better stocks to buy right now.
Wall Street analysts have a consensus one-year price target of $104.85 on the company (compared to the current share price of $97.08).