
Elastic (ESTC)
Elastic doesn’t excite us. Its revenue growth has decelerated and its historical operating losses don’t give us confidence in a turnaround.― StockStory Analyst Team
1. News


2. Summary
Why Elastic Is Not Exciting
Built on the powerful open-source Elasticsearch technology that powers search functionality for thousands of websites worldwide, Elastic (NYSE:ESTC) provides a search and AI platform that helps organizations find insights from their data, monitor applications, and protect against security threats.
- Operating profits and efficiency rose over the last year as it benefited from some fixed cost leverage
- Offerings struggled to generate meaningful interest as its average billings growth of 12.5% over the last year did not impress
- On the plus side, its 24.8% annual revenue growth over the last five years surpassed the sector average as its software resonated with customers


Elastic doesn’t pass our quality test. There’s a wealth of better opportunities.
Why There Are Better Opportunities Than Elastic


Elastic is trading at $50.90 per share, or 2.8x forward price-to-sales. Elastic’s valuation may seem like a bargain, but we think there are valid reasons why it’s so cheap.
It’s better to pay up for high-quality businesses with higher long-term earnings potential rather than to buy lower-quality stocks because they appear cheap. These challenged businesses often don’t re-rate, a phenomenon known as a “value trap”.
3. Elastic (ESTC) Research Report: Q4 CY2025 Update
Search AI platform provider Elastic (NYSE:ESTC) reported revenue ahead of Wall Street’s expectations in Q4 CY2025, with sales up 17.7% year on year to $449.9 million. Guidance for next quarter’s revenue was better than expected at $446 million at the midpoint, 0.8% above analysts’ estimates. Its non-GAAP profit of $0.73 per share was 13% above analysts’ consensus estimates.
Elastic (ESTC) Q4 CY2025 Highlights:
- Revenue: $449.9 million vs analyst estimates of $438.4 million (17.7% year-on-year growth, 2.6% beat)
- Adjusted EPS: $0.73 vs analyst estimates of $0.65 (13% beat)
- Adjusted Operating Income: $83.5 million vs analyst estimates of $76.79 million (18.6% margin, 8.7% beat)
- Revenue Guidance for Q1 CY2026 is $446 million at the midpoint, above analyst estimates of $442.4 million
- Subscription Revenue Growth Guidance for Q1 CY2026 is 15% constant-currency growth year-on-year
- Management raised its full-year Adjusted EPS guidance to $2.52 at the midpoint, a 3.7% increase
- Operating Margin: 0.1%, up from -1.2% in the same quarter last year
- Free Cash Flow Margin: 11.9%, up from 6.1% in the previous quarter
- Net Revenue Retention Rate: 112%, in line with the previous quarter
- Billings: $520.8 million at quarter end, up 15.3% year on year
- Market Capitalization: $6.11 billion
Company Overview
Built on the powerful open-source Elasticsearch technology that powers search functionality for thousands of websites worldwide, Elastic (NYSE:ESTC) provides a search and AI platform that helps organizations find insights from their data, monitor applications, and protect against security threats.
Elastic's platform is centered around three main solutions: Search, Observability, and Security. The Search solution enables organizations to build AI-powered search applications that can retrieve information across vast datasets, powering everything from website search to customer support portals. The Observability solution helps IT teams monitor and troubleshoot their applications, infrastructure, and networks by collecting and analyzing logs, metrics, and performance data. The Security solution provides threat detection and response capabilities to protect against cyber attacks.
At the core of Elastic's offerings is the Elastic Stack, which includes Elasticsearch (a highly scalable search engine and data store), Kibana (a visualization and management interface), and data collection tools like Elastic Agent and Logstash. The company has enhanced these tools with AI and machine learning capabilities, including support for vector search and large language models, allowing customers to build generative AI applications with their own data.
Customers can deploy Elastic's software in multiple ways: as a fully-managed service called Elastic Cloud hosted on major public cloud providers like AWS, Google Cloud, and Microsoft Azure; or as self-managed software in their own environments. Elastic employs a "freemium" business model, offering basic features for free to build community adoption while charging subscription fees for advanced features and hosted services. This approach has helped the company build a customer base of approximately 21,000 organizations across industries ranging from technology and finance to healthcare and government.
4. Data Infrastructure
Generating insights from system level data is an increasing priority for most businesses, but to do so requires connecting and analyzing piles of data stored and siloed in separate databases. This is the demand driver for cloud based data infrastructure software providers, who can more readily integrate, distribute and process information vs. legacy on-premise software providers.
Elastic competes with various companies across its solution areas, including Splunk (owned by Cisco Systems), Datadog (NASDAQ:DDOG), and Dynatrace (NYSE:DT) in observability; CrowdStrike (NASDAQ:CRWD) and Microsoft's Azure Sentinel (NASDAQ:MSFT) in security; and Algolia, Lucidworks, and Google (NASDAQ:GOOGL) in search applications.
5. Revenue Growth
A company’s long-term sales performance is one signal of its overall quality. Any business can have short-term success, but a top-tier one grows for years. Luckily, Elastic’s sales grew at a solid 24.8% compounded annual growth rate over the last five years. Its growth beat the average software company and shows its offerings resonate with customers.
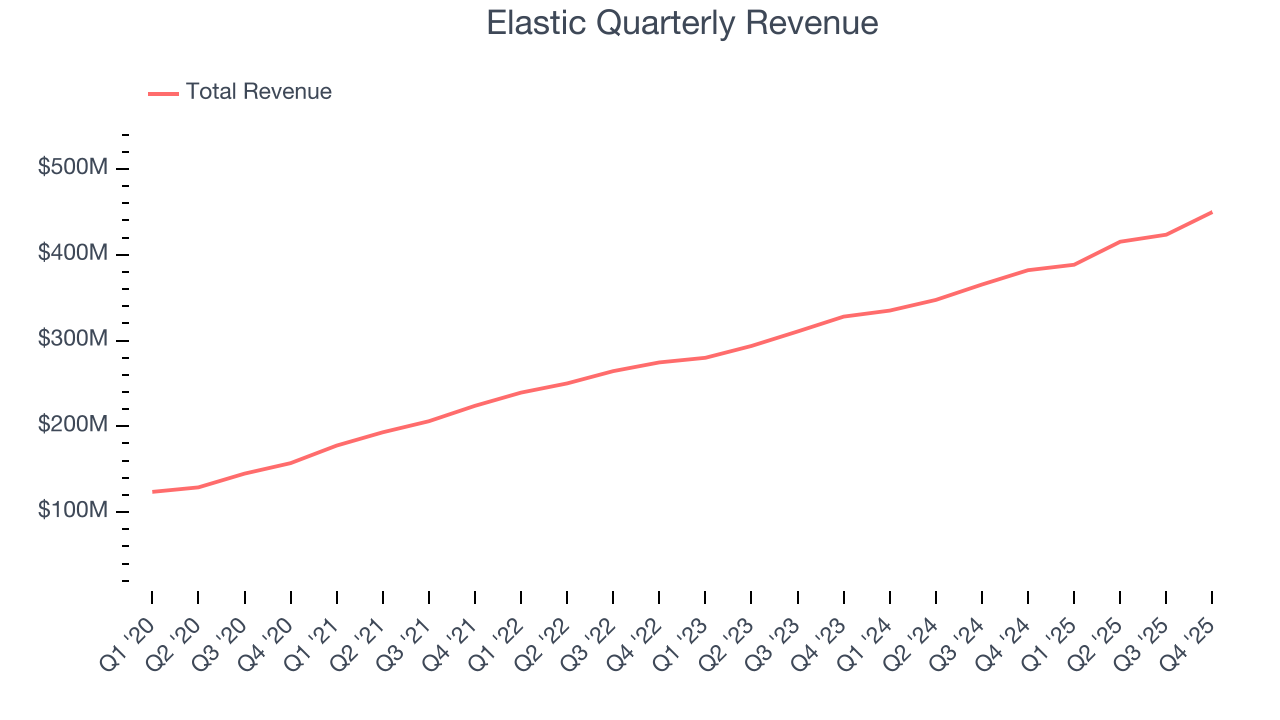
We at StockStory place the most emphasis on long-term growth, but within software, a half-decade historical view may miss recent innovations or disruptive industry trends. Elastic’s annualized revenue growth of 17.6% over the last two years is below its five-year trend, but we still think the results suggest healthy demand. 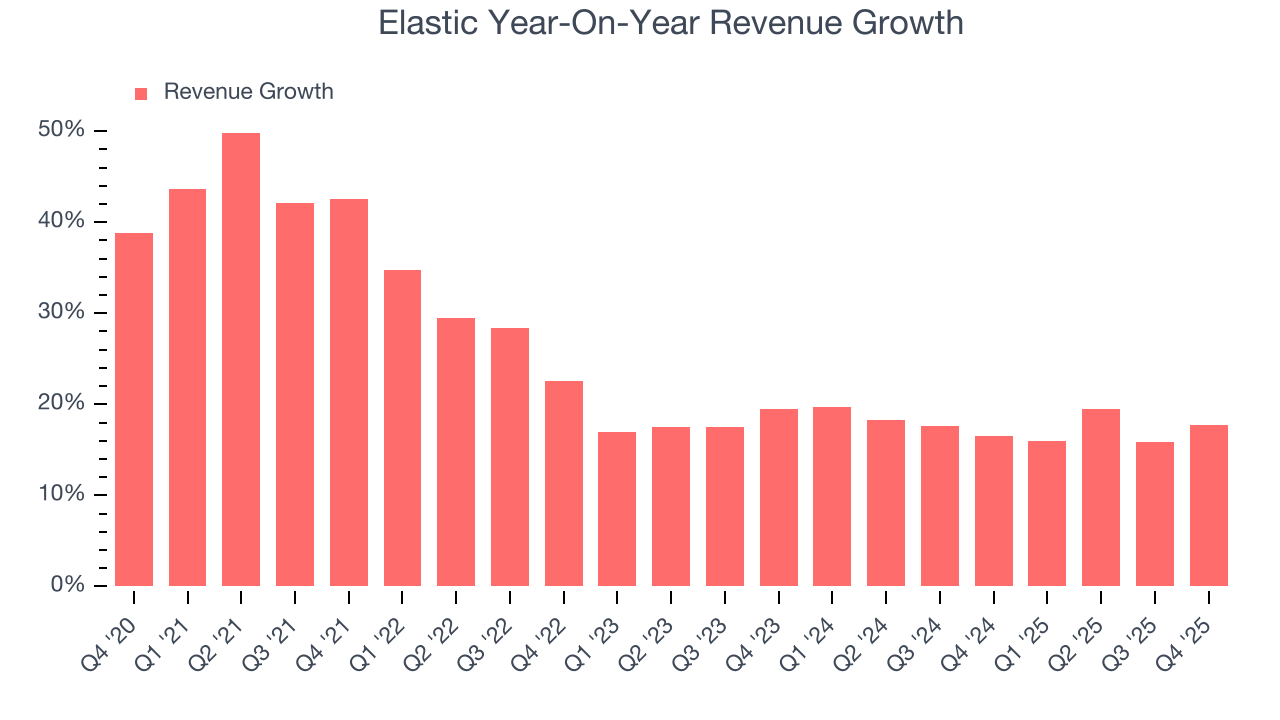
This quarter, Elastic reported year-on-year revenue growth of 17.7%, and its $449.9 million of revenue exceeded Wall Street’s estimates by 2.6%. Company management is currently guiding for a 14.8% year-on-year increase in sales next quarter.
Looking further ahead, sell-side analysts expect revenue to grow 12.6% over the next 12 months, a deceleration versus the last two years. This projection doesn't excite us and suggests its products and services will see some demand headwinds.
6. Billings
Billings is a non-GAAP metric that is often called “cash revenue” because it shows how much money the company has collected from customers in a certain period. This is different from revenue, which must be recognized in pieces over the length of a contract.
Elastic’s billings came in at $520.8 million in Q4, and over the last four quarters, its growth was underwhelming as it averaged 12.5% year-on-year increases. This alternate topline metric grew slower than total sales, meaning the company recognizes revenue faster than it collects cash - a headwind for its liquidity that could also signal a slowdown in future revenue growth. 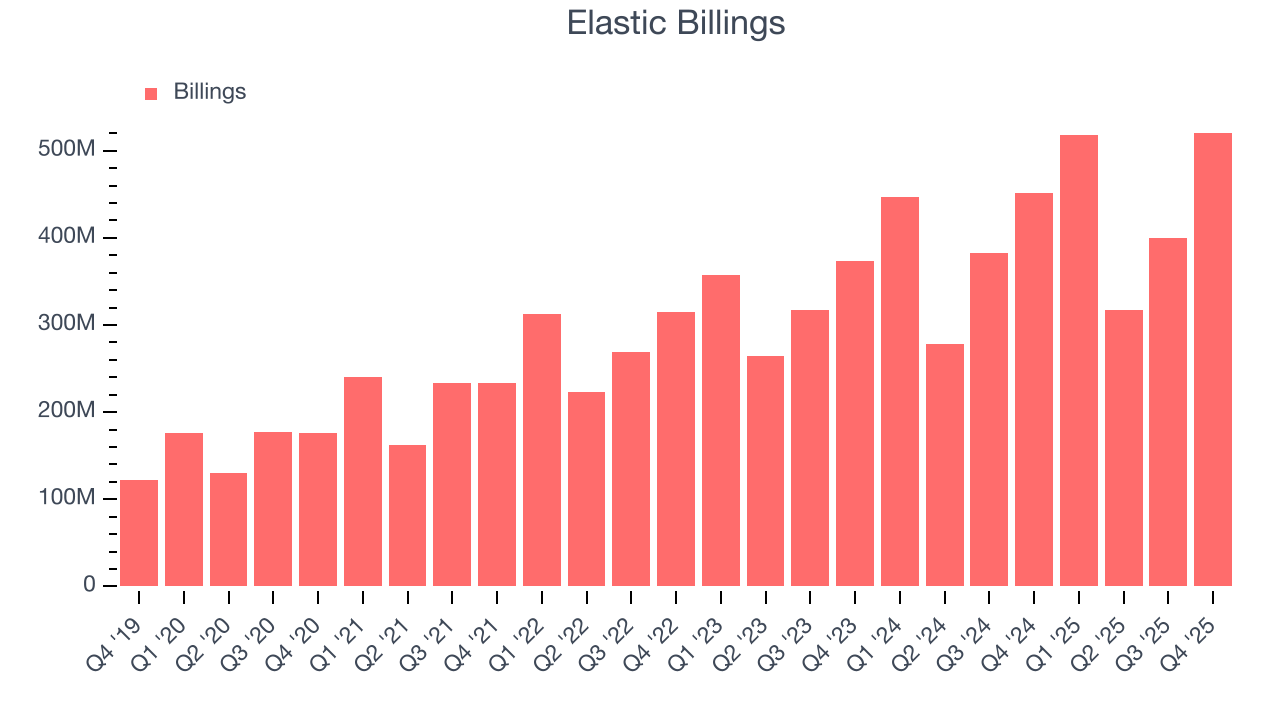
7. Customer Acquisition Efficiency
The customer acquisition cost (CAC) payback period represents the months required to recover the cost of acquiring a new customer. Essentially, it’s the break-even point for sales and marketing investments. A shorter CAC payback period is ideal, as it implies better returns on investment and business scalability.
It’s relatively expensive for Elastic to acquire new customers as its CAC payback period checked in at 57.2 months this quarter. The company’s slow recovery of its sales and marketing expenses indicates it operates in a highly competitive market and must invest to stand out, even if the return on that investment is low. 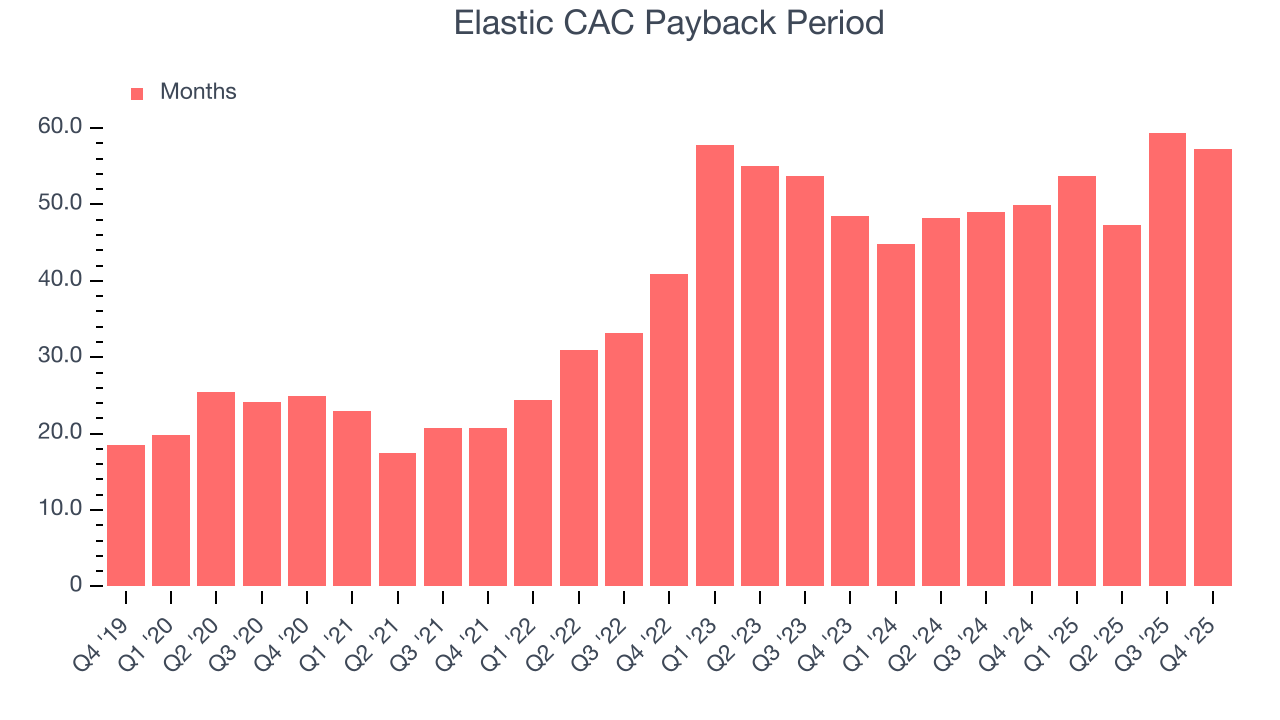
8. Customer Retention
One of the best parts about the software-as-a-service business model (and a reason why they trade at high valuation multiples) is that customers typically spend more on a company’s products and services over time.
Elastic’s net revenue retention rate, a key performance metric measuring how much money existing customers from a year ago are spending today, was 112% in Q4. This means Elastic would’ve grown its revenue by 12% even if it didn’t win any new customers over the last 12 months.
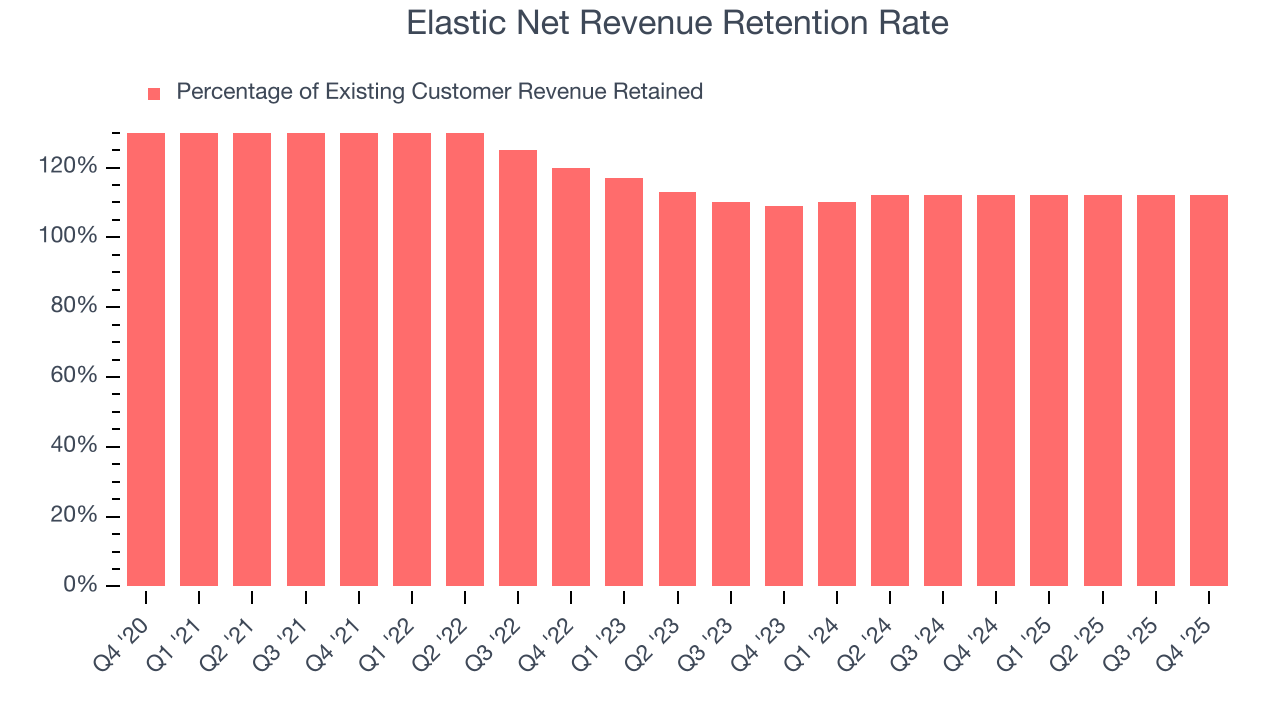
Elastic has a good net retention rate, proving that customers are satisfied with its software and getting more value from it over time, which is always great to see.
9. Gross Margin & Pricing Power
For software companies like Elastic, gross profit tells us how much money remains after paying for the base cost of products and services (typically servers, licenses, and certain personnel). These costs are usually low as a percentage of revenue, explaining why software is more lucrative than other sectors.
Elastic’s gross margin is good for a software business and points to its solid unit economics, competitive products and services, and lack of meaningful pricing pressure. As you can see below, it averaged an impressive 76.1% gross margin over the last year. That means for every $100 in revenue, roughly $76.05 was left to spend on selling, marketing, and R&D.
The market not only cares about gross margin levels but also how they change over time because expansion creates firepower for profitability and free cash generation. Elastic has seen gross margins improve by 2 percentage points over the last 2 year, which is solid in the software space.
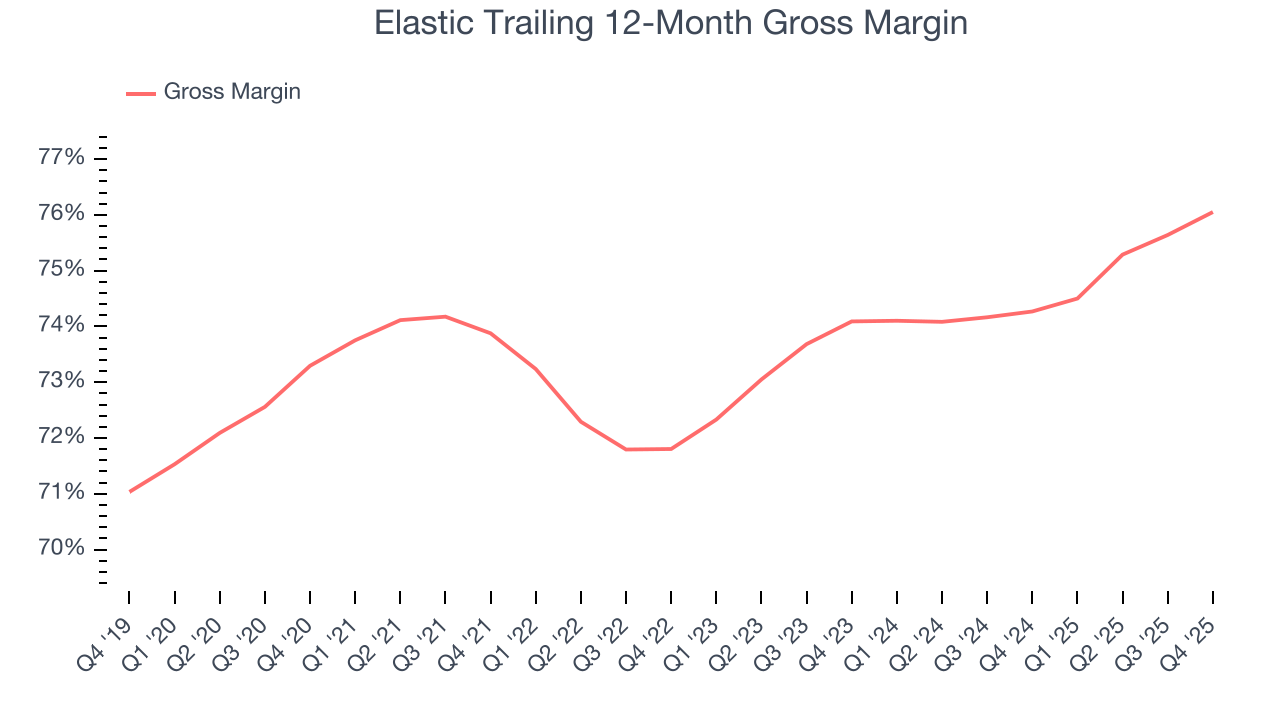
In Q4, Elastic produced a 76.3% gross profit margin, up 1.7 percentage points year on year. Elastic’s full-year margin has also been trending up over the past 12 months, increasing by 1.8 percentage points. If this move continues, it could suggest better unit economics due to more leverage from its growing sales on the fixed portion of its cost of goods sold (such as servers).
10. Operating Margin
While many software businesses point investors to their adjusted profits, which exclude stock-based compensation (SBC), we prefer GAAP operating margin because SBC is a legitimate expense used to attract and retain talent. This is one of the best measures of profitability because it shows how much money a company takes home after developing, marketing, and selling its products.
Although Elastic broke even this quarter from an operational perspective, it’s generally struggled over a longer time period. Its expensive cost structure has contributed to an average operating margin of negative 1.7% over the last year. Unprofitable, high-growth software companies require extra attention because they spend heaps of money to capture market share. As seen in its fast historical revenue growth, this strategy seems to have worked so far, but it’s unclear what would happen if Elastic reeled back its investments. Wall Street seems to think it will face some obstacles, and we tend to agree.
Over the last two years, Elastic’s expanding sales gave it operating leverage as its margin rose by 4.5 percentage points. Still, it will take much more for the company to reach long-term profitability.
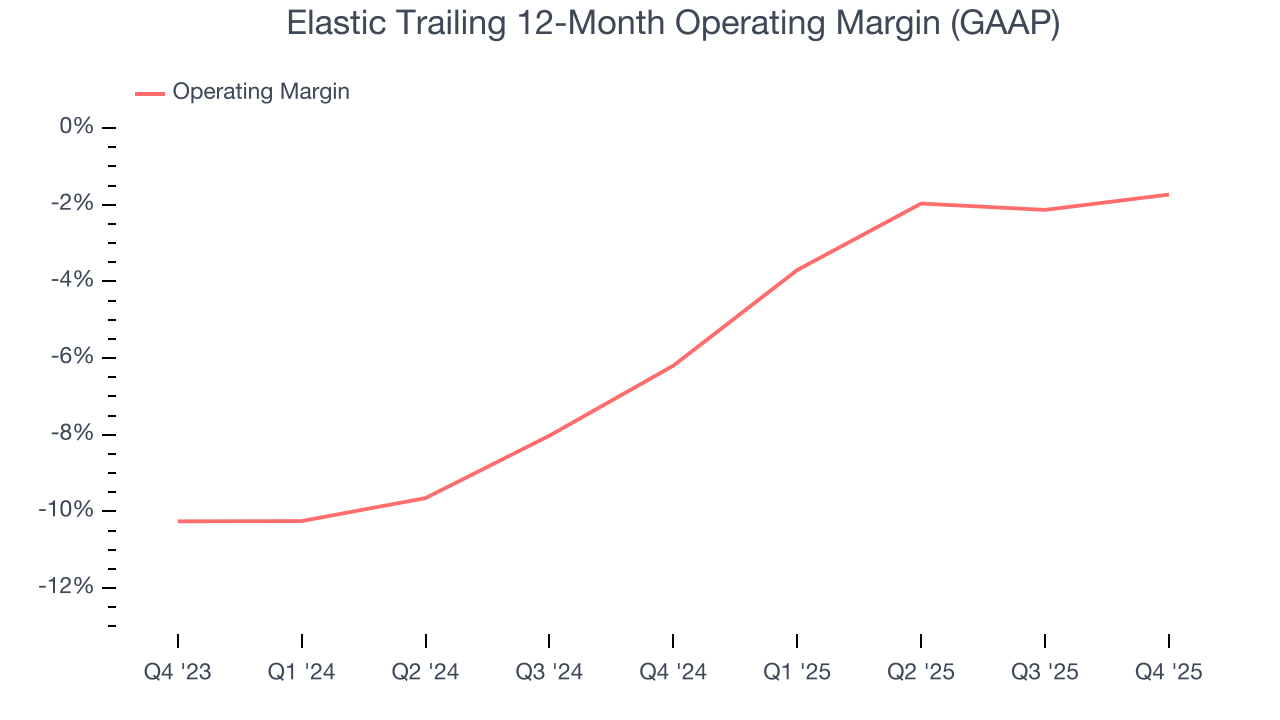
In Q4, Elastic’s breakeven margin was 0.1%, up 1.3 percentage points year on year. Since its gross margin expanded more than its operating margin, we can infer that leverage on its cost of sales was the primary driver behind the recently higher efficiency.
11. Cash Is King
Free cash flow isn't a prominently featured metric in company financials and earnings releases, but we think it's telling because it accounts for all operating and capital expenses, making it tough to manipulate. Cash is king.
Elastic has shown decent cash profitability, giving it some flexibility to reinvest or return capital to investors. The company’s free cash flow margin averaged 16% over the last year, slightly better than the broader software sector.
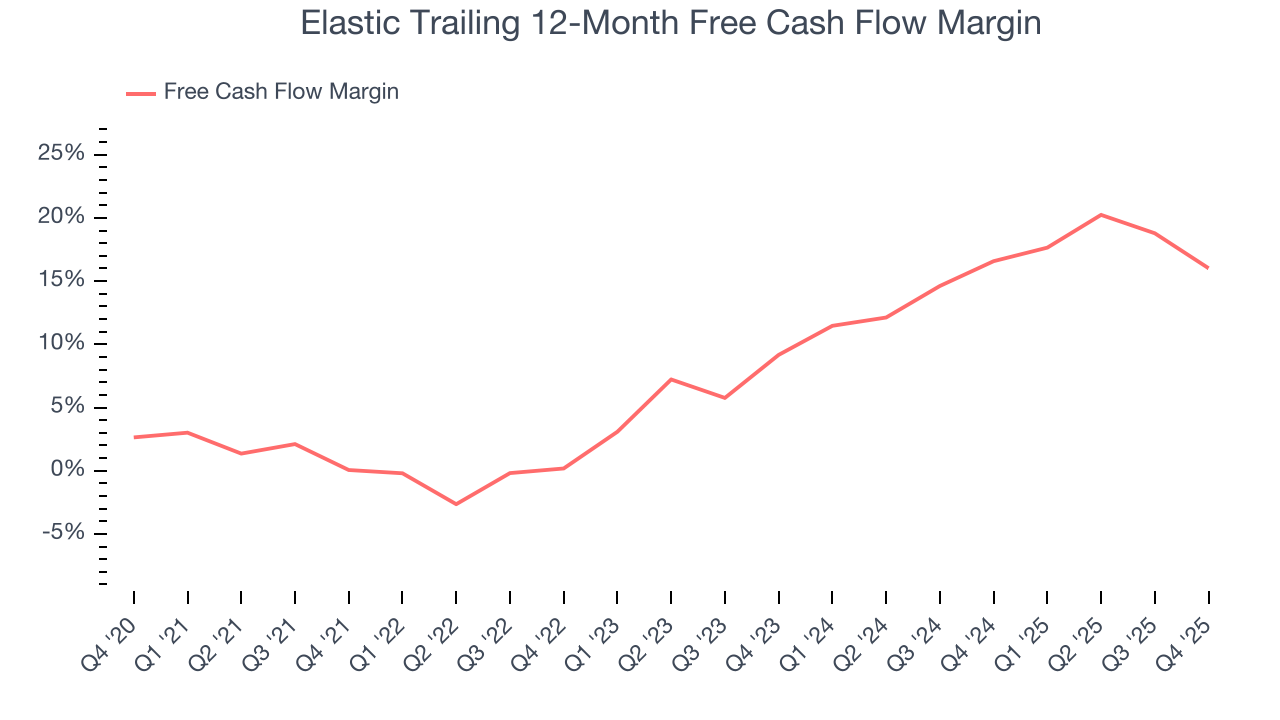
Elastic’s free cash flow clocked in at $53.66 million in Q4, equivalent to a 11.9% margin. The company’s cash profitability regressed as it was 10.9 percentage points lower than in the same quarter last year, prompting us to pay closer attention. Short-term fluctuations typically aren’t a big deal because investment needs can be seasonal, but we’ll be watching to see if the trend extrapolates into future quarters.
Over the next year, analysts predict Elastic’s cash conversion will improve. Their consensus estimates imply its free cash flow margin of 16% for the last 12 months will increase to 19.8%, it options for capital deployment (investments, share buybacks, etc.).
12. Balance Sheet Assessment
One of the best ways to mitigate bankruptcy risk is to hold more cash than debt.
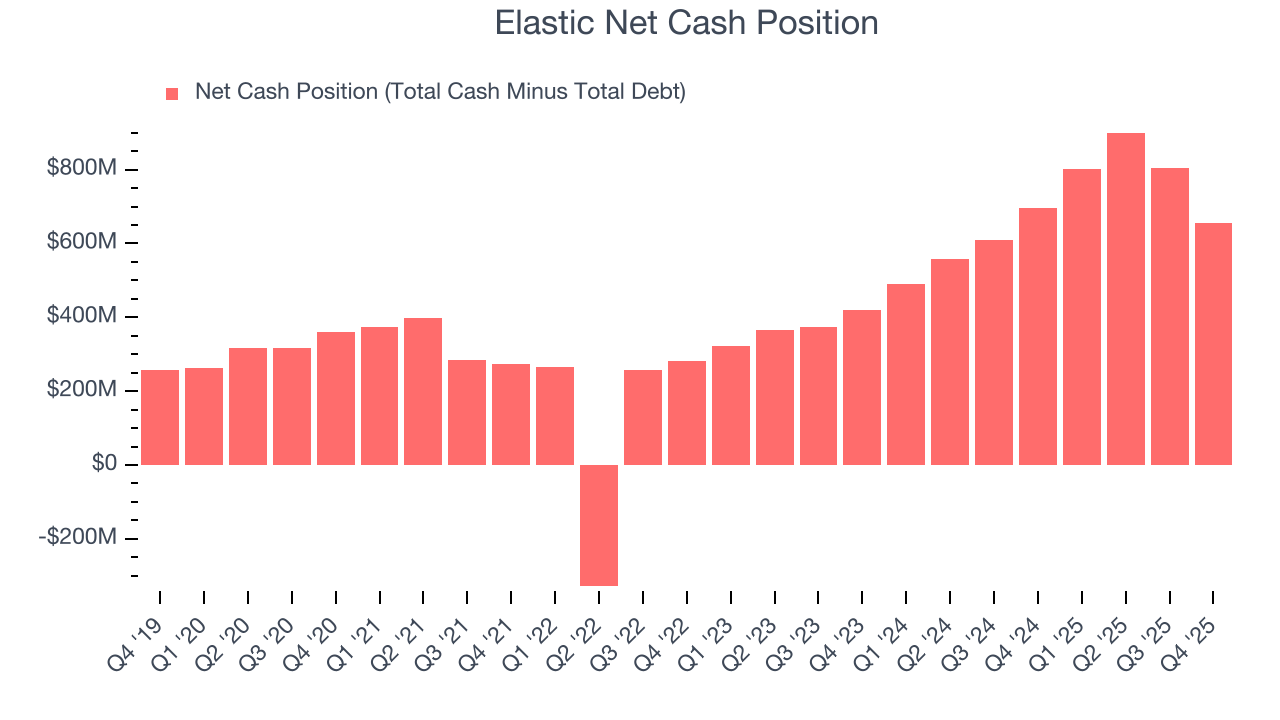
Elastic is a well-capitalized company with $1.25 billion of cash and $591.7 million of debt on its balance sheet. This $656.4 million net cash position is 10.1% of its market cap and gives it the freedom to borrow money, return capital to shareholders, or invest in growth initiatives. Leverage is not an issue here.
13. Key Takeaways from Elastic’s Q4 Results
It was great to see Elastic’s full-year EPS guidance top analysts’ expectations. We were also happy its revenue outperformed Wall Street’s estimates. On the other hand, Q1 guidance for constant-currency subscription revenue growth year-on-year was slightly below. Overall, this print was still solid. The market seemed to be hoping for more, and the stock traded down 12.1% to $54.16 immediately following the results.
14. Is Now The Time To Buy Elastic?
Updated: March 26, 2026 at 10:15 PM EDT
When considering an investment in Elastic, investors should account for its valuation and business qualities as well as what’s happened in the latest quarter.
Elastic’s business quality ultimately falls short of our standards. Although its revenue growth was strong over the last five years, it’s expected to deteriorate over the next 12 months and its expanding operating margin shows it’s becoming more efficient at building and selling its software. And while the company’s splendid ARR growth shows it’s securing more long-term contracts and becoming a more predictable business, the downside is its operating margins are low compared to other software companies.
Elastic’s price-to-sales ratio based on the next 12 months is 2.8x. This valuation is reasonable, but the company’s shakier fundamentals present too much downside risk. We're pretty confident there are more exciting stocks to buy at the moment.
Wall Street analysts have a consensus one-year price target of $82.13 on the company (compared to the current share price of $50.90).
Although the price target is bullish, readers should exercise caution because analysts tend to be overly optimistic. The firms they work for, often big banks, have relationships with companies that extend into fundraising, M&A advisory, and other rewarding business lines. As a result, they typically hesitate to say bad things for fear they will lose out. We at StockStory do not suffer from such conflicts of interest, so we’ll always tell it like it is.