
Knight-Swift Transportation (KNX)
Knight-Swift Transportation keeps us up at night. Its sales have underperformed and its low returns on capital show it has few growth opportunities.― StockStory Analyst Team
1. News


2. Summary
Why We Think Knight-Swift Transportation Will Underperform
Covering 1.6 billion loaded miles in 2023 alone, Knight-Swift Transportation (NYSE:KNX) offers less-than-truckload and full truckload delivery services.
- Performance over the past five years shows its incremental sales were much less profitable, as its earnings per share fell by 14.4% annually
- Below-average returns on capital indicate management struggled to find compelling investment opportunities, and its decreasing returns suggest its historical profit centers are aging
- Sales trends were unexciting over the last two years as its 2.3% annual growth was below the typical industrials company


Knight-Swift Transportation is in the doghouse. There are better opportunities in the market.
Why There Are Better Opportunities Than Knight-Swift Transportation


At $52.38 per share, Knight-Swift Transportation trades at 27.7x forward P/E. Not only is Knight-Swift Transportation’s multiple richer than most industrials peers, but it’s also expensive for its fundamentals.
We’d rather invest in similarly-priced but higher-quality companies with more reliable earnings growth.
3. Knight-Swift Transportation (KNX) Research Report: Q4 CY2025 Update
Freight delivery company Knight-Swift Transportation (NYSE:KNX) missed Wall Street’s revenue expectations in Q4 CY2025, with sales flat year on year at $1.86 billion. Its non-GAAP profit of $0.31 per share was 12.6% below analysts’ consensus estimates.
Knight-Swift Transportation (KNX) Q4 CY2025 Highlights:
- Revenue: $1.86 billion vs analyst estimates of $1.90 billion (flat year on year, 2.4% miss)
- Adjusted EPS: $0.31 vs analyst expectations of $0.35 (12.6% miss)
- Adjusted EBITDA: $204.5 million vs analyst estimates of $285.5 million (11% margin, 28.4% miss)
- Adjusted EPS guidance for Q1 CY2026 is $0.30 at the midpoint, below analyst estimates of $0.31
- Operating Margin: 1.4%, down from 4.2% in the same quarter last year
- Free Cash Flow Margin: 33.8%, up from 6.3% in the same quarter last year
- Market Capitalization: $8.94 billion
Company Overview
Covering 1.6 billion loaded miles in 2023 alone, Knight-Swift Transportation (NYSE:KNX) offers less-than-truckload and full truckload delivery services.
Knight-Swift was formed from the 2017 merger of Knight Transportation and Swift Transportation, two players in the truckload transportation industry. Since its inception, the company has primarily focused on expanding through acquisition, targeting smaller companies that fill specific regional gaps and larger companies that broaden its offerings. In specific, the $1.35 billion acquisition of AAA Cooper Transportation was particularly notable for strengthening its position in the less-than-truckload market (LTL, see below for explanation).
Knight-Swift makes deliveries for businesses of various industries, helping move products from distribution centers to stores or directly to customers’ homes. The company specializes in making full truckload deliveries, transporting goods using entire truck trailers dedicated to a single customer's shipment. This includes dry van services for regular cargo like boxed goods and equipment, and refrigerated services for perishable items that require temperature control during transport. In addition, it offers LTL services which involve transporting smaller shipments, often from multiple customers, that are consolidated into a single truck.
To make long-distance deliveries, the company offers intermodal freight transportation which uses equipment such as containers and trailers that are compatible with both truck and rail transport. Supplementing its own fleet, the company contracts third-party equipment providers to meet additional demand.
The company generates revenue through both spot market and contract freight. Spot market consists of immediate delivery while the longer-term contracts typically last up to five years include volume and pricing agreements.
4. Ground Transportation
The growth of e-commerce and global trade continues to drive demand for shipping services, especially last-mile delivery, presenting opportunities for ground transportation companies. The industry continues to invest in data, analytics, and autonomous fleets to optimize efficiency and find the most cost-effective routes. Despite the essential services this industry provides, ground transportation companies are still at the whim of economic cycles. Consumer spending, for example, can greatly impact the demand for these companies’ offerings while fuel costs can influence profit margins.
Competitors offering similar products include C.H. Robinson (NASDAQ:CHRW), Expeditors (NYSE:EXPD), and FedEx (NYSE:FDX).
5. Revenue Growth
Reviewing a company’s long-term sales performance reveals insights into its quality. Any business can put up a good quarter or two, but many enduring ones grow for years. Luckily, Knight-Swift Transportation’s sales grew at a solid 9.8% compounded annual growth rate over the last five years. Its growth beat the average industrials company and shows its offerings resonate with customers.
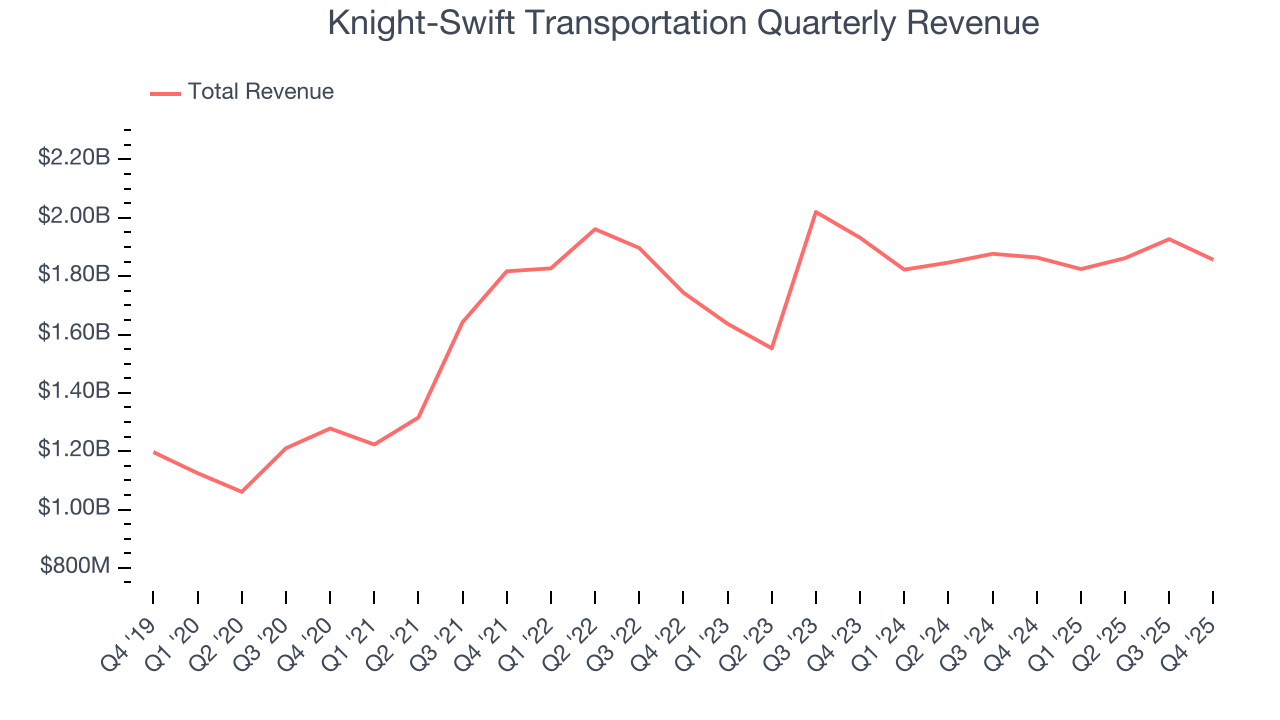
We at StockStory place the most emphasis on long-term growth, but within industrials, a half-decade historical view may miss cycles, industry trends, or a company capitalizing on catalysts such as a new contract win or a successful product line. Knight-Swift Transportation’s recent performance shows its demand has slowed as its annualized revenue growth of 2.3% over the last two years was below its five-year trend. We also note many other Ground Transportation businesses have faced declining sales because of cyclical headwinds. While Knight-Swift Transportation grew slower than we’d like, it did do better than its peers. 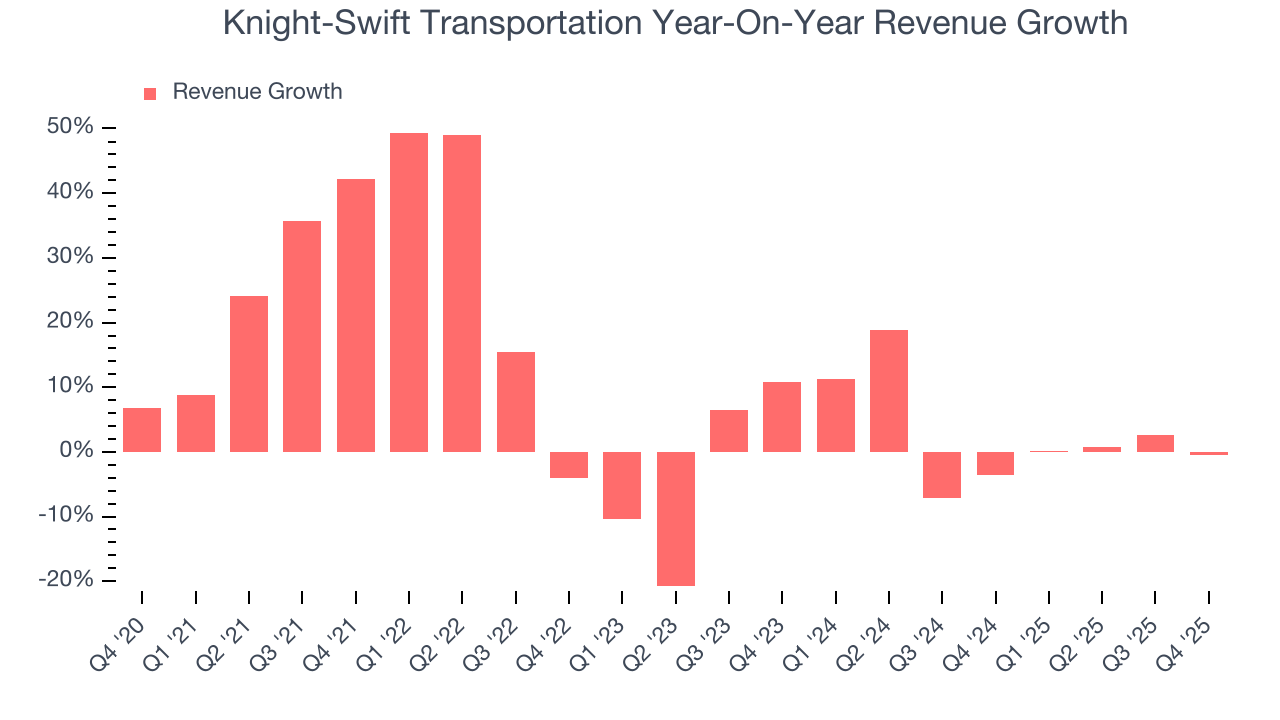
This quarter, Knight-Swift Transportation missed Wall Street’s estimates and reported a rather uninspiring 0.4% year-on-year revenue decline, generating $1.86 billion of revenue.
Looking ahead, sell-side analysts expect revenue to grow 5.8% over the next 12 months. Although this projection implies its newer products and services will catalyze better top-line performance, it is still below average for the sector.
6. Gross Margin & Pricing Power
All else equal, we prefer higher gross margins because they make it easier to generate more operating profits and indicate that a company commands pricing power by offering more differentiated products.
Knight-Swift Transportation’s gross margin is slightly below the average industrials company, giving it less room to invest in areas such as research and development. As you can see below, it averaged a 29.1% gross margin over the last five years. Said differently, Knight-Swift Transportation had to pay a chunky $70.95 to its suppliers for every $100 in revenue. 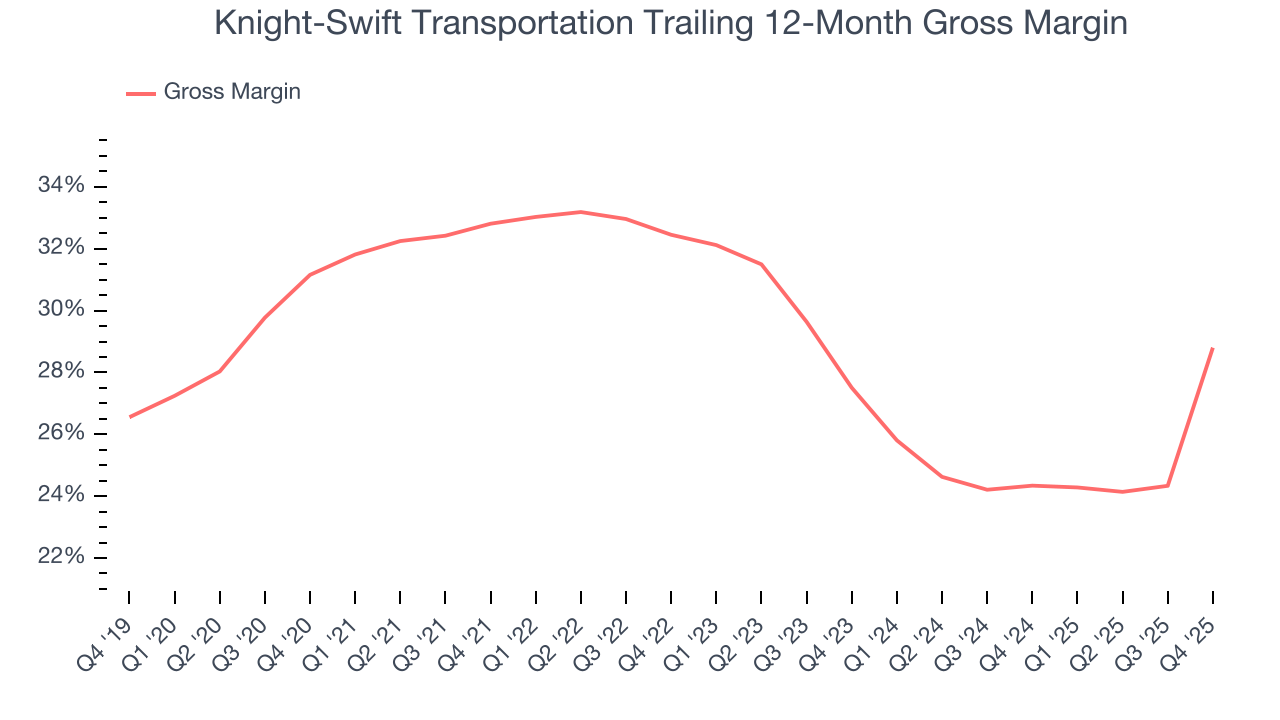
In Q4, Knight-Swift Transportation produced a 42.7% gross profit margin, marking a 18 percentage point increase from 24.7% in the same quarter last year. Knight-Swift Transportation’s full-year margin has also been trending up over the past 12 months, increasing by 4.5 percentage points. If this move continues, it could suggest better unit economics due to some combination of stable to improving pricing power and input costs (such as raw materials).
7. Operating Margin
Operating margin is an important measure of profitability as it shows the portion of revenue left after accounting for all core expenses – everything from the cost of goods sold to advertising and wages. It’s also useful for comparing profitability across companies with different levels of debt and tax rates because it excludes interest and taxes.
Knight-Swift Transportation has done a decent job managing its cost base over the last five years. The company has produced an average operating margin of 8.1%, higher than the broader industrials sector.
Analyzing the trend in its profitability, Knight-Swift Transportation’s operating margin decreased by 13.2 percentage points over the last five years. Many Ground Transportation companies also saw their margins fall (along with revenue, as mentioned above) because the cycle turned in the wrong direction. We hope Knight-Swift Transportation can emerge from this a stronger company, as the silver lining of a downturn is that market share can be won and efficiencies found.
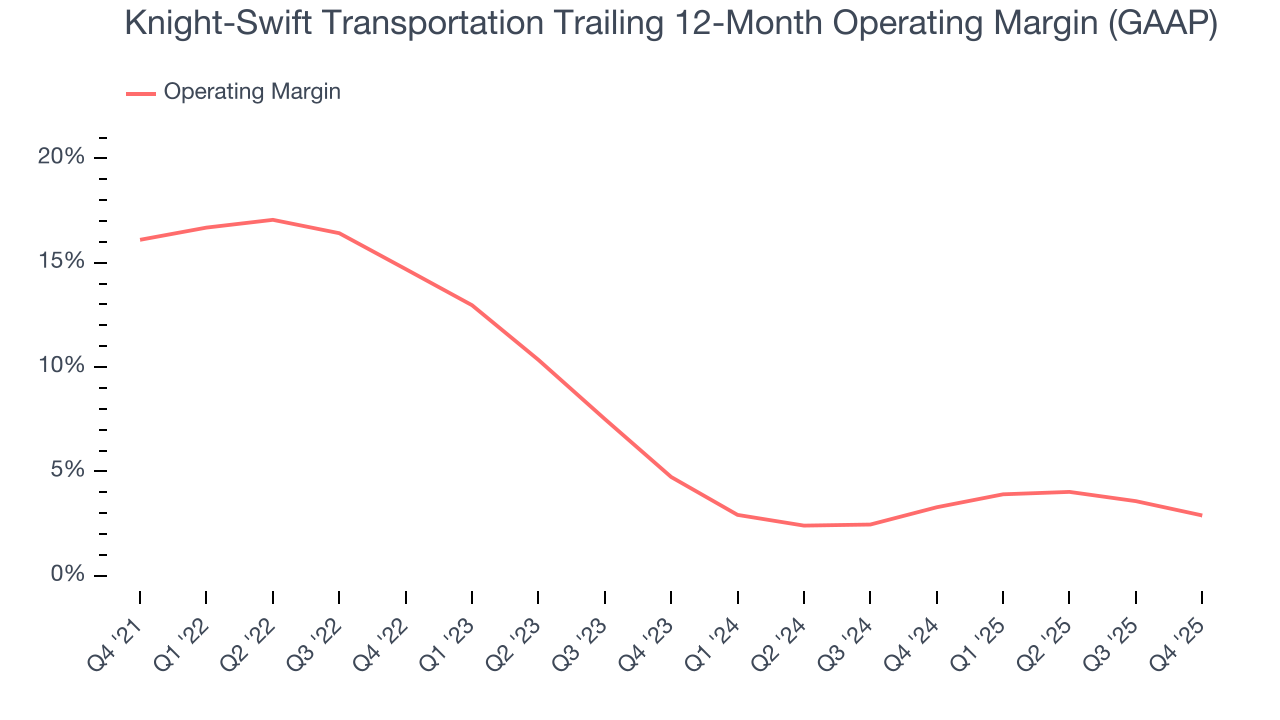
In Q4, Knight-Swift Transportation generated an operating margin profit margin of 1.4%, down 2.8 percentage points year on year. Conversely, its gross margin actually rose, so we can assume its recent inefficiencies were driven by increased operating expenses like marketing, R&D, and administrative overhead.
8. Earnings Per Share
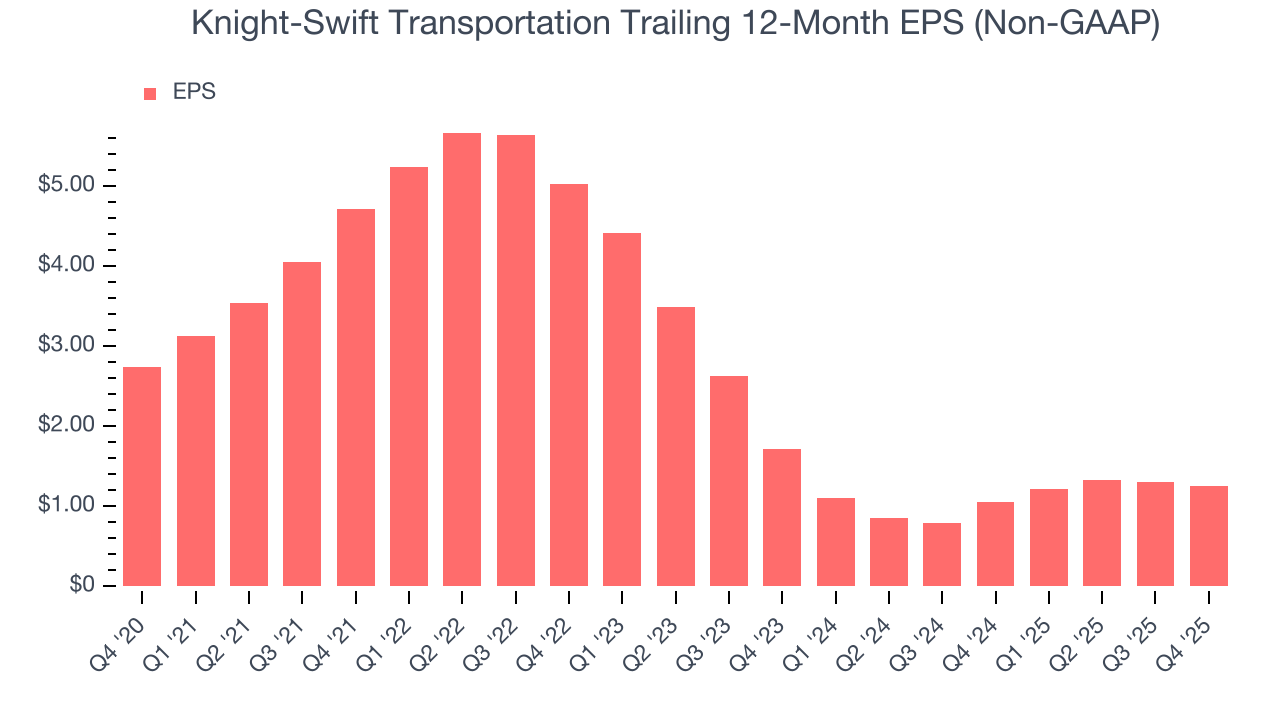
We track the long-term change in earnings per share (EPS) for the same reason as long-term revenue growth. Compared to revenue, however, EPS highlights whether a company’s growth is profitable.
Sadly for Knight-Swift Transportation, its EPS declined by 14.4% annually over the last five years while its revenue grew by 9.8%. This tells us the company became less profitable on a per-share basis as it expanded due to non-fundamental factors such as interest expenses and taxes.
Diving into the nuances of Knight-Swift Transportation’s earnings can give us a better understanding of its performance. As we mentioned earlier, Knight-Swift Transportation’s operating margin declined by 13.2 percentage points over the last five years. This was the most relevant factor (aside from the revenue impact) behind its lower earnings; interest expenses and taxes can also affect EPS but don’t tell us as much about a company’s fundamentals.
Like with revenue, we analyze EPS over a shorter period to see if we are missing a change in the business.
For Knight-Swift Transportation, its two-year annual EPS declines of 14.4% are similar to its five-year trend. These results were bad no matter how you slice the data.
In Q4, Knight-Swift Transportation reported adjusted EPS of $0.31, down from $0.36 in the same quarter last year. This print missed analysts’ estimates. Over the next 12 months, Wall Street expects Knight-Swift Transportation’s full-year EPS of $1.26 to grow 58.6%.
9. Cash Is King
If you’ve followed StockStory for a while, you know we emphasize free cash flow. Why, you ask? We believe that in the end, cash is king, and you can’t use accounting profits to pay the bills.
Knight-Swift Transportation has shown impressive cash profitability, enabling it to ride out cyclical downturns more easily while maintaining its investments in new and existing offerings. The company’s free cash flow margin averaged 8.7% over the last five years, better than the broader industrials sector.
Taking a step back, we can see that Knight-Swift Transportation’s margin dropped by 4.4 percentage points during that time. It may have ticked higher more recently, but shareholders are likely hoping for its margin to at least revert to its historical level. If the longer-term trend returns, it could signal it is in the middle of an investment cycle.
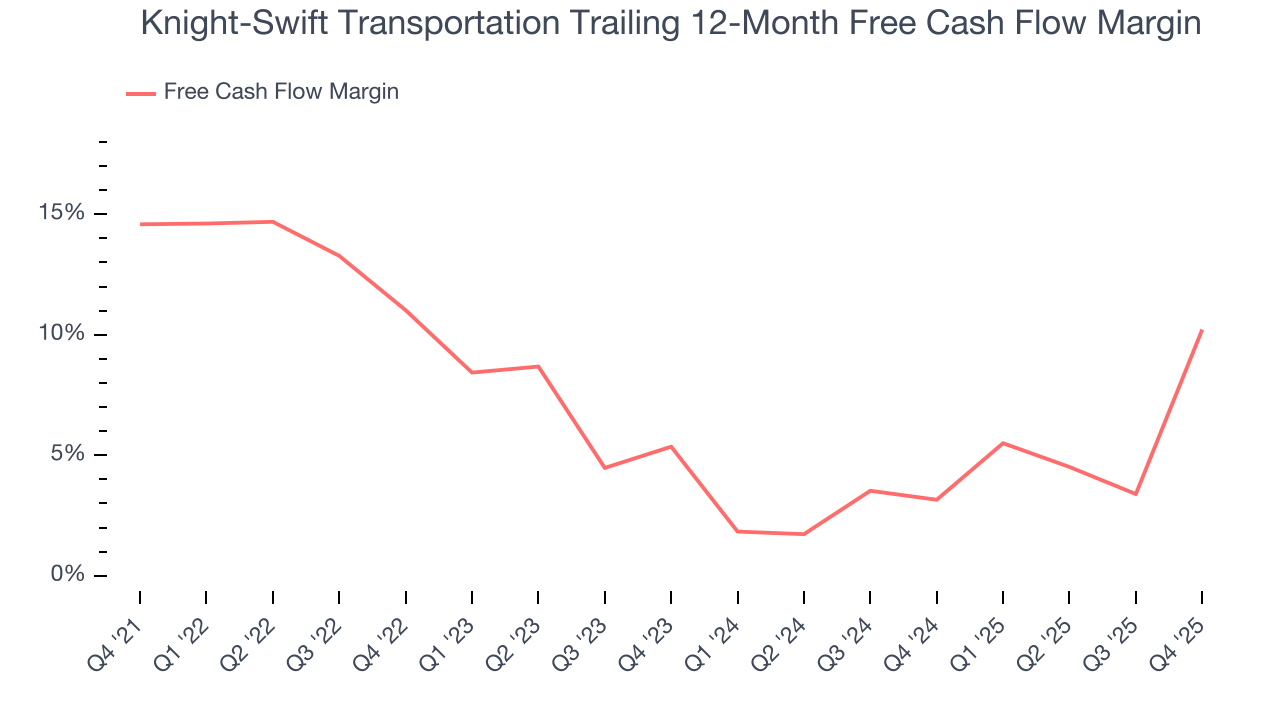
Knight-Swift Transportation’s free cash flow clocked in at $627.1 million in Q4, equivalent to a 33.8% margin. This result was good as its margin was 27.5 percentage points higher than in the same quarter last year, but we wouldn’t put too much weight on the short term because investment needs can be seasonal, causing temporary swings. Long-term trends carry greater meaning.
10. Return on Invested Capital (ROIC)
EPS and free cash flow tell us whether a company was profitable while growing its revenue. But was it capital-efficient? A company’s ROIC explains this by showing how much operating profit it makes compared to the money it has raised (debt and equity).
Knight-Swift Transportation historically did a mediocre job investing in profitable growth initiatives. Its five-year average ROIC was 5.5%, somewhat low compared to the best industrials companies that consistently pump out 20%+.
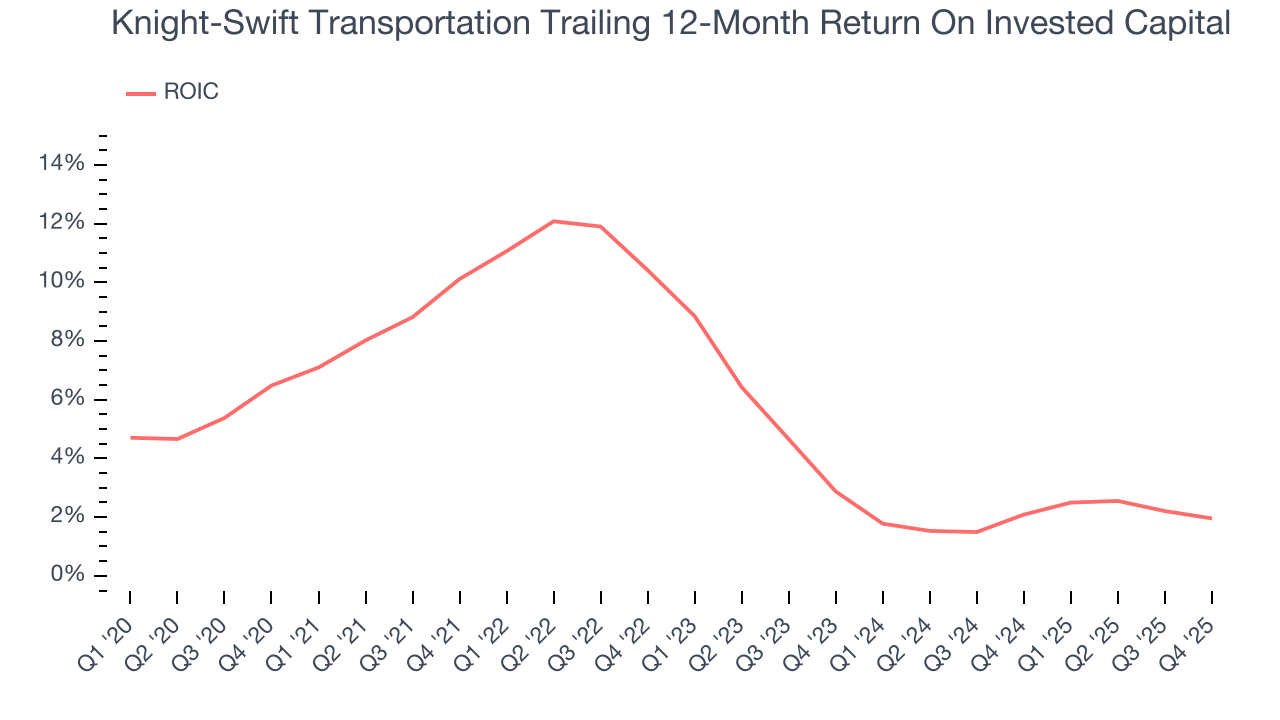
We like to invest in businesses with high returns, but the trend in a company’s ROIC is what often surprises the market and moves the stock price. Over the last few years, Knight-Swift Transportation’s ROIC has unfortunately decreased. Paired with its already low returns, these declines suggest its profitable growth opportunities are few and far between.
11. Balance Sheet Assessment
Knight-Swift Transportation reported $302.8 million of cash and $2.69 billion of debt on its balance sheet in the most recent quarter. As investors in high-quality companies, we primarily focus on two things: 1) that a company’s debt level isn’t too high and 2) that its interest payments are not excessively burdening the business.
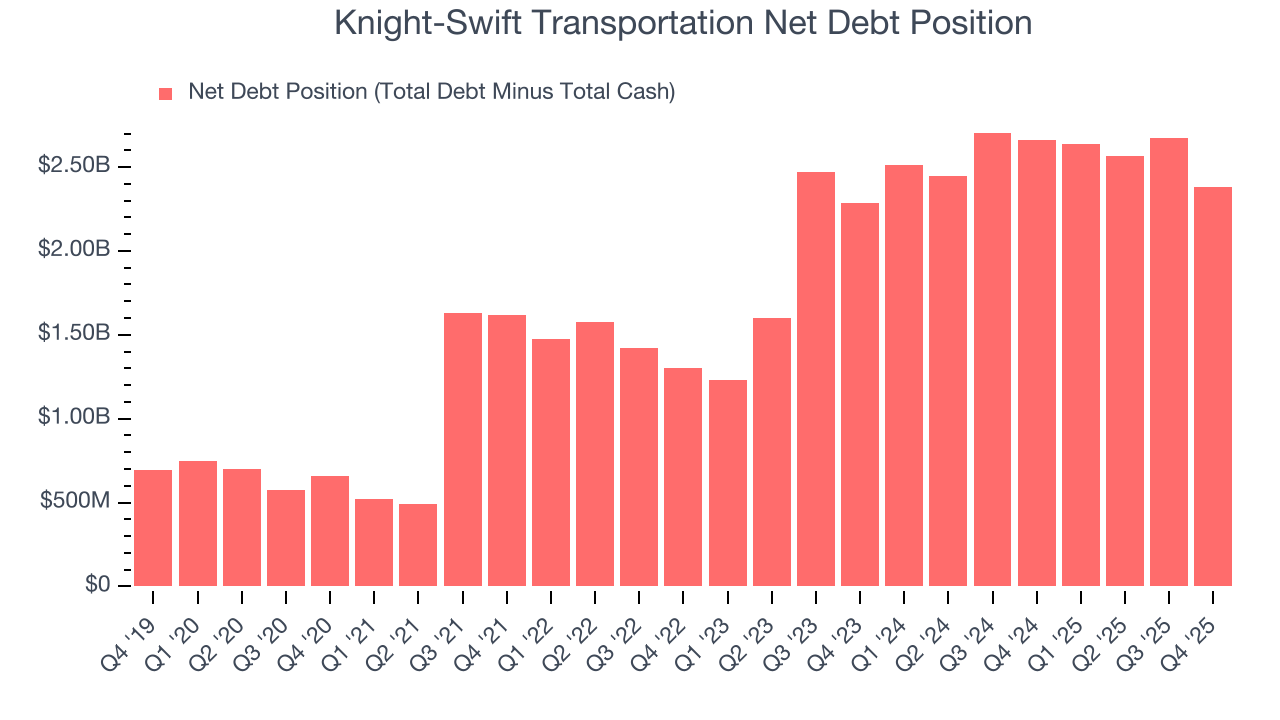
With $1.03 billion of EBITDA over the last 12 months, we view Knight-Swift Transportation’s 2.3× net-debt-to-EBITDA ratio as safe. We also see its $75.63 million of annual interest expenses as appropriate. The company’s profits give it plenty of breathing room, allowing it to continue investing in growth initiatives.
12. Key Takeaways from Knight-Swift Transportation’s Q4 Results
We struggled to find many positives in these results. Its revenue missed and its EBITDA fell short of Wall Street’s estimates. Overall, this quarter could have been better. The stock traded down 3.1% to $56.13 immediately following the results.
13. Is Now The Time To Buy Knight-Swift Transportation?
Updated: March 17, 2026 at 11:51 PM EDT
When considering an investment in Knight-Swift Transportation, investors should account for its valuation and business qualities as well as what’s happened in the latest quarter.
We see the value of companies helping their customers, but in the case of Knight-Swift Transportation, we’re out. Although its revenue growth was solid over the last five years, it’s expected to deteriorate over the next 12 months and its diminishing returns show management's prior bets haven't worked out. And while the company’s projected EPS for the next year implies the company’s fundamentals will improve, the downside is its declining EPS over the last five years makes it a less attractive asset to the public markets.
Knight-Swift Transportation’s P/E ratio based on the next 12 months is 27.7x. At this valuation, there’s a lot of good news priced in - we think other companies feature superior fundamentals at the moment.
Wall Street analysts have a consensus one-year price target of $63.63 on the company (compared to the current share price of $52.38).
Although the price target is bullish, readers should exercise caution because analysts tend to be overly optimistic. The firms they work for, often big banks, have relationships with companies that extend into fundraising, M&A advisory, and other rewarding business lines. As a result, they typically hesitate to say bad things for fear they will lose out. We at StockStory do not suffer from such conflicts of interest, so we’ll always tell it like it is.