
Lindsay (LNN)
Lindsay doesn’t excite us. Its poor sales growth and falling returns on capital suggest its growth opportunities are shrinking.― StockStory Analyst Team
1. News


2. Summary
Why We Think Lindsay Will Underperform
A pioneer in the field of center pivot and lateral move irrigation, Lindsay (NYSE:LNN) provides a variety of proprietary water management and road infrastructure products and services.
- Sales are projected to be flat over the next 12 months and imply weak demand
- Annual revenue growth of 7% over the last five years was below our standards for the industrials sector
- A consolation is that its additional sales over the last five years increased its profitability as the 14.4% annual growth in its earnings per share outpaced its revenue


Lindsay’s quality is insufficient. There are more promising alternatives.
Why There Are Better Opportunities Than Lindsay


Lindsay is trading at $125.44 per share, or 19.9x forward P/E. Lindsay’s multiple may seem like a great deal among industrials peers, but we think there are valid reasons why it’s this cheap.
It’s better to pay up for high-quality businesses with higher long-term earnings potential rather than to buy lower-quality stocks because they appear cheap. These challenged businesses often don’t re-rate, a phenomenon known as a “value trap”.
3. Lindsay (LNN) Research Report: Q4 CY2025 Update
Agricultural and farm machinery company Lindsay (NYSE:LNN) fell short of the markets revenue expectations in Q4 CY2025, with sales falling 6.3% year on year to $155.8 million. Its GAAP profit of $1.54 per share was 4.4% above analysts’ consensus estimates.
Lindsay (LNN) Q4 CY2025 Highlights:
- Revenue: $155.8 million vs analyst estimates of $167.6 million (6.3% year-on-year decline, 7% miss)
- EPS (GAAP): $1.54 vs analyst estimates of $1.48 (4.4% beat)
- Adjusted EBITDA: $26.29 million vs analyst estimates of $24.54 million (16.9% margin, 7.1% beat)
- Operating Margin: 12.6%, in line with the same quarter last year
- Free Cash Flow was -$15.07 million, down from $12.46 million in the same quarter last year
- Market Capitalization: $1.26 billion
Company Overview
A pioneer in the field of center pivot and lateral move irrigation, Lindsay (NYSE:LNN) provides a variety of proprietary water management and road infrastructure products and services.
The company was founded in 1955 in Lindsay, Nebraska. As mentioned, Lindsay was instrumental in the development and advancement of the now-widely-used center pivot irrigation approach. In this system, equipment rotates around a pivot and crops are watered with sprinklers. A circular area centered on the pivot is irrigated, which is why crop circles exist.
In addition to center pivot technology, Lindsay sells other irrigation systems as well as transportation infrastructure and farm machinery. One notable example of transportation infrastructure is the Road Zipper System, a moveable road barrier.
Given its fairly diverse product portfolio, Lindsay predictably serves a diverse customer base, including independent and commercial farmers, government agencies, and transportation authorities. The company's value proposition to farmers is enhancement of crop yields and water conservation. For buyers of Lindsay’s road safety products, the value proposition is reasonably-priced products that can greatly reduce accidents and fatalities while improving traffic flow.
Lindsay’s revenue structure consists of both direct sales and sales programs managed by the company’s network of distributors and third-party representatives. The company’s network of distributors and dealers sell products to various regional markets and provides services, including product maintenance, repair, and installation. Lindsay additionally will occasionally enter service contracts with its customers for the maintenance and support of equipment.
4. Agricultural Machinery
Agricultural machinery companies are investing to develop and produce more precise machinery, automated systems, and connected equipment that collects analyzable data to help farmers and other customers improve yields and increase efficiency. On the other hand, agriculture is seasonal and natural disasters or bad weather can impact the entire industry. Additionally, macroeconomic factors such as commodity prices or changes in interest rates–which dictate the willingness of these companies or their customers to invest–can impact demand for agricultural machinery.
Lindsay’s peers and competitors include Alamo (NYSE:ALG) and AGCO (NYSE:AGCO).
5. Revenue Growth
A company’s long-term sales performance is one signal of its overall quality. Any business can have short-term success, but a top-tier one grows for years. Unfortunately, Lindsay’s 7% annualized revenue growth over the last five years was mediocre. This fell short of our benchmark for the industrials sector and is a rough starting point for our analysis.
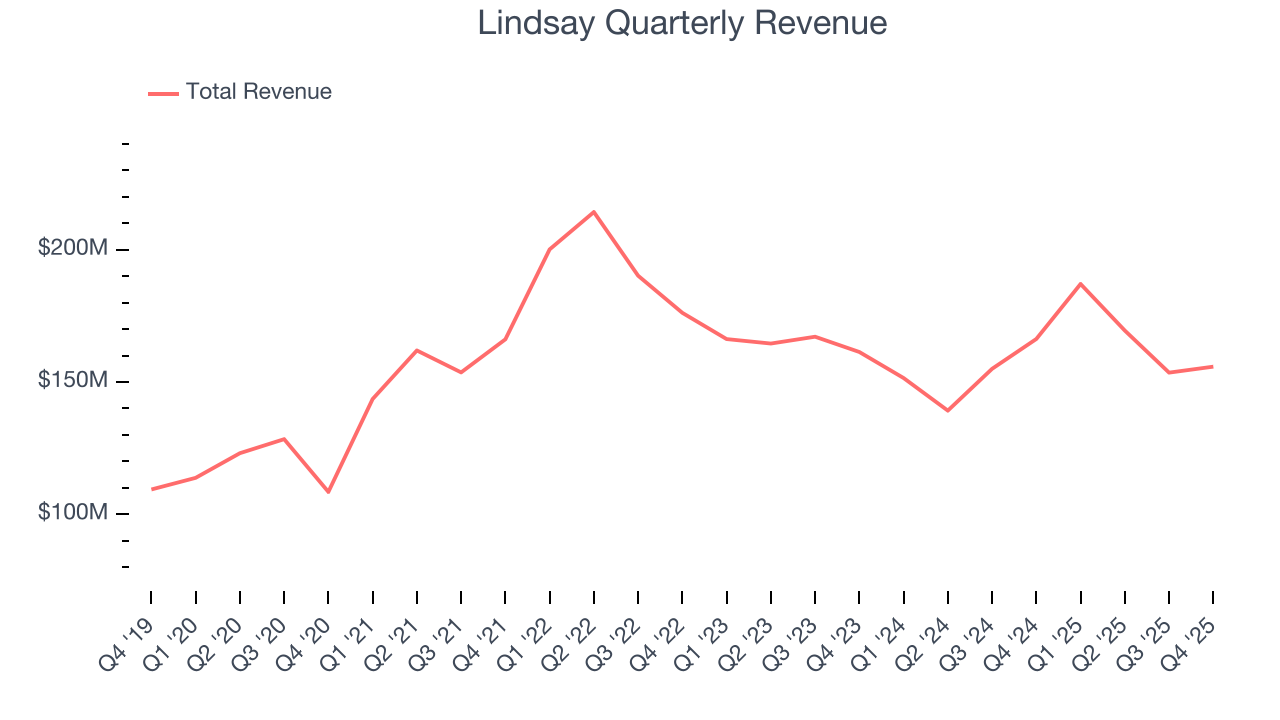
Long-term growth is the most important, but within industrials, a half-decade historical view may miss new industry trends or demand cycles. Lindsay’s recent performance shows its demand has slowed as its revenue was flat over the last two years. We also note many other Agricultural Machinery businesses have faced declining sales because of cyclical headwinds. While Lindsay’s growth wasn’t the best, it did do better than its peers. 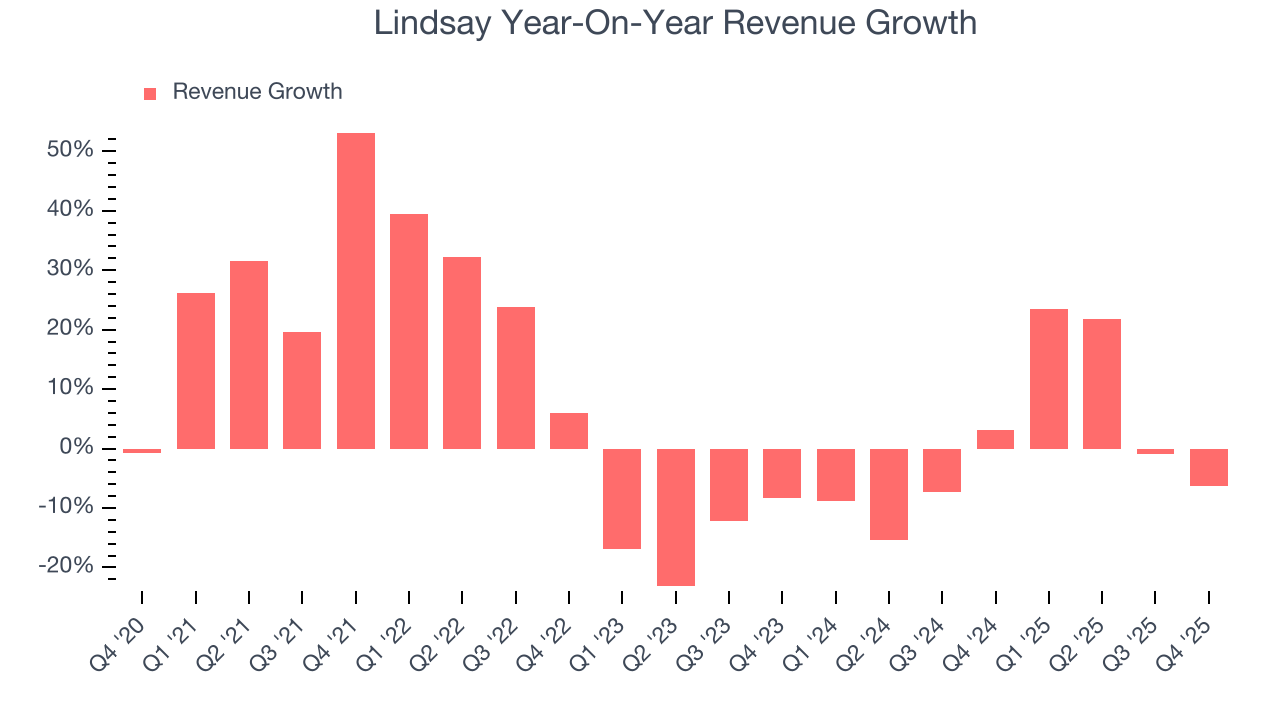
This quarter, Lindsay missed Wall Street’s estimates and reported a rather uninspiring 6.3% year-on-year revenue decline, generating $155.8 million of revenue.
Looking ahead, sell-side analysts expect revenue to grow 5.2% over the next 12 months. Although this projection implies its newer products and services will spur better top-line performance, it is still below the sector average.
6. Gross Margin & Pricing Power
Lindsay’s gross margin is slightly below the average industrials company, giving it less room to invest in areas such as research and development. As you can see below, it averaged a 29.4% gross margin over the last five years. Said differently, Lindsay had to pay a chunky $70.60 to its suppliers for every $100 in revenue. 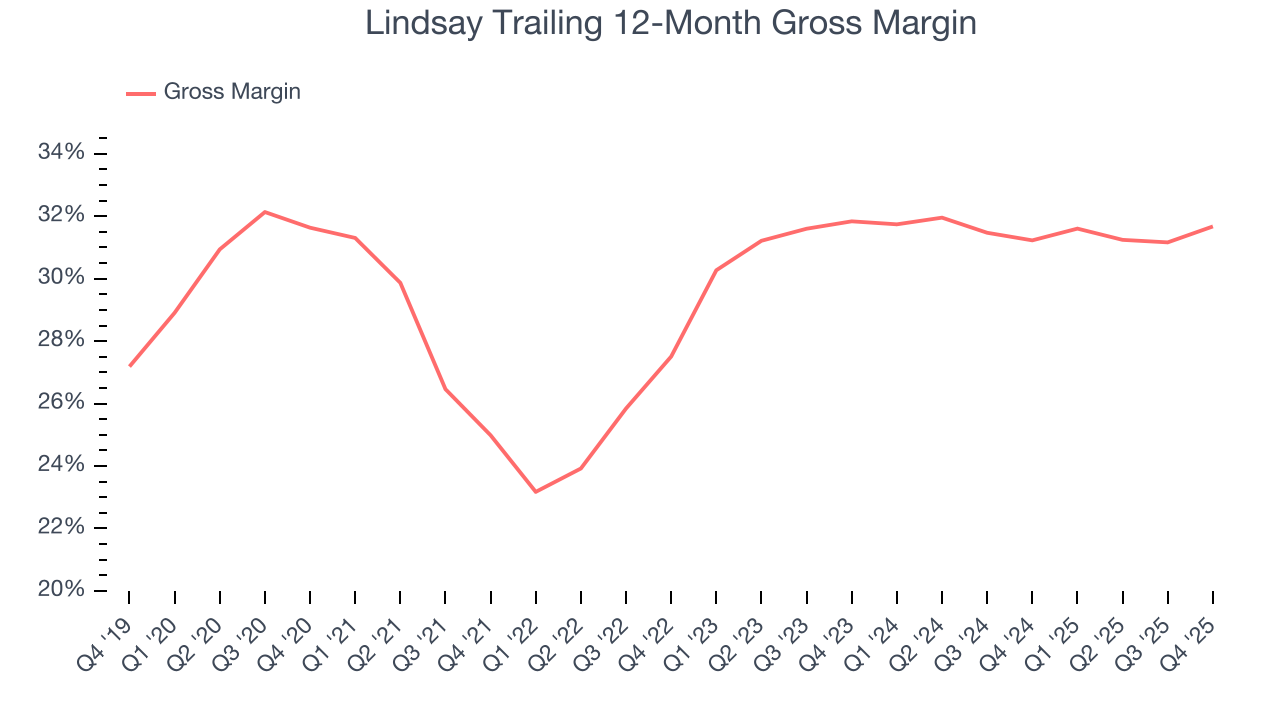
Lindsay’s gross profit margin came in at 32.2% this quarter, up 2.1 percentage points year on year. Zooming out, the company’s full-year margin has remained steady over the past 12 months, suggesting its input costs (such as raw materials and manufacturing expenses) have been stable and it isn’t under pressure to lower prices.
7. Operating Margin
Operating margin is one of the best measures of profitability because it tells us how much money a company takes home after procuring and manufacturing its products, marketing and selling those products, and most importantly, keeping them relevant through research and development.
Lindsay has been an efficient company over the last five years. It was one of the more profitable businesses in the industrials sector, boasting an average operating margin of 12.8%. This result was particularly impressive because of its low gross margin, which is mostly a factor of what it sells and takes huge shifts to move meaningfully. Companies have more control over their operating margins, and it’s a show of well-managed operations if they’re high when gross margins are low.
Analyzing the trend in its profitability, Lindsay’s operating margin rose by 3.5 percentage points over the last five years, as its sales growth gave it operating leverage.
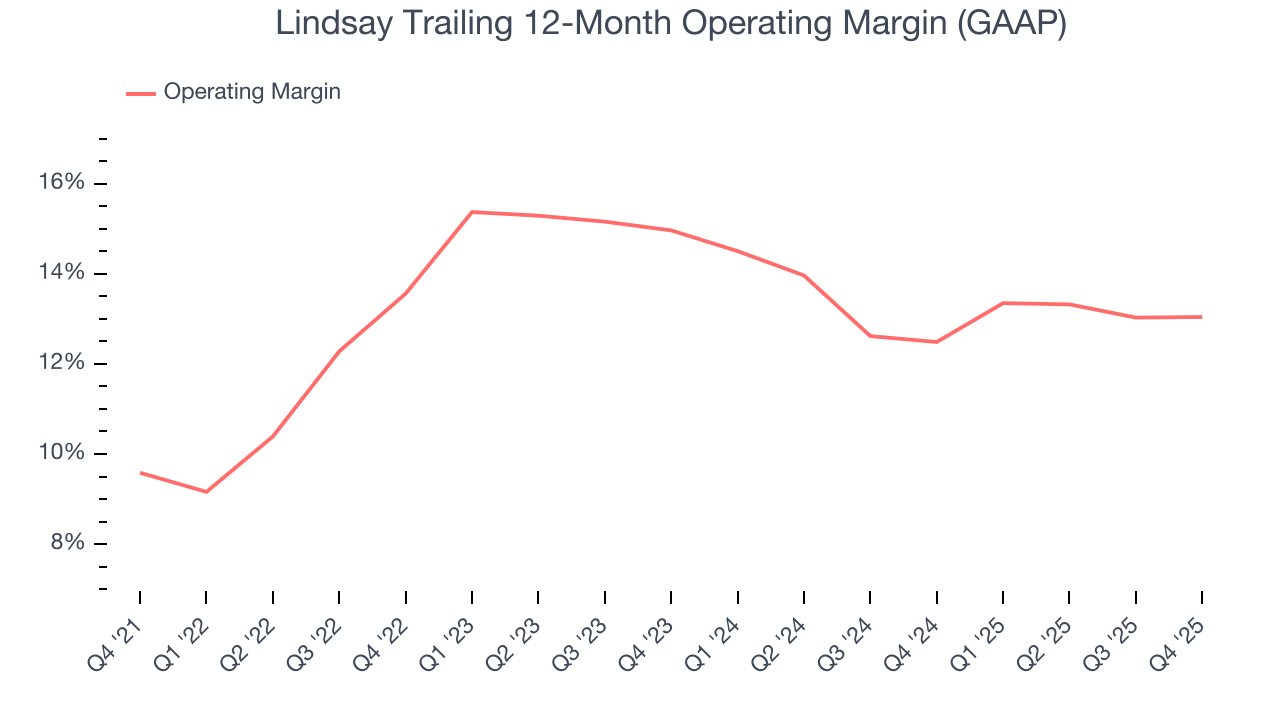
In Q4, Lindsay generated an operating margin profit margin of 12.6%, in line with the same quarter last year. This indicates the company’s cost structure has recently been stable.
8. Earnings Per Share
Revenue trends explain a company’s historical growth, but the long-term change in earnings per share (EPS) points to the profitability of that growth – for example, a company could inflate its sales through excessive spending on advertising and promotions.
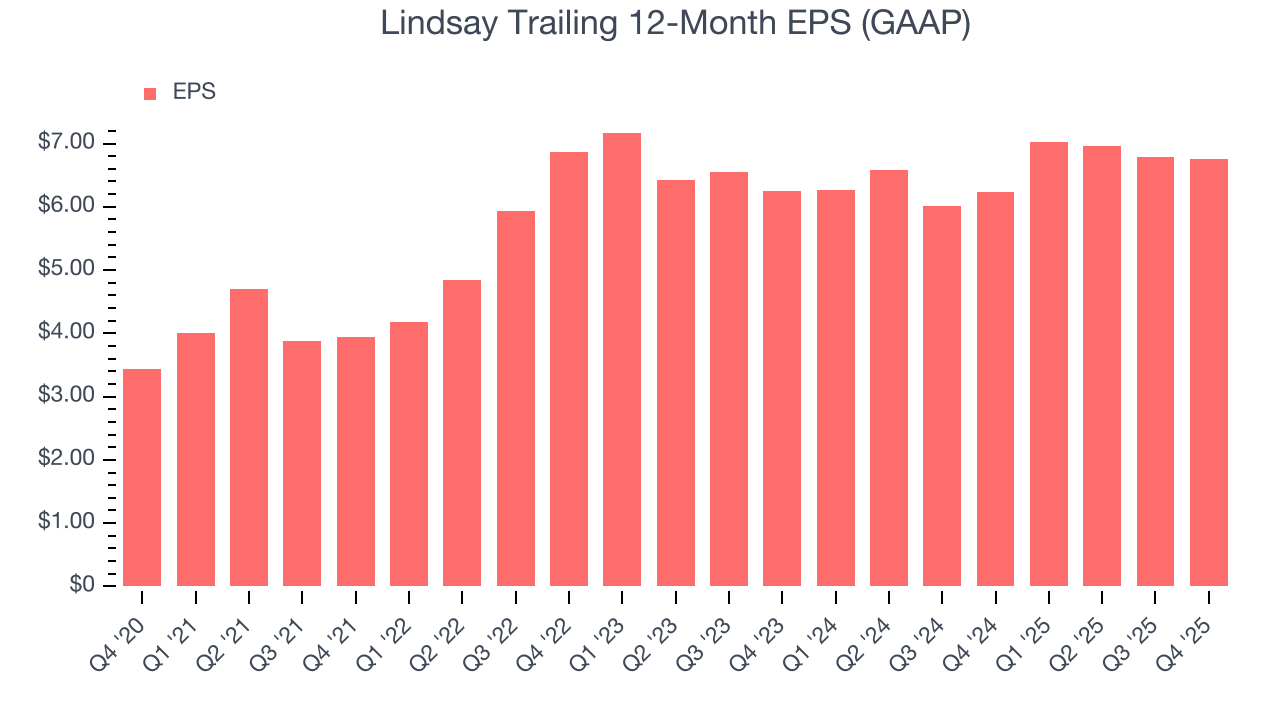
Lindsay’s EPS grew at a remarkable 14.5% compounded annual growth rate over the last five years, higher than its 7% annualized revenue growth. This tells us the company became more profitable on a per-share basis as it expanded.
Diving into Lindsay’s quality of earnings can give us a better understanding of its performance. As we mentioned earlier, Lindsay’s operating margin was flat this quarter but expanded by 3.5 percentage points over the last five years. On top of that, its share count shrank by 1.7%. These are positive signs for shareholders because improving profitability and share buybacks turbocharge EPS growth relative to revenue growth. 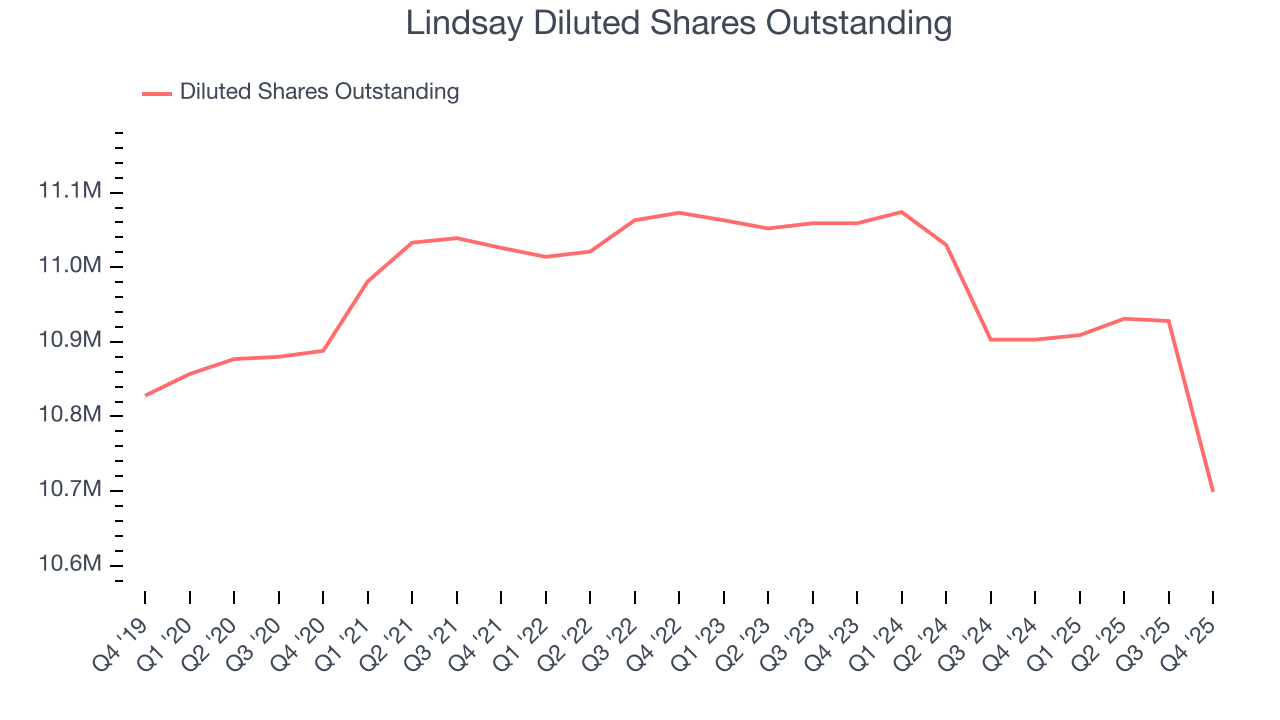
Like with revenue, we analyze EPS over a shorter period to see if we are missing a change in the business.
For Lindsay, its two-year annual EPS growth of 3.9% was lower than its five-year trend. We hope its growth can accelerate in the future.
In Q4, Lindsay reported EPS of $1.54, down from $1.57 in the same quarter last year. Despite falling year on year, this print beat analysts’ estimates by 4.4%. Over the next 12 months, Wall Street expects Lindsay’s full-year EPS of $6.75 to shrink by 7.3%.
9. Cash Is King
If you’ve followed StockStory for a while, you know we emphasize free cash flow. Why, you ask? We believe that in the end, cash is king, and you can’t use accounting profits to pay the bills.
Lindsay has shown decent cash profitability, giving it some flexibility to reinvest or return capital to investors. The company’s free cash flow margin averaged 7.1% over the last five years, slightly better than the broader industrials sector.
Taking a step back, we can see that Lindsay’s margin expanded by 12.6 percentage points during that time. This is encouraging, and we can see it became a less capital-intensive business because its free cash flow profitability rose more than its operating profitability.
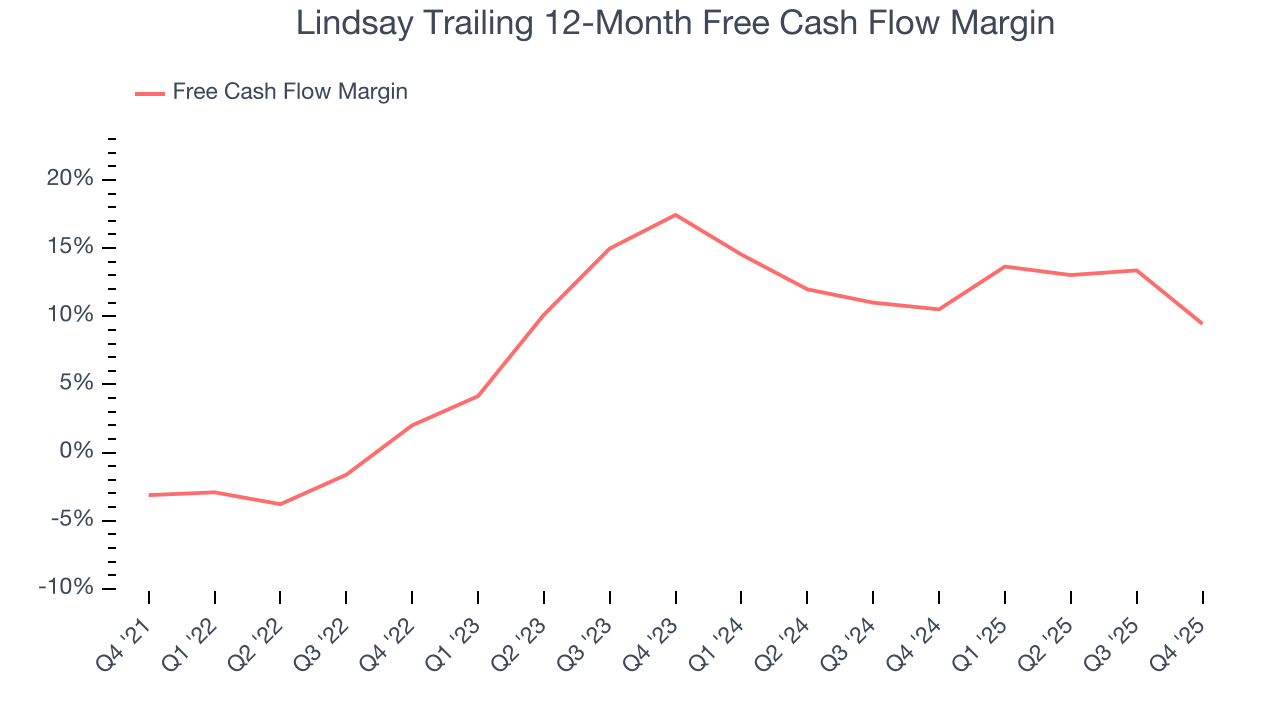
Lindsay burned through $15.07 million of cash in Q4, equivalent to a negative 9.7% margin. The company’s cash flow turned negative after being positive in the same quarter last year, prompting us to pay closer attention. Short-term fluctuations typically aren’t a big deal because investment needs can be seasonal, but we’ll be watching to see if the trend extrapolates into future quarters.
10. Return on Invested Capital (ROIC)
EPS and free cash flow tell us whether a company was profitable while growing its revenue. But was it capital-efficient? Enter ROIC, a metric showing how much operating profit a company generates relative to the money it has raised (debt and equity).
Although Lindsay hasn’t been the highest-quality company lately, it historically found a few growth initiatives that worked out well. Its five-year average ROIC was 16.4%, impressive for an industrials business.
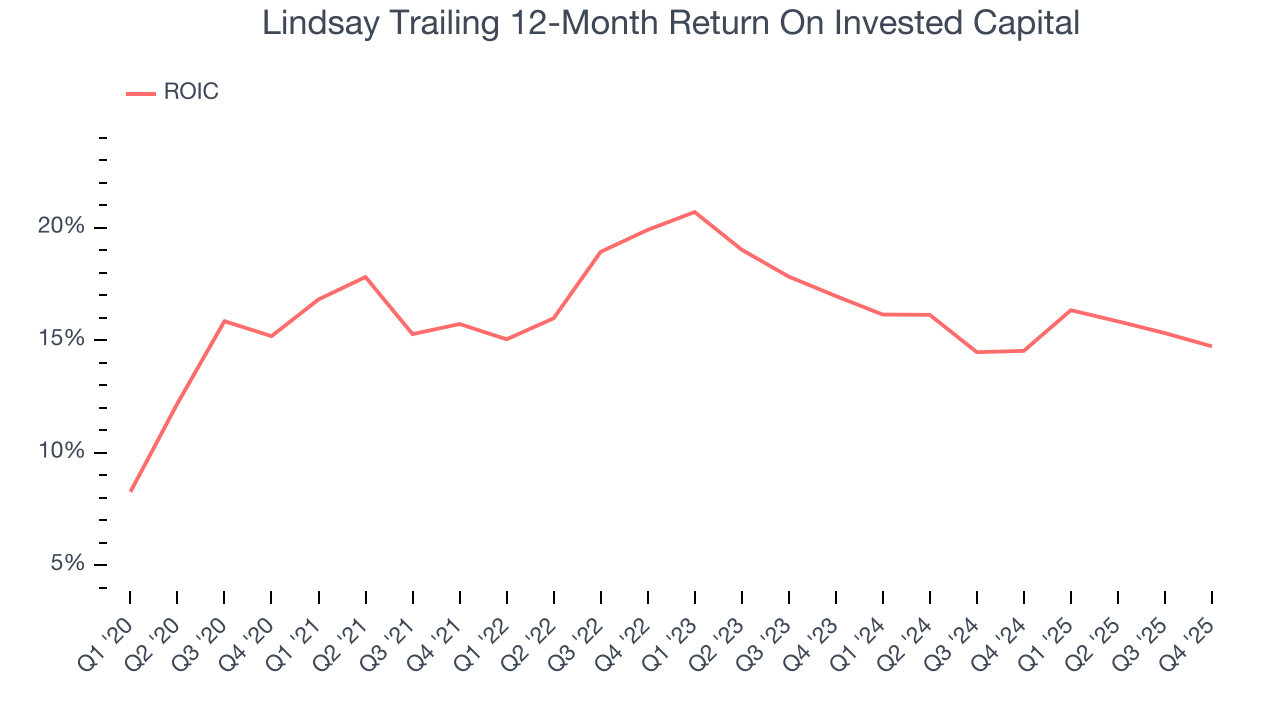
We like to invest in businesses with high returns, but the trend in a company’s ROIC is what often surprises the market and moves the stock price. On average, Lindsay’s ROIC decreased by 3.2 percentage points annually over the last few years. We like what management has done in the past, but its declining returns are perhaps a symptom of fewer profitable growth opportunities.
11. Balance Sheet Assessment
One of the best ways to mitigate bankruptcy risk is to hold more cash than debt.
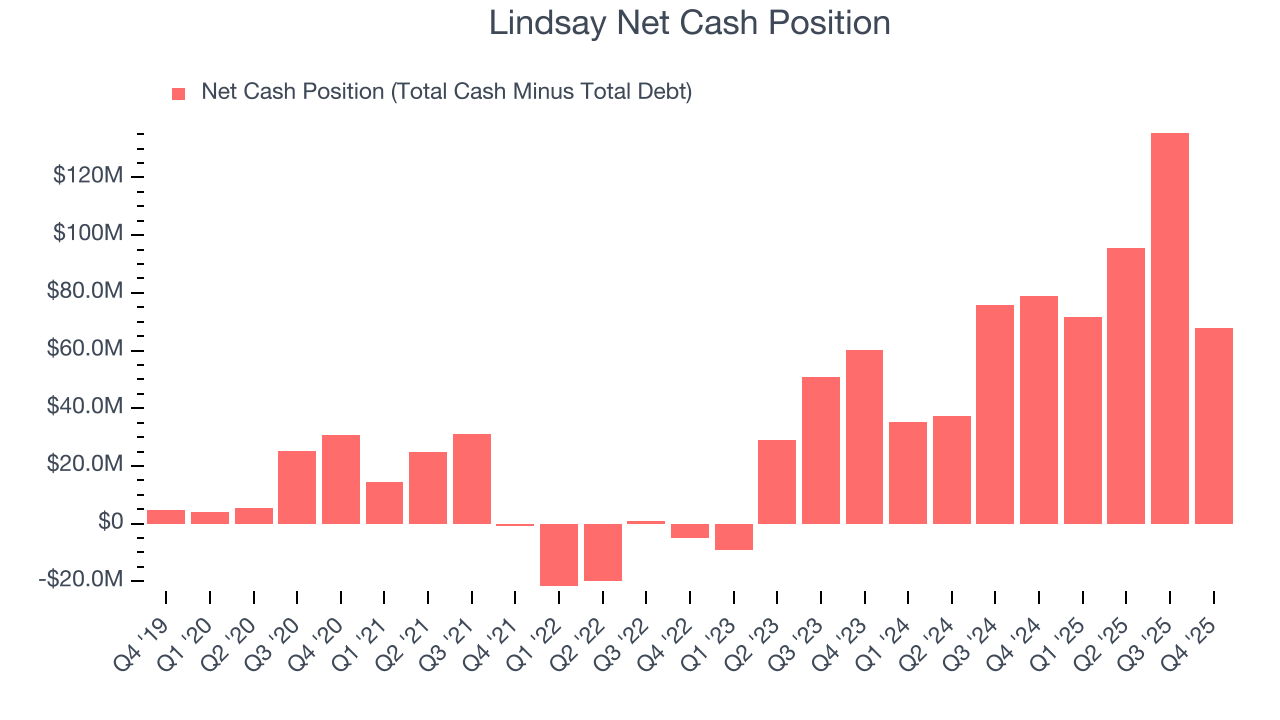
Lindsay is a profitable, well-capitalized company with $199.6 million of cash and $131.7 million of debt on its balance sheet. This $67.92 million net cash position is 5.4% of its market cap and gives it the freedom to borrow money, return capital to shareholders, or invest in growth initiatives. Leverage is not an issue here.
12. Key Takeaways from Lindsay’s Q4 Results
Revenue in the quarter missed quite badly. The company did manage to beat on the EPS line with better profit performance, but this wasn't enough. The stock traded down 5% to $113 immediately after reporting.
13. Is Now The Time To Buy Lindsay?
Updated: March 14, 2026 at 11:22 PM EDT
When considering an investment in Lindsay, investors should account for its valuation and business qualities as well as what’s happened in the latest quarter.
Lindsay isn’t a terrible business, but it doesn’t pass our quality test. First off, its revenue growth was mediocre over the last five years, and analysts expect its demand to deteriorate over the next 12 months. While its rising cash profitability gives it more optionality, the downside is its projected EPS for the next year is lacking. On top of that, its diminishing returns show management's prior bets haven't worked out.
Lindsay’s P/E ratio based on the next 12 months is 19.9x. While this valuation is reasonable, we don’t really see a big opportunity at the moment. We're fairly confident there are better investments elsewhere.
Wall Street analysts have a consensus one-year price target of $134 on the company (compared to the current share price of $125.44).