
Quanex (NX)
We’re skeptical of Quanex. Its sales have underperformed and its low returns on capital show it has few growth opportunities.― StockStory Analyst Team
1. News


2. Summary
Why We Think Quanex Will Underperform
Starting in the seamless tube industry, Quanex (NYSE:NX) manufactures building products like window, door, kitchen, and bath cabinet components.
- Estimated sales growth of 1.1% for the next 12 months implies demand will slow from its two-year trend
- Subpar operating margin constrains its ability to invest in process improvements or effectively respond to new competitive threats
- One positive is that its impressive 15.8% annual revenue growth over the last five years indicates it’s winning market share this cycle


Quanex’s quality is lacking. There’s a wealth of better opportunities.
Why There Are Better Opportunities Than Quanex


Quanex’s stock price of $17.26 implies a valuation ratio of 8.3x forward P/E. This certainly seems like a cheap stock, but we think there are valid reasons why it trades this way.
Cheap stocks can look like a great deal at first glance, but they can be value traps. They often have less earnings power, meaning there is more reliance on a re-rating to generate good returns - an unlikely scenario for low-quality companies.
3. Quanex (NX) Research Report: Q4 CY2025 Update
Building products company Quanex (NYSE:NX) beat Wall Street’s revenue expectations in Q4 CY2025, with sales up 2.3% year on year to $409.1 million. The company’s full-year revenue guidance of $1.86 billion at the midpoint came in 0.8% above analysts’ estimates. Its non-GAAP loss of $0.01 per share was 82.6% above analysts’ consensus estimates.
Quanex (NX) Q4 CY2025 Highlights:
- Revenue: $409.1 million vs analyst estimates of $405.5 million (2.3% year-on-year growth, 0.9% beat)
- Adjusted EPS: -$0.01 vs analyst estimates of -$0.06 (82.6% beat)
- Adjusted EBITDA: $27.38 million vs analyst estimates of $25.64 million (6.7% margin, 6.8% beat)
- EBITDA guidance for the full year is $242.5 million at the midpoint, above analyst estimates of $239.5 million
- Operating Margin: 0.7%, up from -1.7% in the same quarter last year
- Free Cash Flow was -$31.5 million compared to -$24.13 million in the same quarter last year
- Market Capitalization: $903.6 million
Company Overview
Starting in the seamless tube industry, Quanex (NYSE:NX) manufactures building products like window, door, kitchen, and bath cabinet components.
The company is an original equipment manufacturer (OEM) for products in the building materials industry. Its customers, which include national and regional residential window, door, and cabinet manufacturers, come to the company to buy the components needed to build their respective products.
For example, Quanex offers products like energy-efficient flexible insulating glass spaces, extruded vinyl profiles, and window and door screens, which are all components needed to manufacture windows and doors. This market is called the fenestration component market, which just means parts for the windows and doors industry. The company also offers non-fenestration products, like solar panel sealants, trim moldings, decking, fencing, and water retention barriers.
The sale of its fenestration products makes up most of the company’s revenue. These products are sold, through direct marketing, to building product manufacturers and suppliers in the construction industry. Its revenue can be divided into four revenue-generating segments, with North American Fenestration sales leading the way, followed by European Fenestration, North American Cabinet Components, and the Unallocated Corporate and Others segment.
4. Home Construction Materials
Traditionally, home construction materials companies have built economic moats with expertise in specialized areas, brand recognition, and strong relationships with contractors. More recently, advances to address labor availability and job site productivity have spurred innovation that is driving incremental demand. However, these companies are at the whim of residential construction volumes, which tend to be cyclical and can be impacted heavily by economic factors such as interest rates. Additionally, the costs of raw materials can be driven by a myriad of worldwide factors and greatly influence the profitability of home construction materials companies.
Competitors of Quanex include JELD-WEN (NYSE:JELD) and private companies Pella and Anderson.
5. Revenue Growth
A company’s long-term performance is an indicator of its overall quality. Any business can have short-term success, but a top-tier one grows for years. Thankfully, Quanex’s 15.8% annualized revenue growth over the last five years was incredible. Its growth beat the average industrials company and shows its offerings resonate with customers.
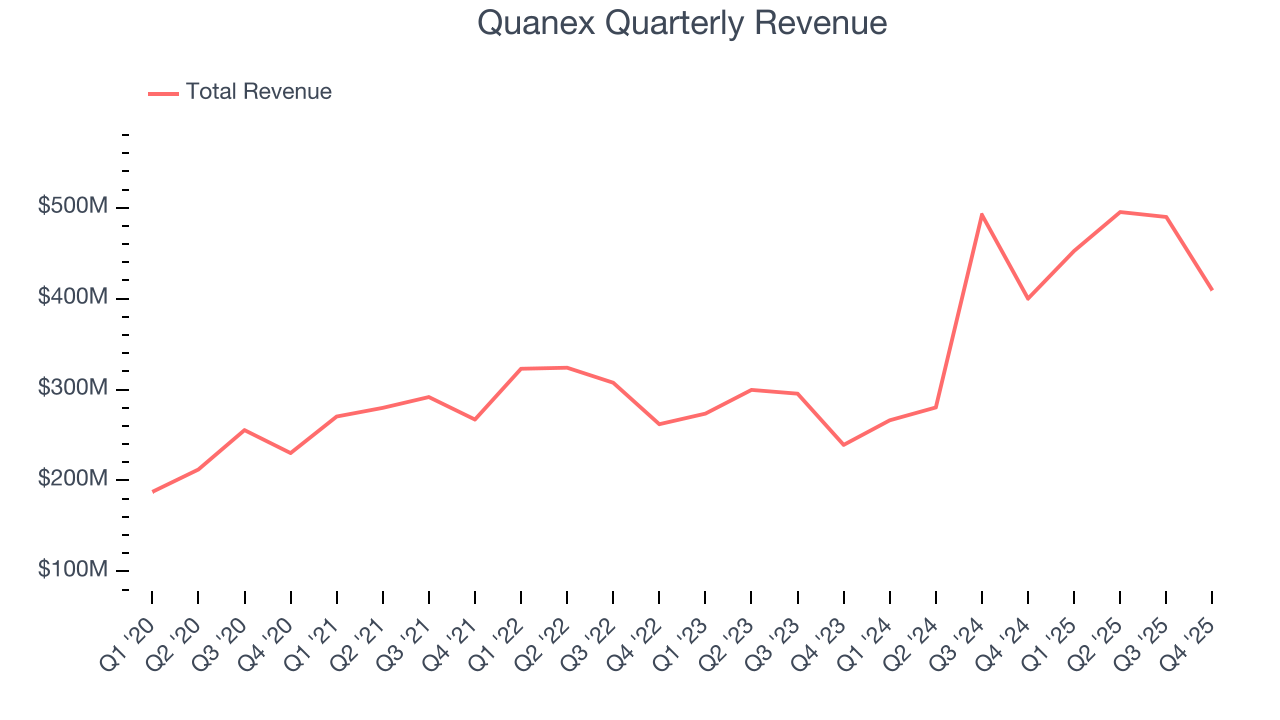
Long-term growth is the most important, but within industrials, a half-decade historical view may miss new industry trends or demand cycles. Quanex’s annualized revenue growth of 29.1% over the last two years is above its five-year trend, suggesting its demand was strong and recently accelerated. 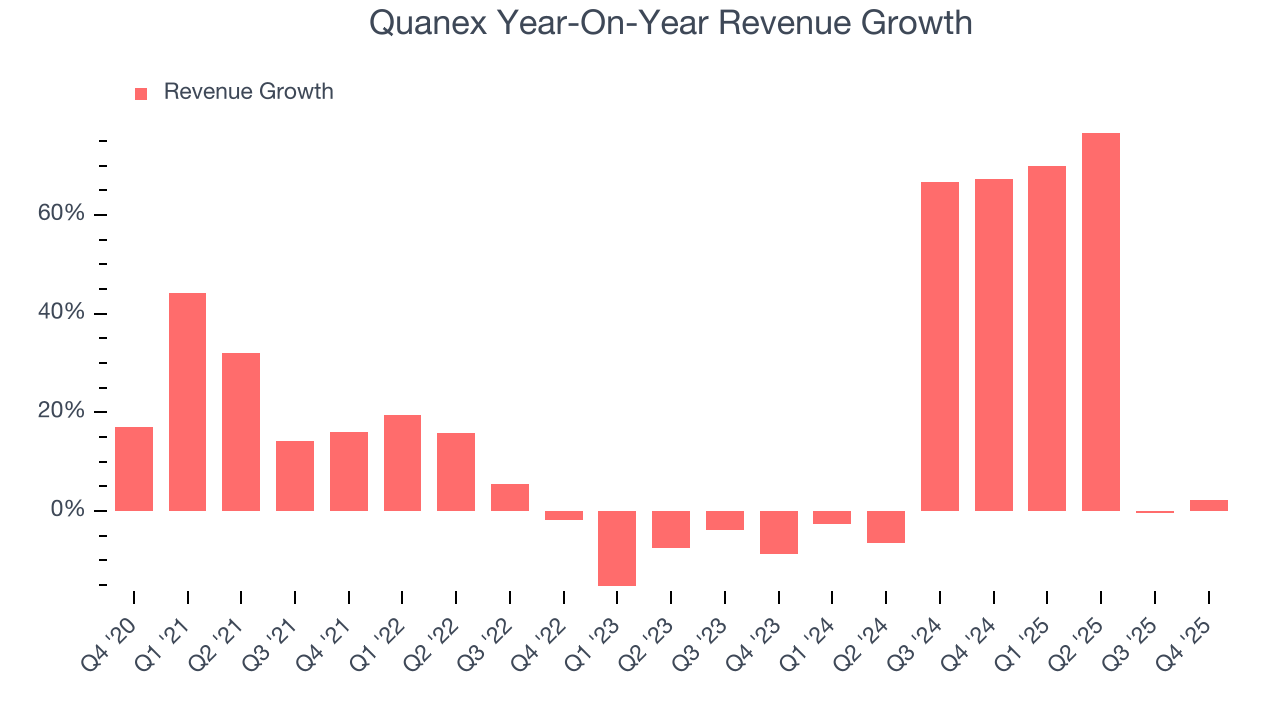
We can better understand the company’s revenue dynamics by analyzing its most important segments, Fenestration and Cabinet Components, which are 32.8% and 10.7% of revenue. Over the last two years, Quanex’s Fenestration revenue (window and door components, North America only) averaged 7.6% year-on-year declines while its Cabinet Components revenue (cabinet parts, North America only) was flat. 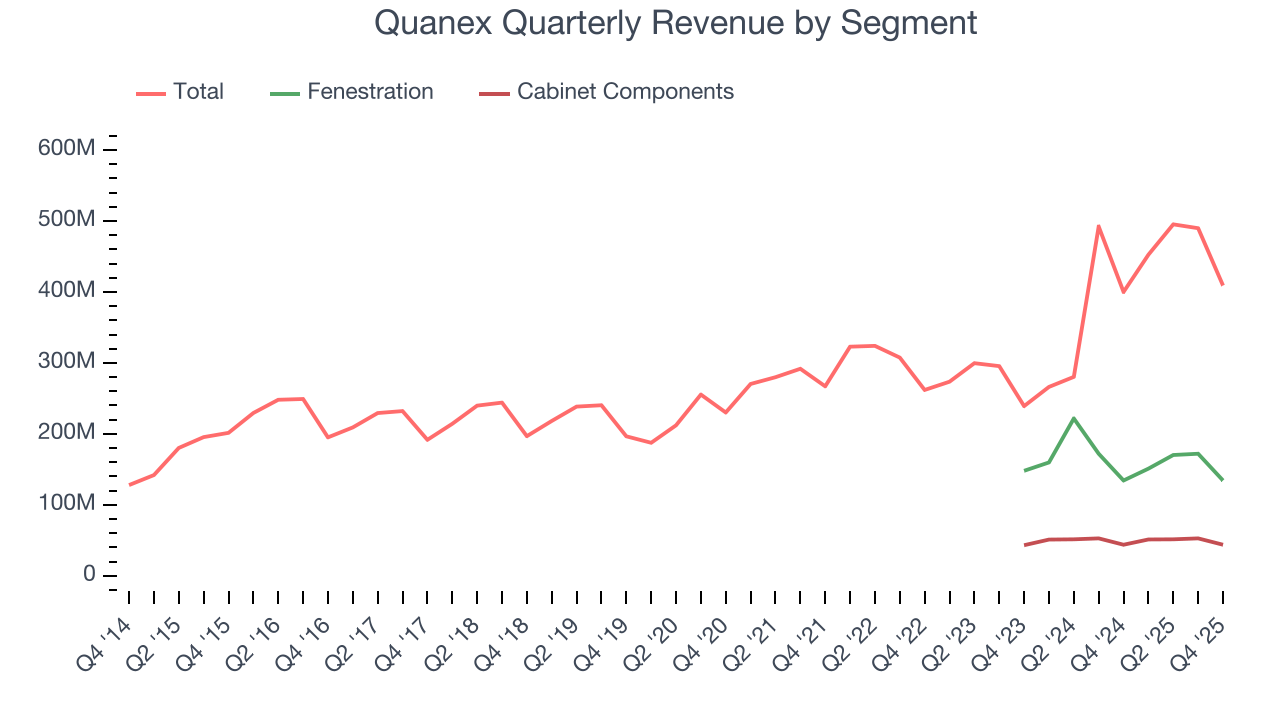
This quarter, Quanex reported modest year-on-year revenue growth of 2.3% but beat Wall Street’s estimates by 0.9%.
Looking ahead, sell-side analysts expect revenue to remain flat over the next 12 months, a deceleration versus the last two years. This projection is underwhelming and suggests its products and services will see some demand headwinds.
6. Gross Margin & Pricing Power
All else equal, we prefer higher gross margins because they make it easier to generate more operating profits and indicate that a company commands pricing power by offering more differentiated products.
Quanex has bad unit economics for an industrials company, giving it less room to reinvest and develop new offerings. As you can see below, it averaged a 24.4% gross margin over the last five years. That means Quanex paid its suppliers a lot of money ($75.65 for every $100 in revenue) to run its business. 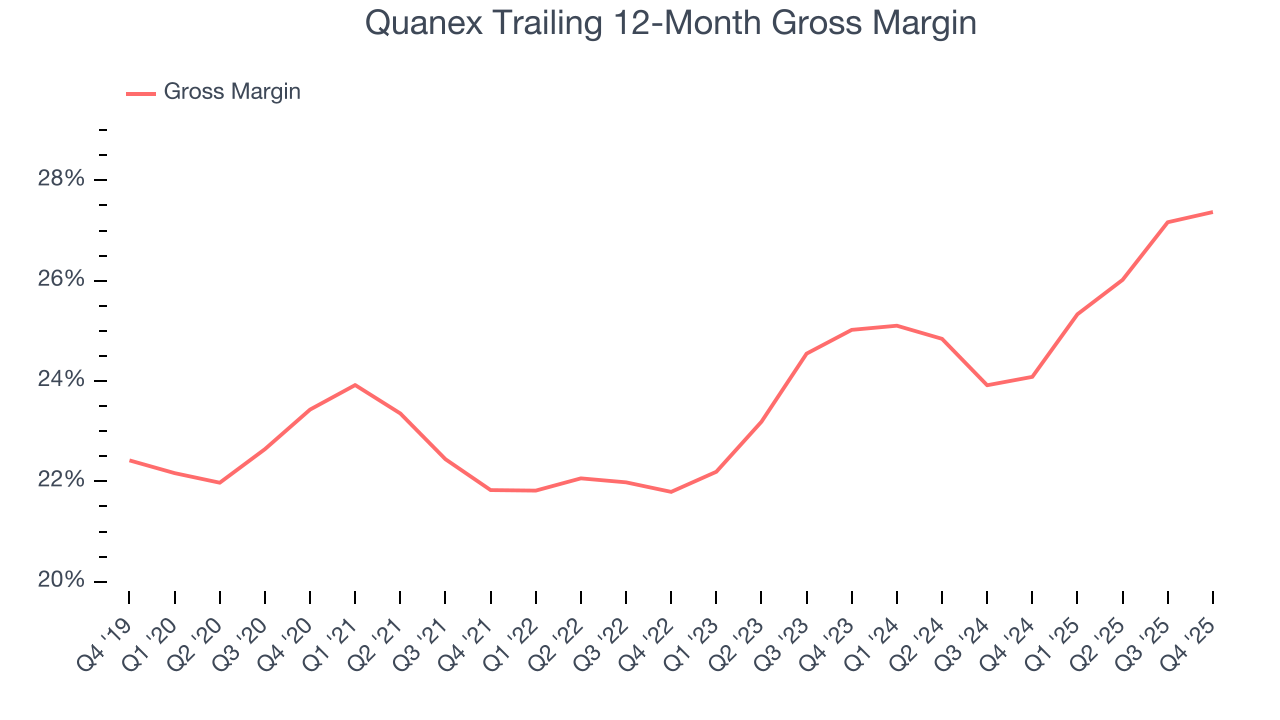
In Q4, Quanex produced a 24.1% gross profit margin, up 1 percentage points year on year. Quanex’s full-year margin has also been trending up over the past 12 months, increasing by 3.3 percentage points. If this move continues, it could suggest better unit economics due to more leverage from its growing sales on the fixed portion of its cost of goods sold (such as manufacturing expenses).
7. Operating Margin
Operating margin is an important measure of profitability as it shows the portion of revenue left after accounting for all core expenses – everything from the cost of goods sold to advertising and wages. It’s also useful for comparing profitability across companies with different levels of debt and tax rates because it excludes interest and taxes.
Quanex was profitable over the last five years but held back by its large cost base. Its average operating margin of 2.3% was weak for an industrials business. This result isn’t too surprising given its low gross margin as a starting point.
Looking at the trend in its profitability, Quanex’s operating margin decreased by 17.6 percentage points over the last five years. This raises questions about the company’s expense base because its revenue growth should have given it leverage on its fixed costs, resulting in better economies of scale and profitability. Quanex’s performance was poor no matter how you look at it - it shows that costs were rising and it couldn’t pass them onto its customers.
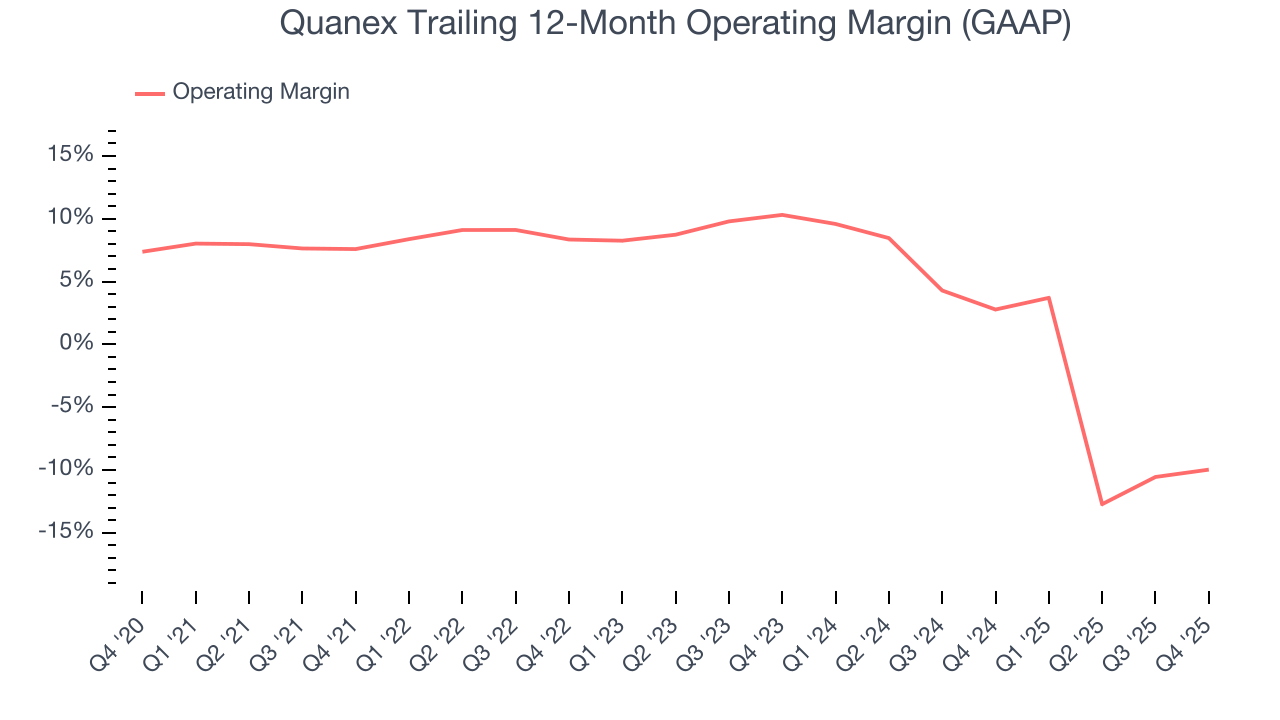
This quarter, Quanex’s breakeven margin was 0.7%, up 2.4 percentage points year on year. The increase was encouraging, and because its operating margin rose more than its gross margin, we can infer it was more efficient with expenses such as marketing, R&D, and administrative overhead.
8. Earnings Per Share
Revenue trends explain a company’s historical growth, but the long-term change in earnings per share (EPS) points to the profitability of that growth – for example, a company could inflate its sales through excessive spending on advertising and promotions.
Quanex’s EPS grew at an unimpressive 7.5% compounded annual growth rate over the last five years, lower than its 15.8% annualized revenue growth. This tells us the company became less profitable on a per-share basis as it expanded.
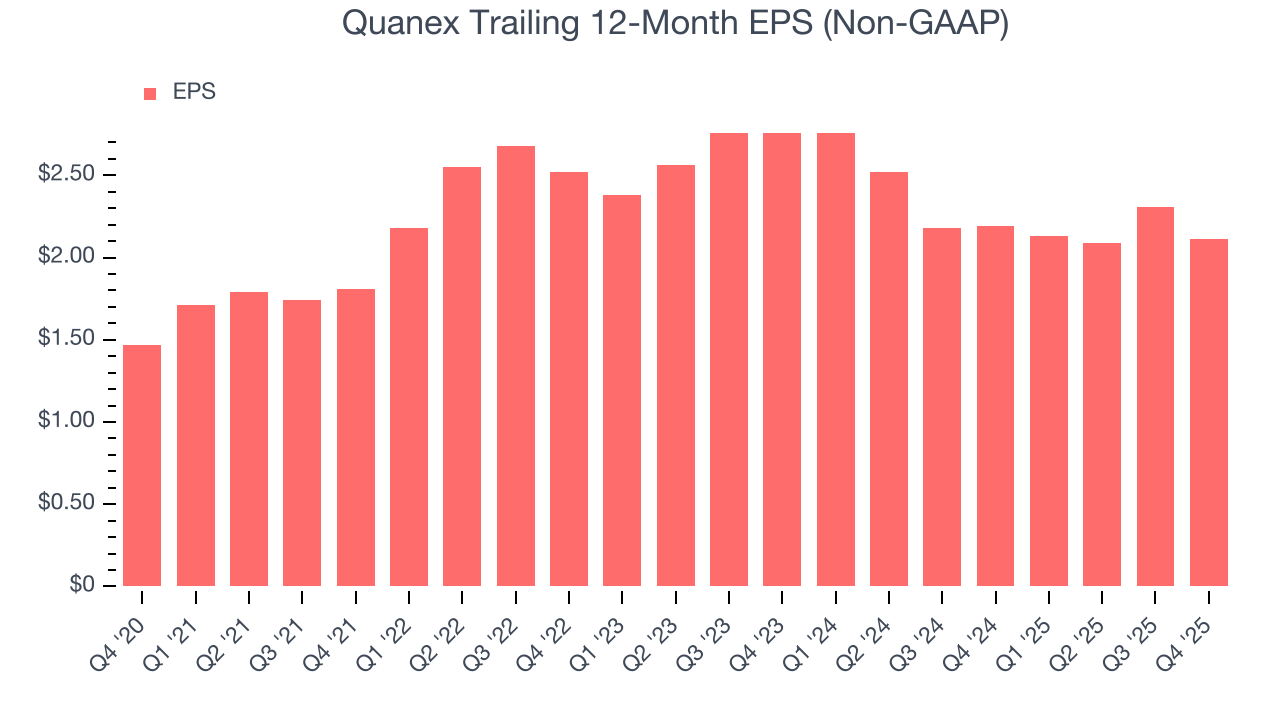
We can take a deeper look into Quanex’s earnings to better understand the drivers of its performance. As we mentioned earlier, Quanex’s operating margin expanded this quarter but declined by 17.6 percentage points over the last five years. Its share count also grew by 36.9%, meaning the company not only became less efficient with its operating expenses but also diluted its shareholders. 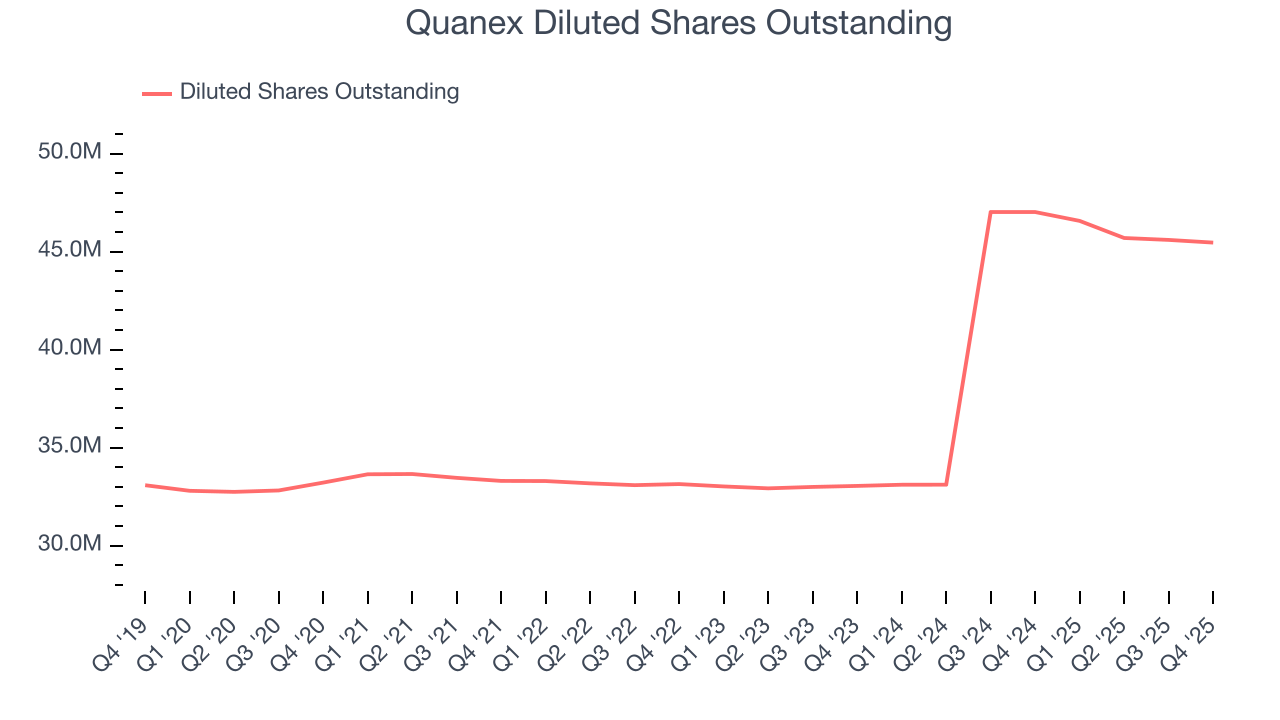
Like with revenue, we analyze EPS over a shorter period to see if we are missing a change in the business.
For Quanex, its two-year annual EPS declines of 12.6% show it’s continued to underperform. These results were bad no matter how you slice the data.
In Q4, Quanex reported adjusted EPS of negative $0.01, down from $0.19 in the same quarter last year. Despite falling year on year, this print easily cleared analysts’ estimates. Over the next 12 months, Wall Street expects Quanex’s full-year EPS of $2.11 to grow 2.8%.
9. Cash Is King
If you’ve followed StockStory for a while, you know we emphasize free cash flow. Why, you ask? We believe that in the end, cash is king, and you can’t use accounting profits to pay the bills.
Quanex has shown mediocre cash profitability relative to peers over the last five years, giving the company fewer opportunities to return capital to shareholders. Its free cash flow margin averaged 5.4%, below what we’d expect for an industrials business.
Taking a step back, an encouraging sign is that Quanex’s margin expanded by 2.1 percentage points during that time. The company’s improvement shows it’s heading in the right direction, and we can see it became a less capital-intensive business because its free cash flow profitability rose while its operating profitability fell.
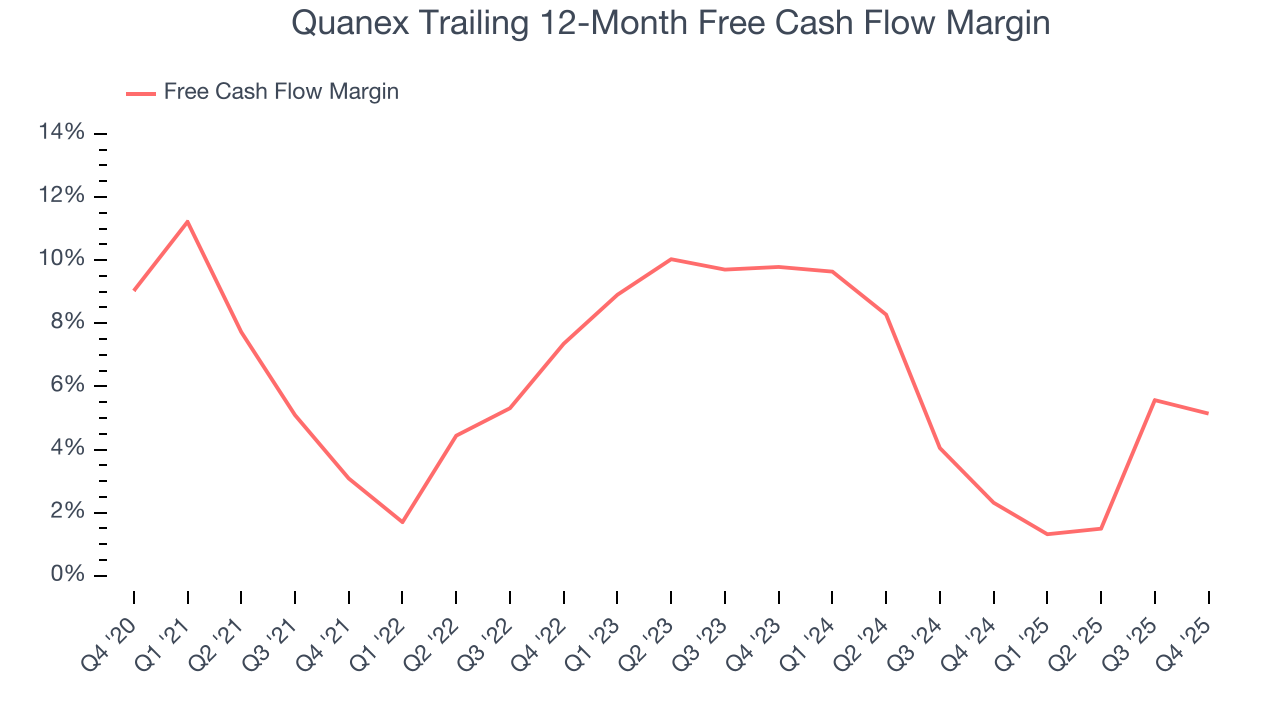
Quanex burned through $31.5 million of cash in Q4, equivalent to a negative 7.7% margin. The company’s cash burn was similar to its $24.13 million of lost cash in the same quarter last year. These numbers deviate from its longer-term margin, indicating it is a seasonal business that must build up inventory during certain quarters.
10. Return on Invested Capital (ROIC)
EPS and free cash flow tell us whether a company was profitable while growing its revenue. But was it capital-efficient? A company’s ROIC explains this by showing how much operating profit it makes compared to the money it has raised (debt and equity).
Quanex historically did a mediocre job investing in profitable growth initiatives. Its five-year average ROIC was 7.4%, somewhat low compared to the best industrials companies that consistently pump out 20%+.
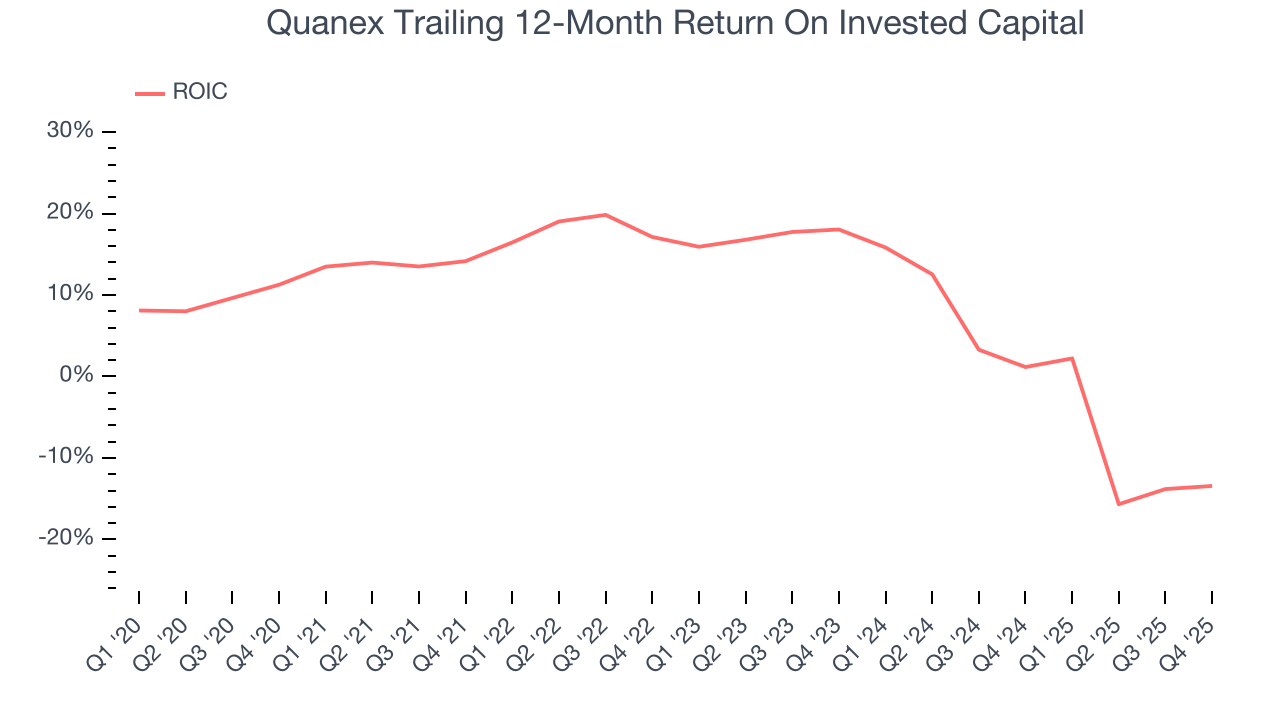
We like to invest in businesses with high returns, but the trend in a company’s ROIC is what often surprises the market and moves the stock price. Unfortunately, Quanex’s ROIC has decreased significantly over the last few years. Paired with its already low returns, these declines suggest its profitable growth opportunities are few and far between.
11. Balance Sheet Assessment
Quanex reported $64.64 million of cash and $892.6 million of debt on its balance sheet in the most recent quarter. As investors in high-quality companies, we primarily focus on two things: 1) that a company’s debt level isn’t too high and 2) that its interest payments are not excessively burdening the business.
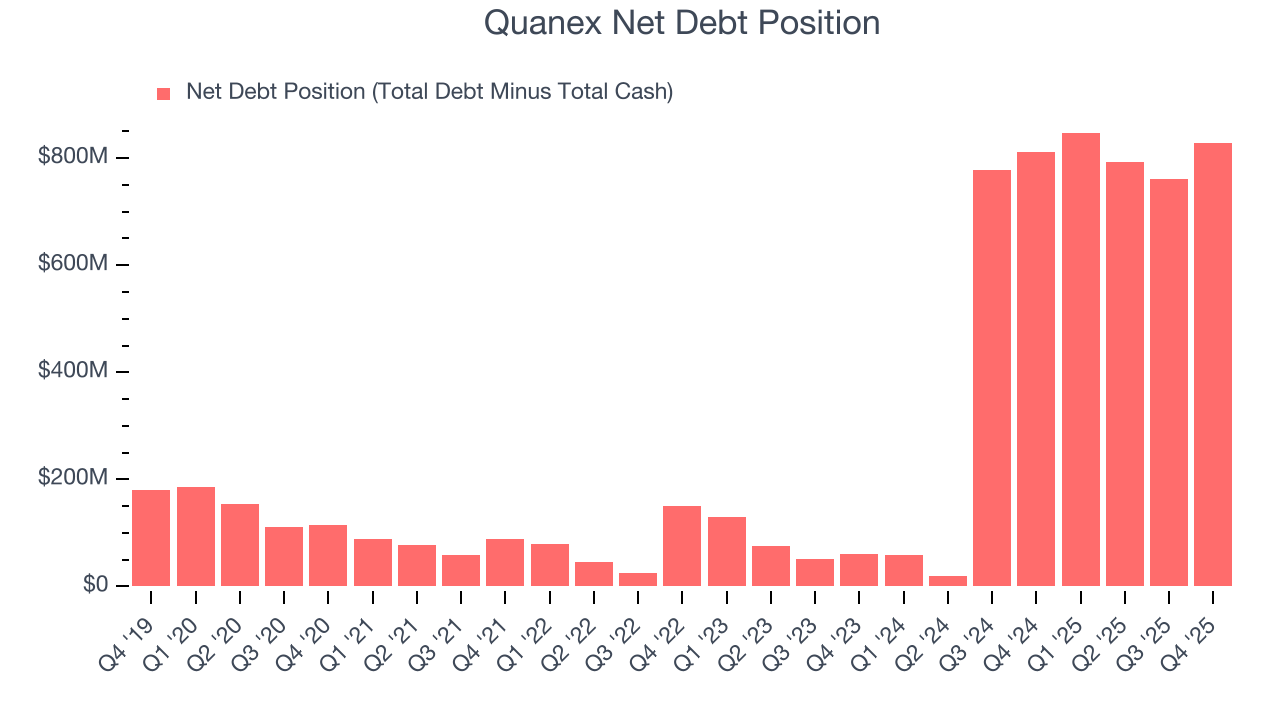
With $231.7 million of EBITDA over the last 12 months, we view Quanex’s 3.6× net-debt-to-EBITDA ratio as safe. We also see its $27.79 million of annual interest expenses as appropriate. The company’s profits give it plenty of breathing room, allowing it to continue investing in growth initiatives.
12. Key Takeaways from Quanex’s Q4 Results
It was good to see Quanex beat analysts’ EPS expectations this quarter. We were also glad its EBITDA outperformed Wall Street’s estimates. Zooming out, we think this was a good print with some key areas of upside. Investors were likely hoping for more, and shares traded down 1.1% to $18.61 immediately after reporting.
13. Is Now The Time To Buy Quanex?
Updated: March 23, 2026 at 11:38 PM EDT
When considering an investment in Quanex, investors should account for its valuation and business qualities as well as what’s happened in the latest quarter.
Quanex isn’t a terrible business, but it isn’t one of our picks. Although its revenue growth was exceptional over the last five years, it’s expected to deteriorate over the next 12 months and its diminishing returns show management's prior bets haven't worked out. And while the company’s rising cash profitability gives it more optionality, the downside is its projected EPS for the next year is lacking.
Quanex’s P/E ratio based on the next 12 months is 8.3x. While this valuation is optically cheap, the potential downside is big given its shaky fundamentals. We're pretty confident there are superior stocks to buy right now.
Wall Street analysts have a consensus one-year price target of $28.75 on the company (compared to the current share price of $17.26).
Although the price target is bullish, readers should exercise caution because analysts tend to be overly optimistic. The firms they work for, often big banks, have relationships with companies that extend into fundraising, M&A advisory, and other rewarding business lines. As a result, they typically hesitate to say bad things for fear they will lose out. We at StockStory do not suffer from such conflicts of interest, so we’ll always tell it like it is.