
Standex (SXI)
We aren’t fans of Standex. Its weak sales growth and declining returns on capital show its demand and profits are shrinking.― StockStory Analyst Team
1. News


2. Summary
Why Standex Is Not Exciting
Holding over 500 patents globally, Standex (NYSE:SXI) is a manufacturer and distributor of industrial components for various sectors.
- Estimated sales growth of 6.9% for the next 12 months implies demand will slow from its two-year trend
- On the plus side, its earnings growth has outpaced its peers over the last five years as its EPS has compounded at 18.1% annually


Standex doesn’t meet our quality criteria. Better stocks can be found in the market.
Why There Are Better Opportunities Than Standex


Standex is trading at $254.15 per share, or 27.8x forward P/E. This multiple is higher than most industrials companies, and we think it’s quite expensive for the quality you get.
There are stocks out there featuring similar valuation multiples with better fundamentals. We prefer to invest in those.
3. Standex (SXI) Research Report: Q4 CY2025 Update
Industrial manufacturer Standex (NYSE:SXI) announced better-than-expected revenue in Q4 CY2025, with sales up 16.6% year on year to $221.3 million. Its non-GAAP profit of $2.08 per share was 4.7% above analysts’ consensus estimates.
Standex (SXI) Q4 CY2025 Highlights:
- Revenue: $221.3 million vs analyst estimates of $219.7 million (16.6% year-on-year growth, 0.7% beat)
- Adjusted EPS: $2.08 vs analyst estimates of $1.99 (4.7% beat)
- Operating Margin: 16.1%, up from 13.6% in the same quarter last year
- Free Cash Flow Margin: 5.9%, up from 1.1% in the same quarter last year
- Market Capitalization: $2.93 billion
Company Overview
Holding over 500 patents globally, Standex (NYSE:SXI) is a manufacturer and distributor of industrial components for various sectors.
The conglomerate that we know today was founded in 1955 as a manufacturer of food service equipment. Acquisitions were important for expanding its product offerings, customer base, and market presence. In particular, the acquisition of Enginetics in 2017 (aerospace component provider) and Renco in 2013 (manufacturer of transformers and inductors) were pivotal for the company.
From engineered components to advanced engraving technologies, the company offers a plethora of products that service the food service, aerospace, electronics, health, and industrial markets. Its most prominent offerings are its electronics, providing different kinds of components and systems (sensors, switches, and connectors). These products are used for efficient power management, connectivity in electronic devices, and accurate measurement.
In addition to its products, Standex offers manufacturing and engineering services to its customers which generates additional revenue. Furthermore, the company offers its clients with volume discounts, where the per-price unit of its products are lower, in order to incentivize customers to purchase larger quantities and promote customer loyalty. Standex sells its products through its direct sales force, distributors, original equipment manufacturers (OEMs), and online platforms. Its sales are primarily through long-term contracts that include supply and service agreements.
4. Gas and Liquid Handling
Gas and liquid handling companies possess the technical know-how and specialized equipment to handle valuable (and sometimes dangerous) substances. Lately, water conservation and carbon capture–which requires hydrogen and other gasses as well as specialized infrastructure–have been trending up, creating new demand for products such as filters, pumps, and valves. On the other hand, gas and liquid handling companies are at the whim of economic cycles. Consumer spending and interest rates, for example, can greatly impact the industrial production that drives demand for these companies’ offerings.
Competitors offering similar products include Illinois Tool Works (NYSE:ITW), Dover (NYSE:DOV), and Middleby (NASDAQ:MIDD).
5. Revenue Growth
A company’s long-term sales performance is one signal of its overall quality. Any business can experience short-term success, but top-performing ones enjoy sustained growth for years. Luckily, Standex’s sales grew at a decent 7.6% compounded annual growth rate over the last five years. Its growth was slightly above the average industrials company and shows its offerings resonate with customers.
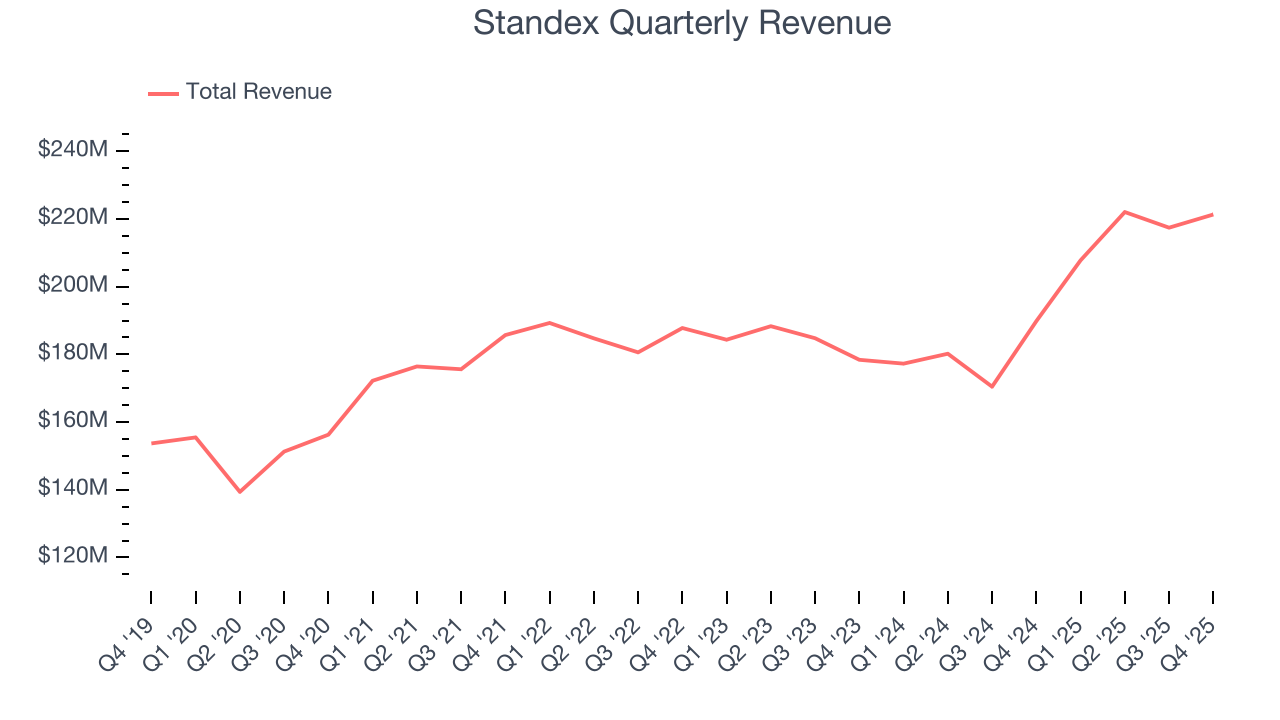
We at StockStory place the most emphasis on long-term growth, but within industrials, a half-decade historical view may miss cycles, industry trends, or a company capitalizing on catalysts such as a new contract win or a successful product line. Standex’s annualized revenue growth of 8.6% over the last two years is above its five-year trend, suggesting some bright spots. 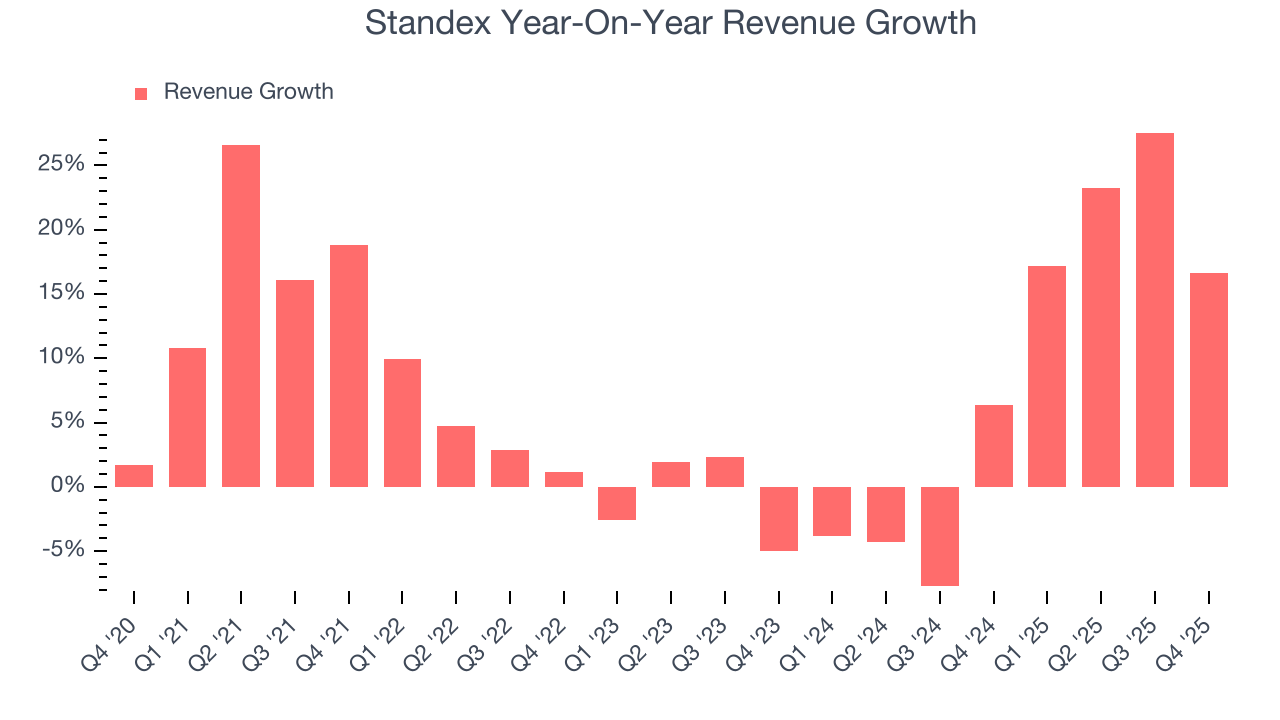
This quarter, Standex reported year-on-year revenue growth of 16.6%, and its $221.3 million of revenue exceeded Wall Street’s estimates by 0.7%.
Looking ahead, sell-side analysts expect revenue to grow 7.2% over the next 12 months, similar to its two-year rate. This projection is underwhelming and suggests its products and services will see some demand headwinds.
6. Gross Margin & Pricing Power
Standex’s unit economics are great compared to the broader industrials sector and signal that it enjoys product differentiation through quality or brand. As you can see below, it averaged an excellent 38.8% gross margin over the last five years. Said differently, roughly $38.79 was left to spend on selling, marketing, R&D, and general administrative overhead for every $100 in revenue. 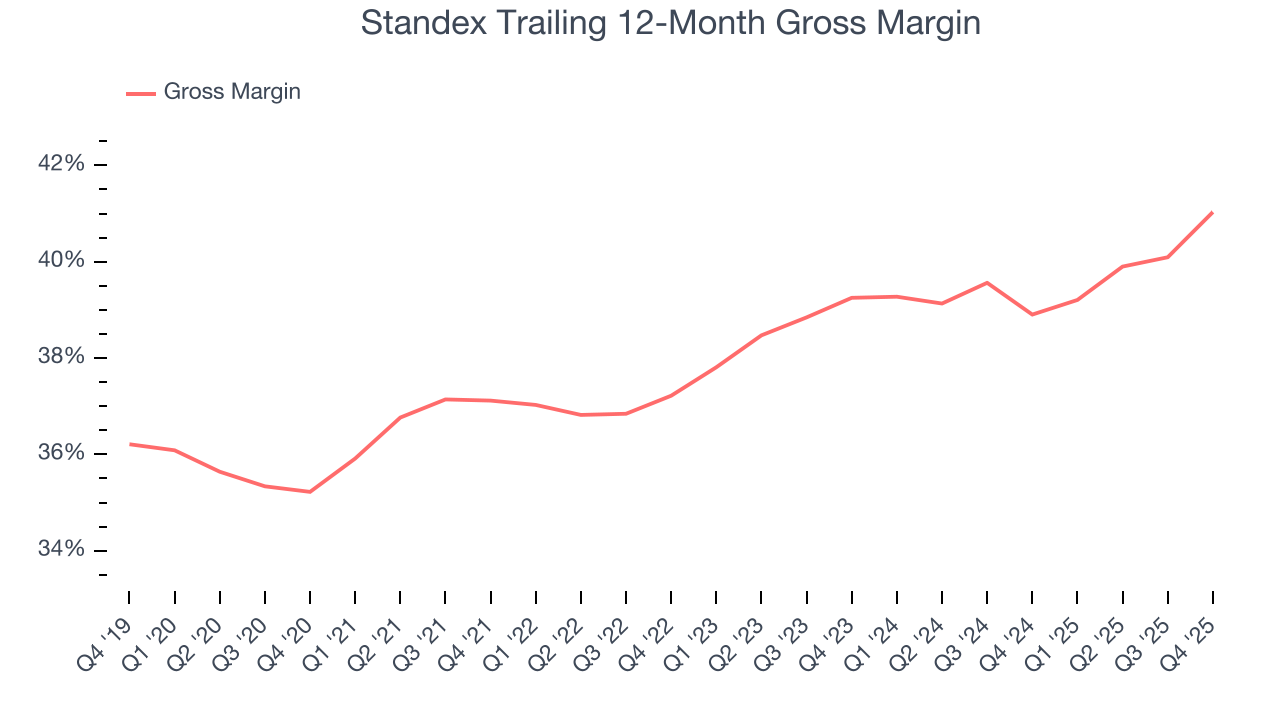
Standex’s gross profit margin came in at 41.7% this quarter, up 4 percentage points year on year. Standex’s full-year margin has also been trending up over the past 12 months, increasing by 2.1 percentage points. If this move continues, it could suggest better unit economics due to more leverage from its growing sales on the fixed portion of its cost of goods sold (such as manufacturing expenses).
7. Operating Margin
Standex has been an efficient company over the last five years. It was one of the more profitable businesses in the industrials sector, boasting an average operating margin of 14.9%. This result isn’t surprising as its high gross margin gives it a favorable starting point.
Analyzing the trend in its profitability, Standex’s operating margin rose by 3.1 percentage points over the last five years, as its sales growth gave it operating leverage.
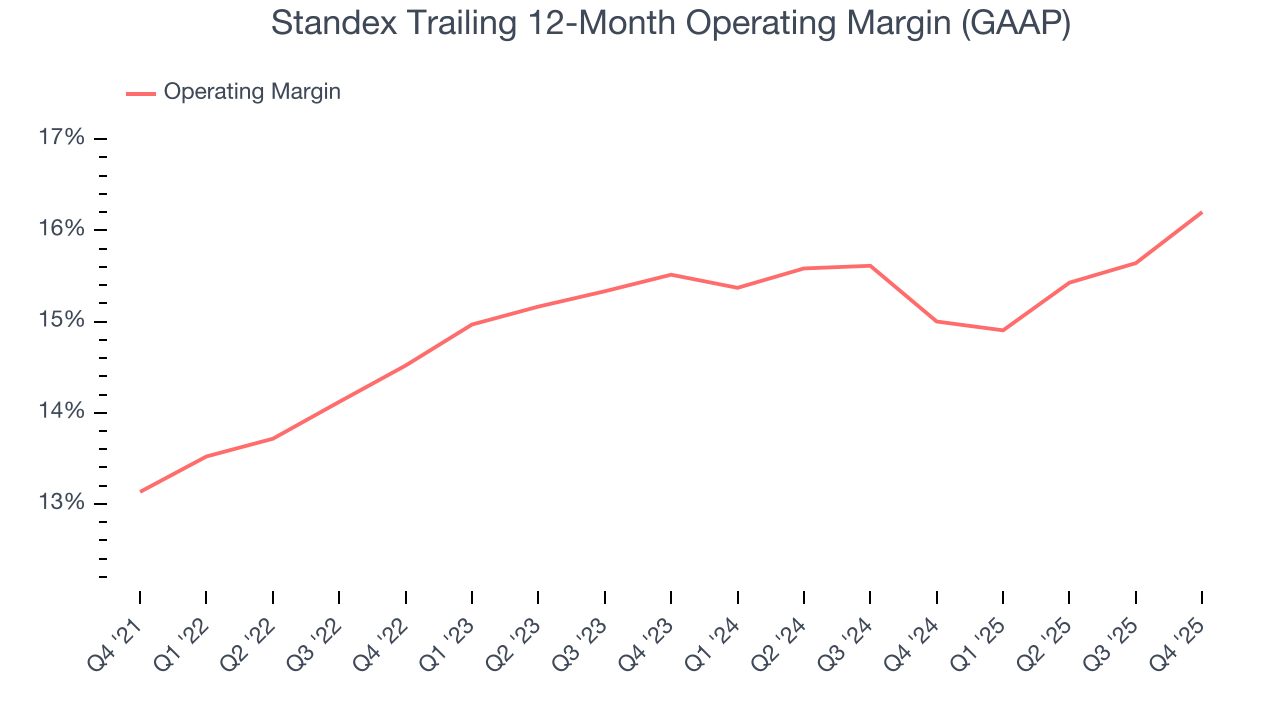
This quarter, Standex generated an operating margin profit margin of 16.1%, up 2.5 percentage points year on year. Since its gross margin expanded more than its operating margin, we can infer that leverage on its cost of sales was the primary driver behind the recently higher efficiency.
8. Earnings Per Share
We track the long-term change in earnings per share (EPS) for the same reason as long-term revenue growth. Compared to revenue, however, EPS highlights whether a company’s growth is profitable.
Standex’s EPS grew at an astounding 18.1% compounded annual growth rate over the last five years, higher than its 7.6% annualized revenue growth. This tells us the company became more profitable on a per-share basis as it expanded.
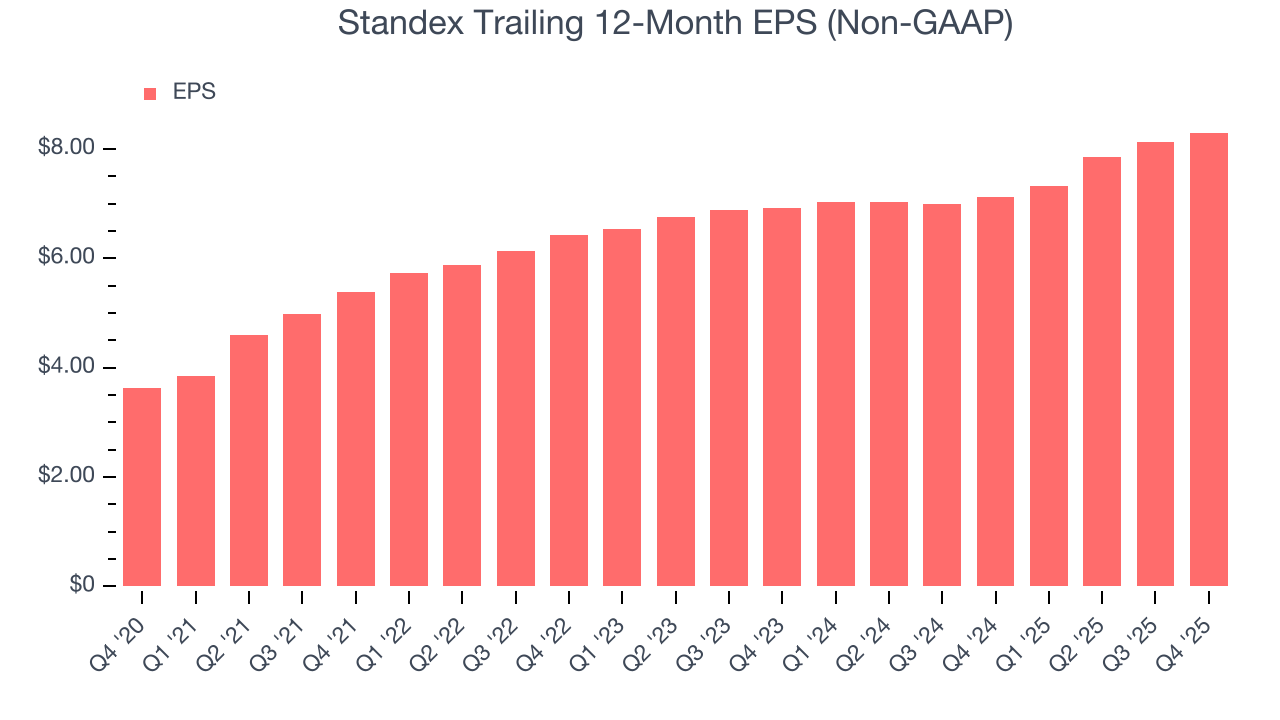
We can take a deeper look into Standex’s earnings to better understand the drivers of its performance. As we mentioned earlier, Standex’s operating margin expanded by 3.1 percentage points over the last five years. On top of that, its share count shrank by 1.8%. These are positive signs for shareholders because improving profitability and share buybacks turbocharge EPS growth relative to revenue growth. 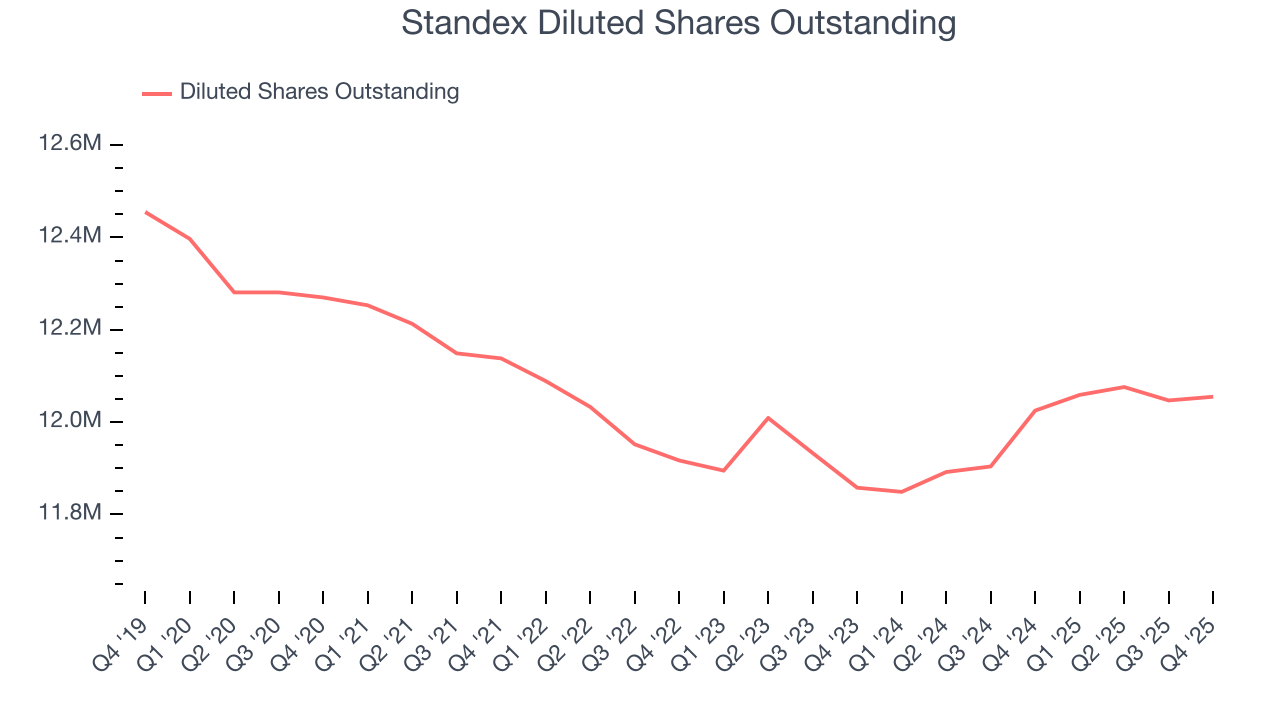
Like with revenue, we analyze EPS over a shorter period to see if we are missing a change in the business.
For Standex, its two-year annual EPS growth of 9.4% was lower than its five-year trend. We hope its growth can accelerate in the future.
In Q4, Standex reported adjusted EPS of $2.08, up from $1.91 in the same quarter last year. This print beat analysts’ estimates by 4.7%. Over the next 12 months, Wall Street expects Standex’s full-year EPS of $8.30 to grow 10.2%.
9. Cash Is King
Although earnings are undoubtedly valuable for assessing company performance, we believe cash is king because you can’t use accounting profits to pay the bills.
Standex has shown impressive cash profitability, enabling it to ride out cyclical downturns more easily while maintaining its investments in new and existing offerings. The company’s free cash flow margin averaged 7.8% over the last five years, better than the broader industrials sector.
Taking a step back, we can see that Standex’s margin dropped by 3.2 percentage points during that time. If its declines continue, it could signal increasing investment needs and capital intensity.
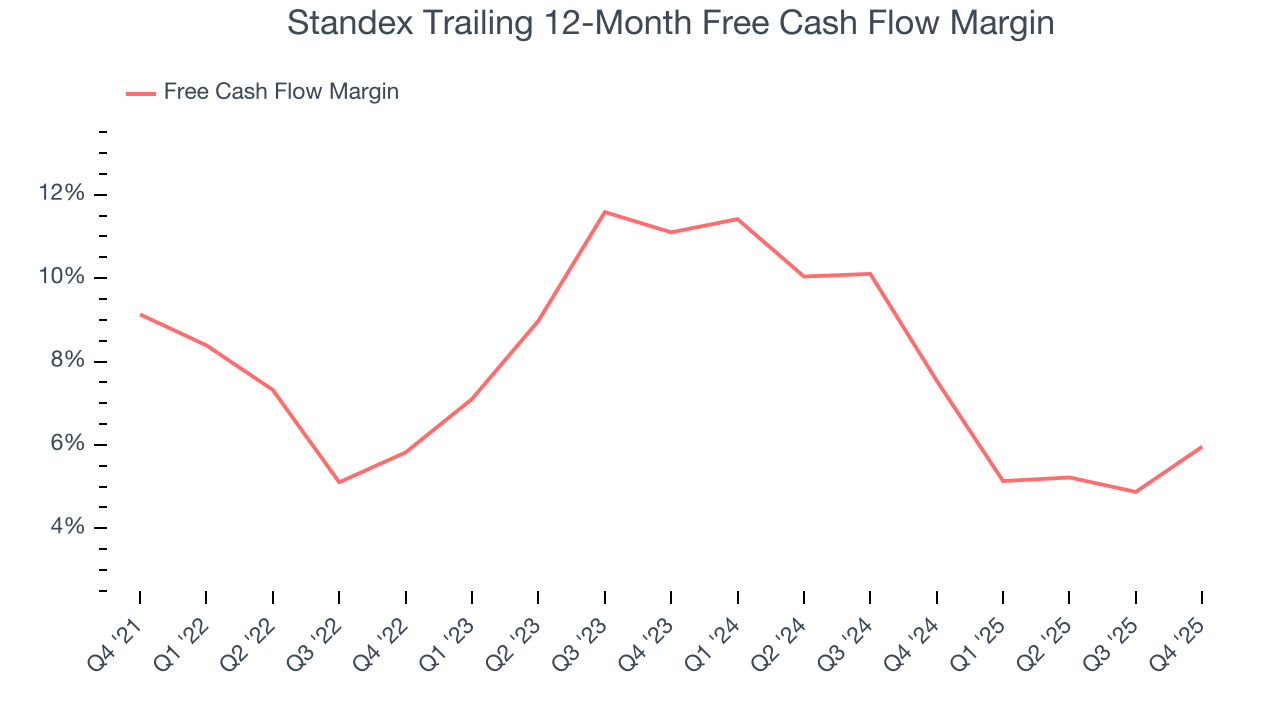
Standex’s free cash flow clocked in at $13.04 million in Q4, equivalent to a 5.9% margin. This result was good as its margin was 4.8 percentage points higher than in the same quarter last year, but we wouldn’t read too much into the short term because investment needs can be seasonal, leading to temporary swings. Long-term trends carry greater meaning.
10. Return on Invested Capital (ROIC)
EPS and free cash flow tell us whether a company was profitable while growing its revenue. But was it capital-efficient? A company’s ROIC explains this by showing how much operating profit it makes compared to the money it has raised (debt and equity).
Although Standex hasn’t been the highest-quality company lately, it historically found a few growth initiatives that worked. Its five-year average ROIC was 12.8%, higher than most industrials businesses.
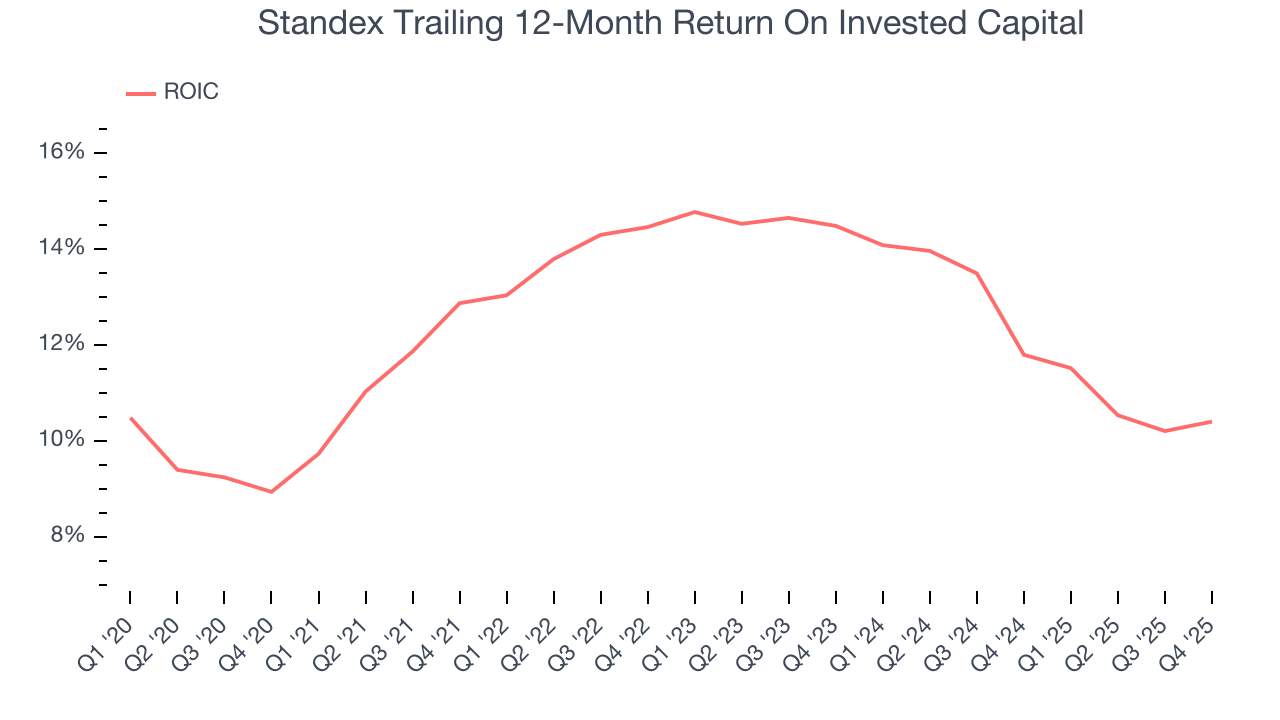
We like to invest in businesses with high returns, but the trend in a company’s ROIC is what often surprises the market and moves the stock price. On average, Standex’s ROIC decreased by 2.6 percentage points annually over the last few years. We like what management has done in the past, but its declining returns are perhaps a symptom of fewer profitable growth opportunities.
11. Balance Sheet Assessment
Standex reported $97 million of cash and $572.7 million of debt on its balance sheet in the most recent quarter. As investors in high-quality companies, we primarily focus on two things: 1) that a company’s debt level isn’t too high and 2) that its interest payments are not excessively burdening the business.
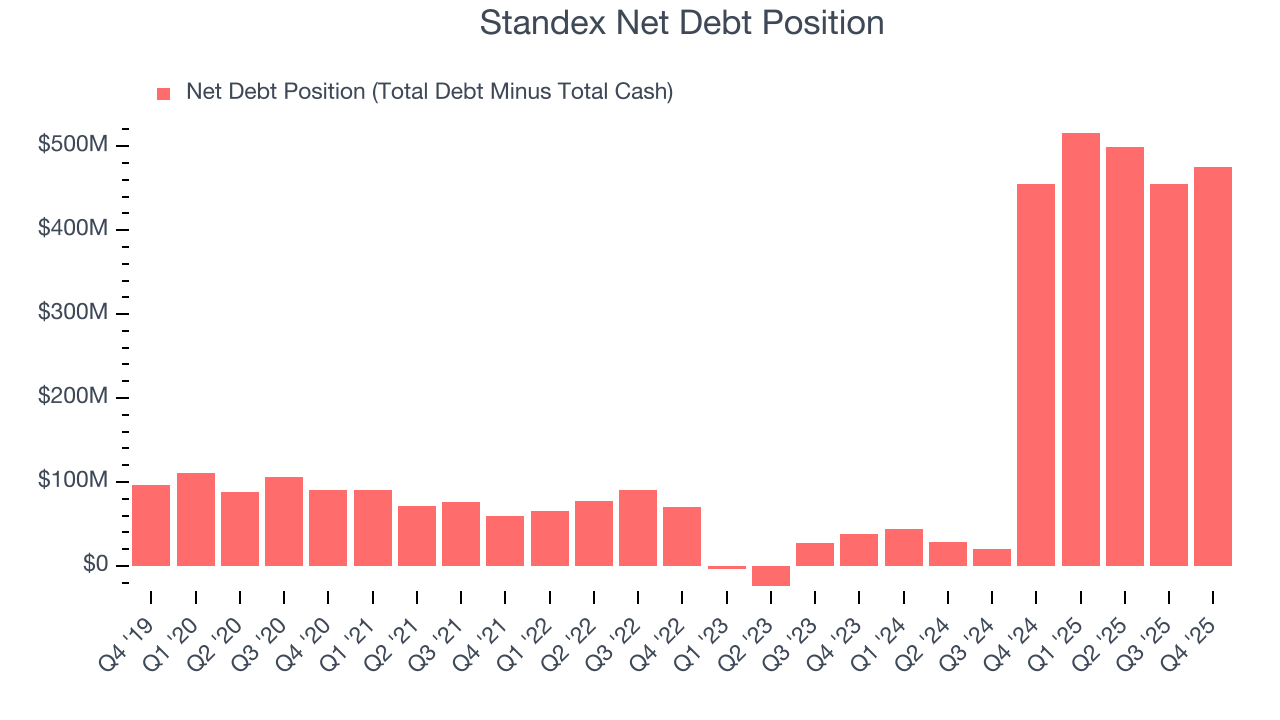
With $191.2 million of EBITDA over the last 12 months, we view Standex’s 2.5× net-debt-to-EBITDA ratio as safe. We also see its $18.38 million of annual interest expenses as appropriate. The company’s profits give it plenty of breathing room, allowing it to continue investing in growth initiatives.
12. Key Takeaways from Standex’s Q4 Results
It was good to see Standex narrowly top analysts’ revenue expectations this quarter. We were also glad its EPS outperformed Wall Street’s estimates. Finally, it was encouraging that both operating and free cash flow margin rose year on year. Overall, this was a solid quarter. The stock remained flat at $246.19 immediately following the results.
13. Is Now The Time To Buy Standex?
Updated: March 13, 2026 at 11:24 PM EDT
The latest quarterly earnings matters, sure, but we actually think longer-term fundamentals and valuation matter more. Investors should consider all these pieces before deciding whether or not to invest in Standex.
There are some bright spots in Standex’s fundamentals, but its business quality ultimately falls short. First off, its revenue growth was decent over the last five years, and analysts believe it can continue growing at these levels. And while Standex’s cash profitability fell over the last five years, its astounding EPS growth over the last five years shows its profits are trickling down to shareholders.
Standex’s P/E ratio based on the next 12 months is 27.8x. Investors with a higher risk tolerance might like the company, but we don’t really see a big opportunity at the moment. We're pretty confident there are superior stocks to buy right now.
Wall Street analysts have a consensus one-year price target of $276.80 on the company (compared to the current share price of $254.15).