TEGNA (TGNA)
We wouldn’t buy TEGNA. Its low returns on capital and plummeting sales suggest it struggles to generate demand and profits, a red flag.― StockStory Analyst Team
1. News


2. Summary
Why We Think TEGNA Will Underperform
Spun out of Gannett in 2015, TEGNA (NYSE:TGNA) is a media company operating a network of television stations and digital platforms, focusing on local news and community content.
- Annual revenue declines of 1.6% over the last five years indicate problems with its market positioning
- Sales were less profitable over the last five years as its earnings per share fell by 6.5% annually, worse than its revenue declines
- Low returns on capital reflect management’s struggle to allocate funds effectively, and its falling returns suggest its earlier profit pools are drying up


TEGNA’s quality isn’t up to par. There are better opportunities in the market.
Why There Are Better Opportunities Than TEGNA


TEGNA’s stock price of $20.30 implies a valuation ratio of 6.6x forward P/E. TEGNA’s valuation may seem like a bargain, but we think there are valid reasons why it’s so cheap.
Cheap stocks can look like a great deal at first glance, but they can be value traps. They often have less earnings power, meaning there is more reliance on a re-rating to generate good returns - an unlikely scenario for low-quality companies.
3. TEGNA (TGNA) Research Report: Q4 CY2025 Update
Broadcasting and digital media company TEGNA (NYSE:TGNA) reported Q4 CY2025 results beating Wall Street’s revenue expectations, but sales fell by 18.9% year on year to $706.1 million. Its non-GAAP profit of $0.50 per share was 10.6% above analysts’ consensus estimates.
TEGNA (TGNA) Q4 CY2025 Highlights:
- Revenue: $706.1 million vs analyst estimates of $699.1 million (18.9% year-on-year decline, 1% beat)
- Adjusted EPS: $0.50 vs analyst estimates of $0.45 (10.6% beat)
- Adjusted EBITDA: $161.1 million vs analyst estimates of $155 million (22.8% margin, 3.9% beat)
- Operating Margin: 16.9%, down from 31.6% in the same quarter last year
- Free Cash Flow Margin: 12.3%, down from 26.8% in the same quarter last year
- Market Capitalization: $3.37 billion
Company Overview
Spun out of Gannett in 2015, TEGNA (NYSE:TGNA) is a media company operating a network of television stations and digital platforms, focusing on local news and community content.
TEGNA's separation from Gannett allowed the company to intensify its focus on developing television and digital services tailored to local markets, addressing the growing demand for community-oriented media content.
The company offers local news broadcasting, digital media services, and marketing solutions. Its diverse content across various platforms caters to niche communities often overlooked by national media networks.
Revenue for TEGNA is primarily generated from advertising, digital marketing services, and content licensing. Its network of local TV stations and digital platforms provides targeted advertising and marketing opportunities for all kinds of advertisers.
4. Consumer Discretionary - Broadcasting
The Consumer Discretionary sector, by definition, is made up of companies selling non-essential goods and services. When economic conditions deteriorate or tastes shift, consumers can easily cut back or eliminate these purchases. For long-term investors with five-year holding periods, this creates a structural challenge: the sector is inherently hit-driven, with low switching costs and fickle customers. As a result, only a handful of companies can reliably grow demand and compound earnings over long periods, which is why our bar is high and High Quality ratings are rare.
Broadcasting companies produce and distribute television and radio content, generating revenue primarily through advertising and, in some cases, retransmission fees (payments cable and satellite operators make to carry local channels). Tailwinds include resilient demand for live sports and event programming, which commands premium ad rates, and political advertising during election cycles. Headwinds, however, are substantial: secular cord-cutting (consumers canceling traditional pay-TV subscriptions) is shrinking linear audiences, digital platforms are capturing an increasing share of advertising budgets, and content production costs continue to rise. Regulatory scrutiny over media consolidation and spectrum ownership further constrains strategic flexibility.
Competitors in the local television broadcasting and digital media sector include Nexstar Media (NASDAQ:NXST), Sinclair (NASDAQ:SBGI), and Gray Television (NYSE:GTN).
5. Revenue Growth
A company’s long-term sales performance can indicate its overall quality. Any business can put up a good quarter or two, but many enduring ones grow for years. Over the last five years, TEGNA’s demand was weak and its revenue declined by 1.6% per year. This wasn’t a great result and suggests it’s a low quality business.
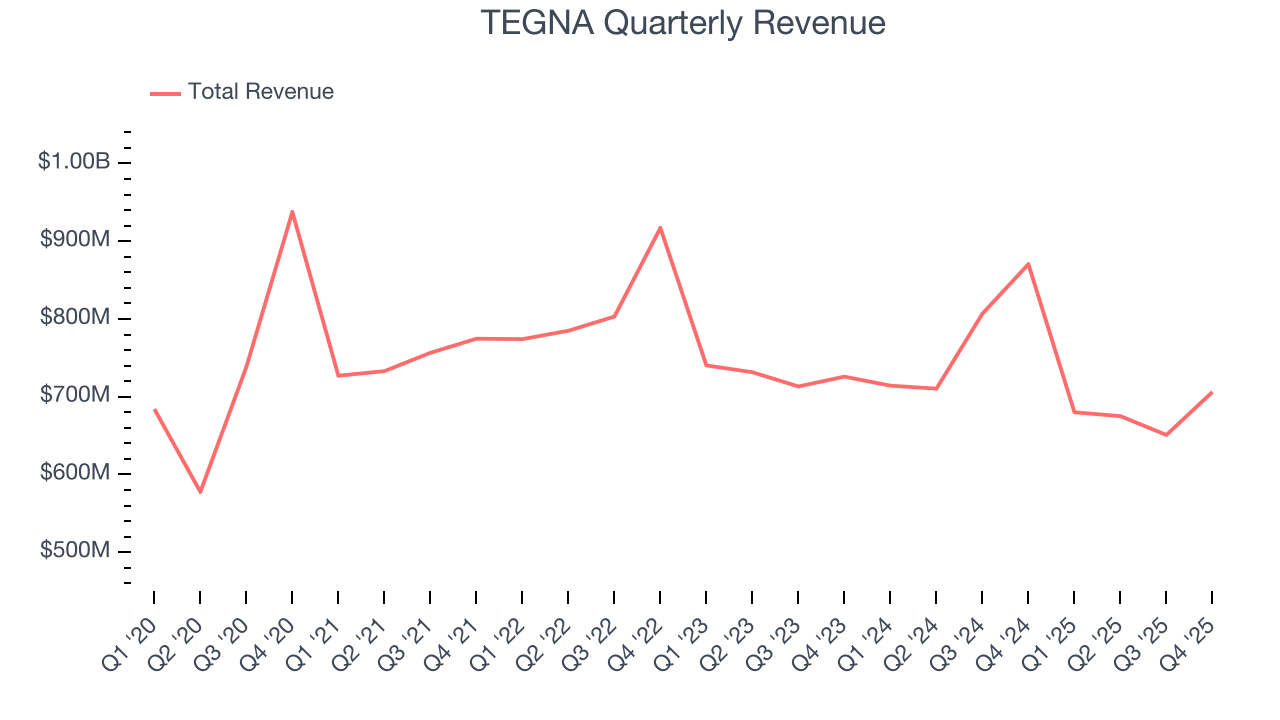
We at StockStory place the most emphasis on long-term growth, but within consumer discretionary, a stretched historical view may miss a company riding a successful new product or trend. TEGNA’s recent performance shows its demand remained suppressed as its revenue has declined by 3.5% annually over the last two years. 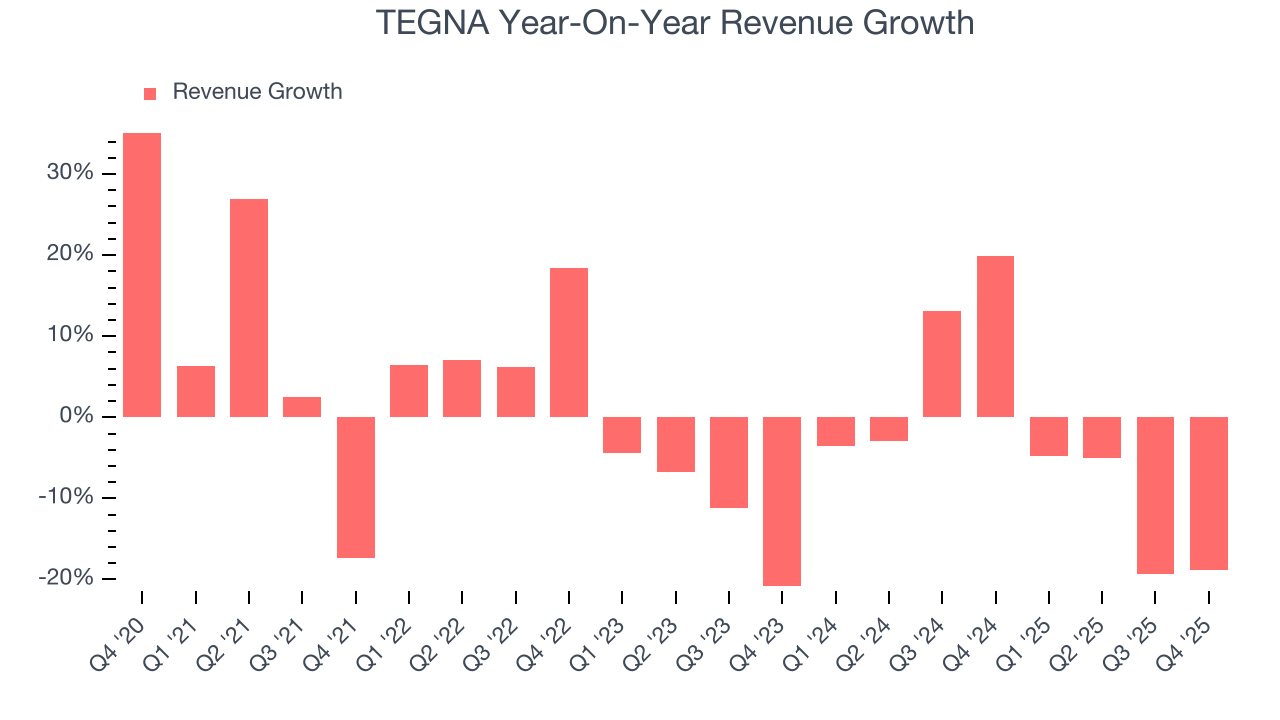
We can better understand the company’s revenue dynamics by analyzing its most important segments, Subscription and Advertising, which are 50.7% and 45.5% of revenue. Over the last two years, TEGNA’s Subscription revenue (access to content) was flat while its Advertising revenue (marketing services) averaged 4.9% year-on-year declines. 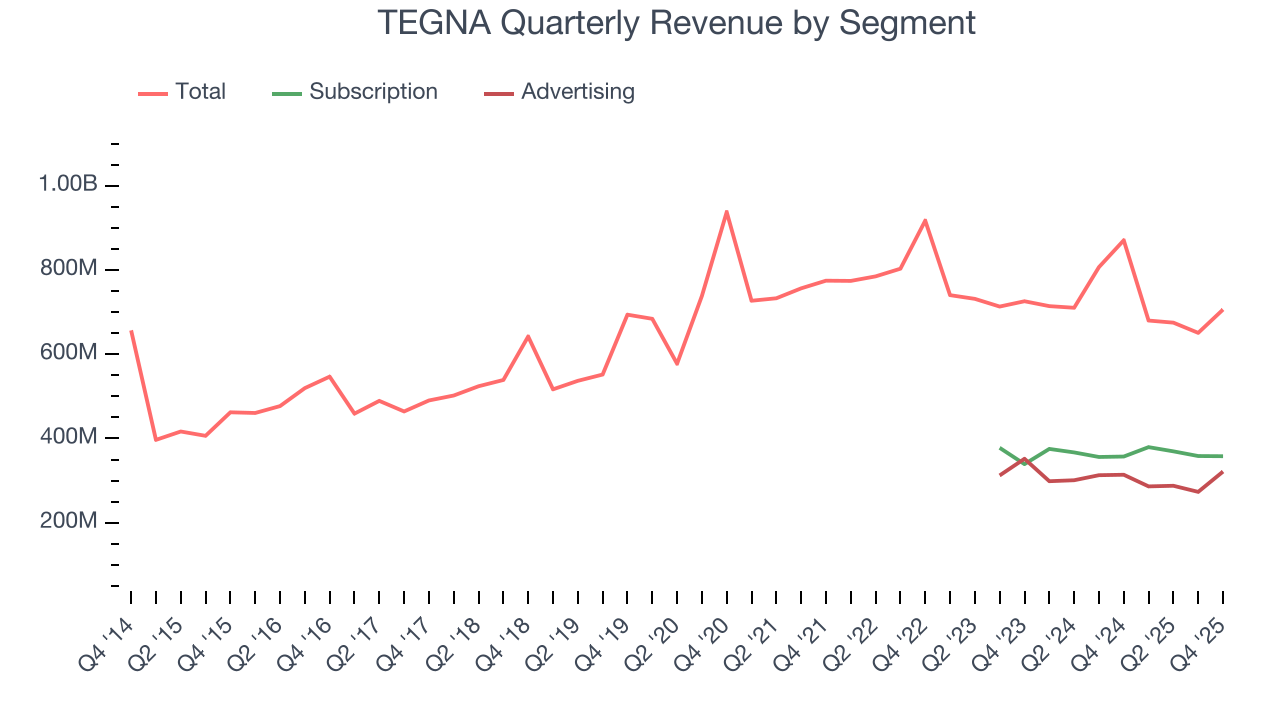
This quarter, TEGNA’s revenue fell by 18.9% year on year to $706.1 million but beat Wall Street’s estimates by 1%.
Looking ahead, sell-side analysts expect revenue to grow 10.9% over the next 12 months. Although this projection indicates its newer products and services will catalyze better top-line performance, it is still below the sector average.
6. Operating Margin
TEGNA’s operating margin has shrunk over the last 12 months and averaged 21.1% over the last two years. The company’s profitability was mediocre for a consumer discretionary business and shows it couldn’t pass its higher operating expenses onto its customers.
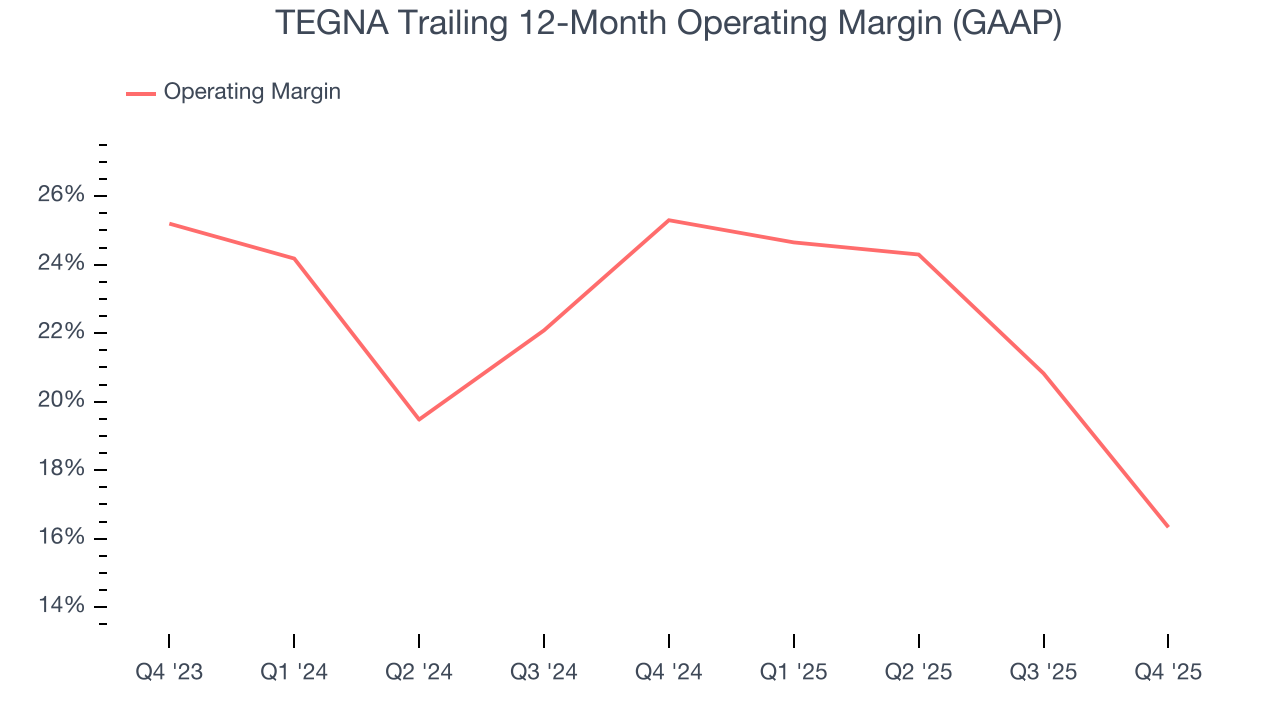
This quarter, TEGNA generated an operating margin profit margin of 16.9%, down 14.7 percentage points year on year. This contraction shows it was less efficient because its expenses increased relative to its revenue.
7. Earnings Per Share
We track the long-term change in earnings per share (EPS) for the same reason as long-term revenue growth. Compared to revenue, however, EPS highlights whether a company’s growth is profitable.
Sadly for TEGNA, its EPS declined by 6.5% annually over the last five years, more than its revenue. This tells us the company struggled because its fixed cost base made it difficult to adjust to shrinking demand.
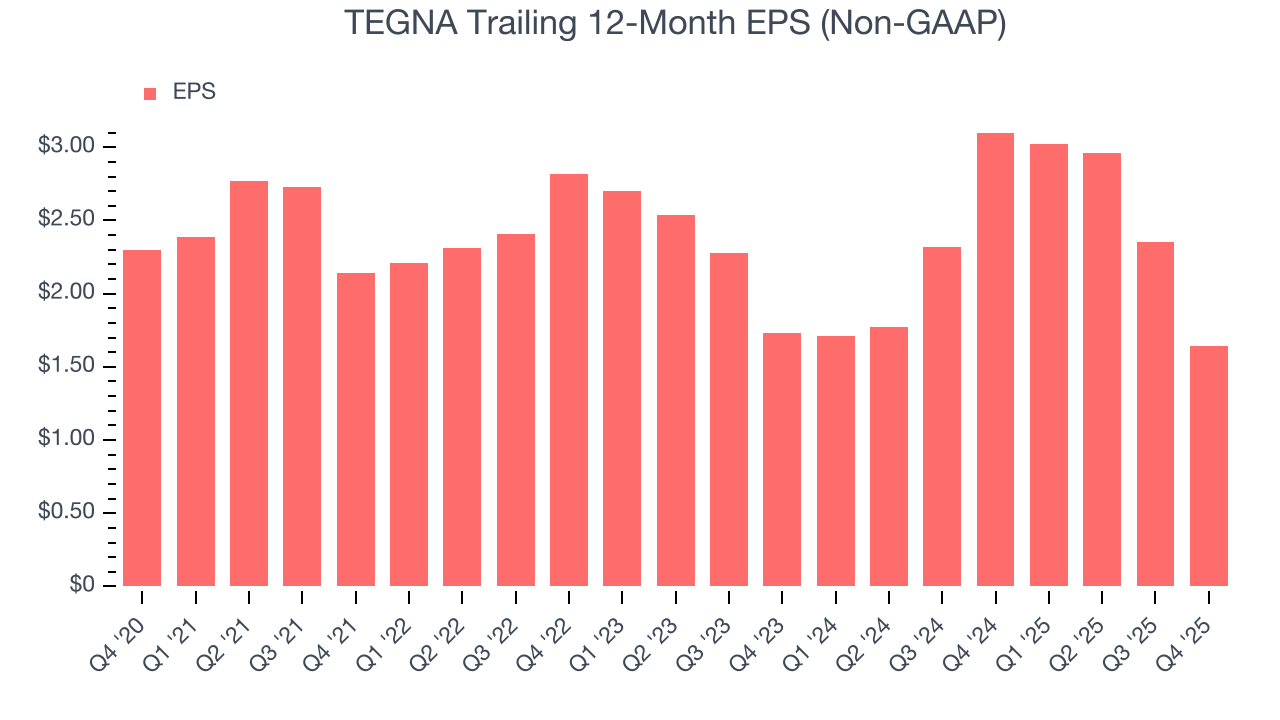
In Q4, TEGNA reported adjusted EPS of $0.50, down from $1.21 in the same quarter last year. Despite falling year on year, this print easily cleared analysts’ estimates. Over the next 12 months, Wall Street expects TEGNA’s full-year EPS of $1.64 to grow 87.6%.
8. Cash Is King
If you’ve followed StockStory for a while, you know we emphasize free cash flow. Why, you ask? We believe that in the end, cash is king, and you can’t use accounting profits to pay the bills.
TEGNA has shown poor cash profitability over the last two years, giving the company limited opportunities to return capital to shareholders. Its free cash flow margin averaged 15.7%, lousy for a consumer discretionary business.
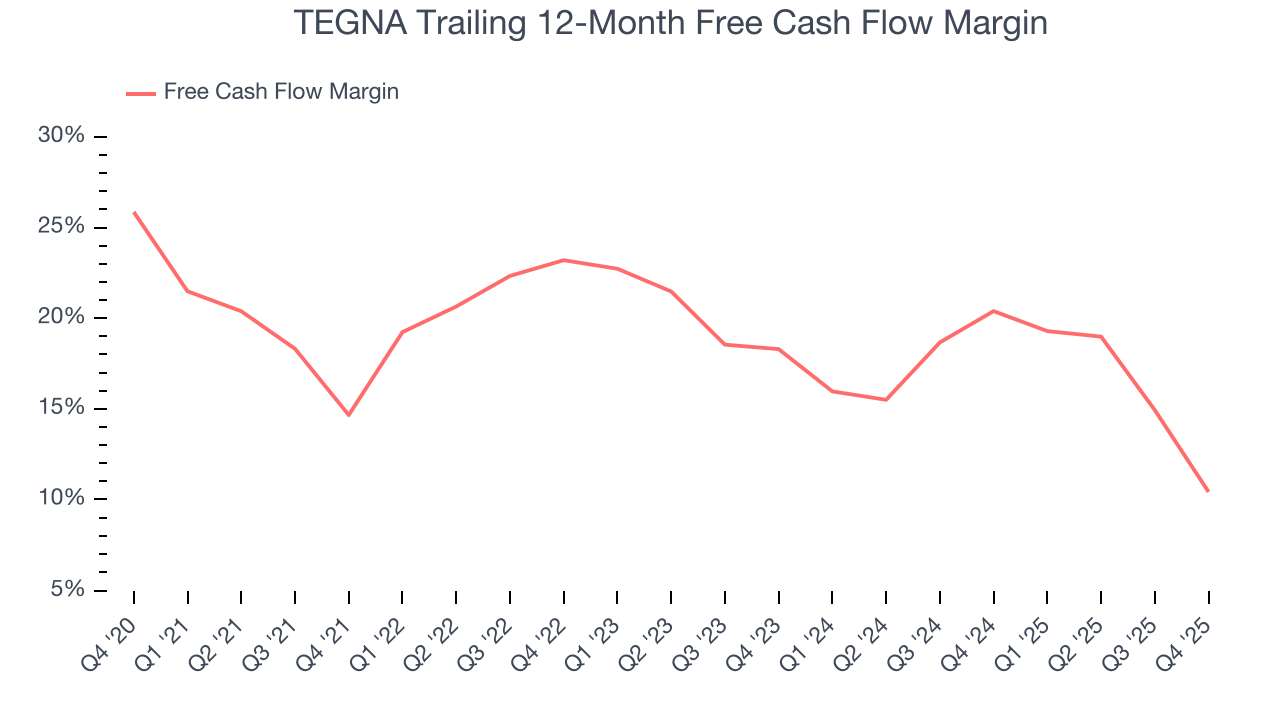
TEGNA’s free cash flow clocked in at $86.75 million in Q4, equivalent to a 12.3% margin. The company’s cash profitability regressed as it was 14.5 percentage points lower than in the same quarter last year, prompting us to pay closer attention. Short-term fluctuations typically aren’t a big deal because investment needs can be seasonal, but we’ll be watching to see if the trend extrapolates into future quarters.
Over the next year, analysts predict TEGNA’s cash conversion will improve. Their consensus estimates imply its free cash flow margin of 10.4% for the last 12 months will increase to 21.1%, giving it more flexibility for investments, share buybacks, and dividends.
9. Return on Invested Capital (ROIC)
EPS and free cash flow tell us whether a company was profitable while growing its revenue. But was it capital-efficient? A company’s ROIC explains this by showing how much operating profit it makes compared to the money it has raised (debt and equity).
TEGNA historically did a mediocre job investing in profitable growth initiatives. Its five-year average ROIC was 11.1%, somewhat low compared to the best consumer discretionary companies that consistently pump out 25%+.
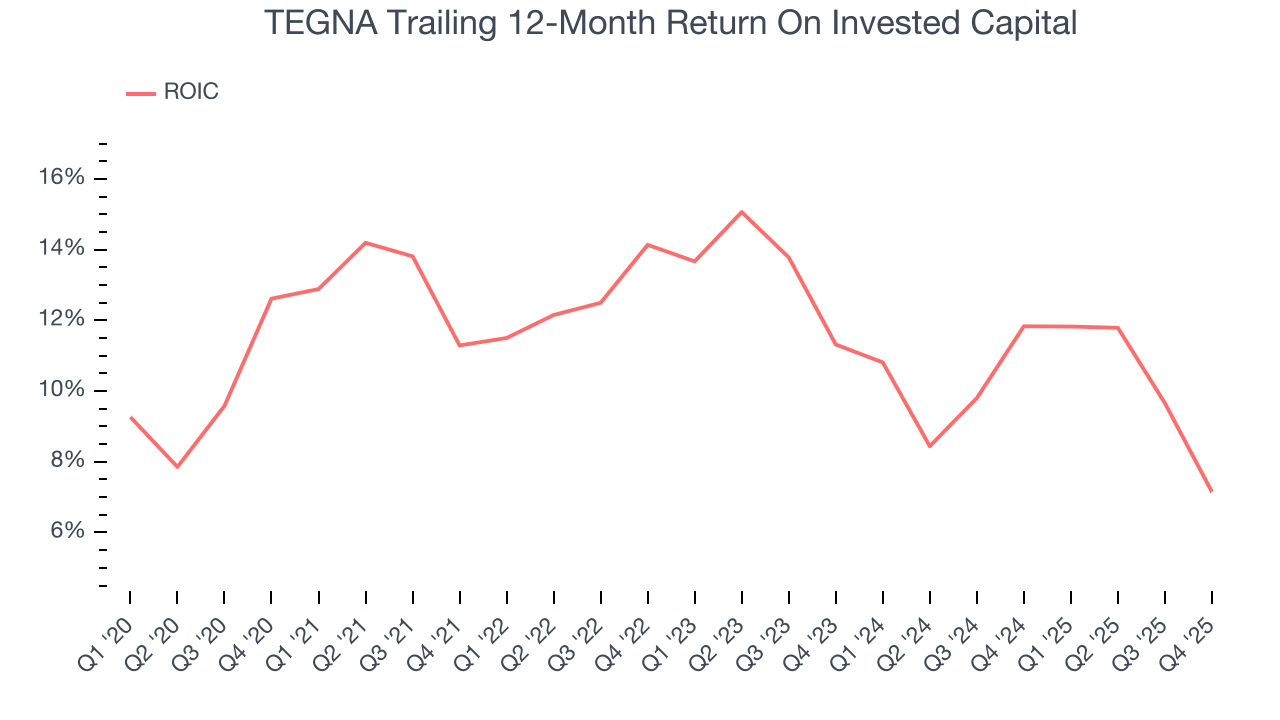
We like to invest in businesses with high returns, but the trend in a company’s ROIC is what often surprises the market and moves the stock price. Over the last few years, TEGNA’s ROIC averaged 3.2 percentage point decreases each year. Paired with its already low returns, these declines suggest its profitable growth opportunities are few and far between.
10. Balance Sheet Assessment
TEGNA reported $291.2 million of cash and $2.53 billion of debt on its balance sheet in the most recent quarter. As investors in high-quality companies, we primarily focus on two things: 1) that a company’s debt level isn’t too high and 2) that its interest payments are not excessively burdening the business.
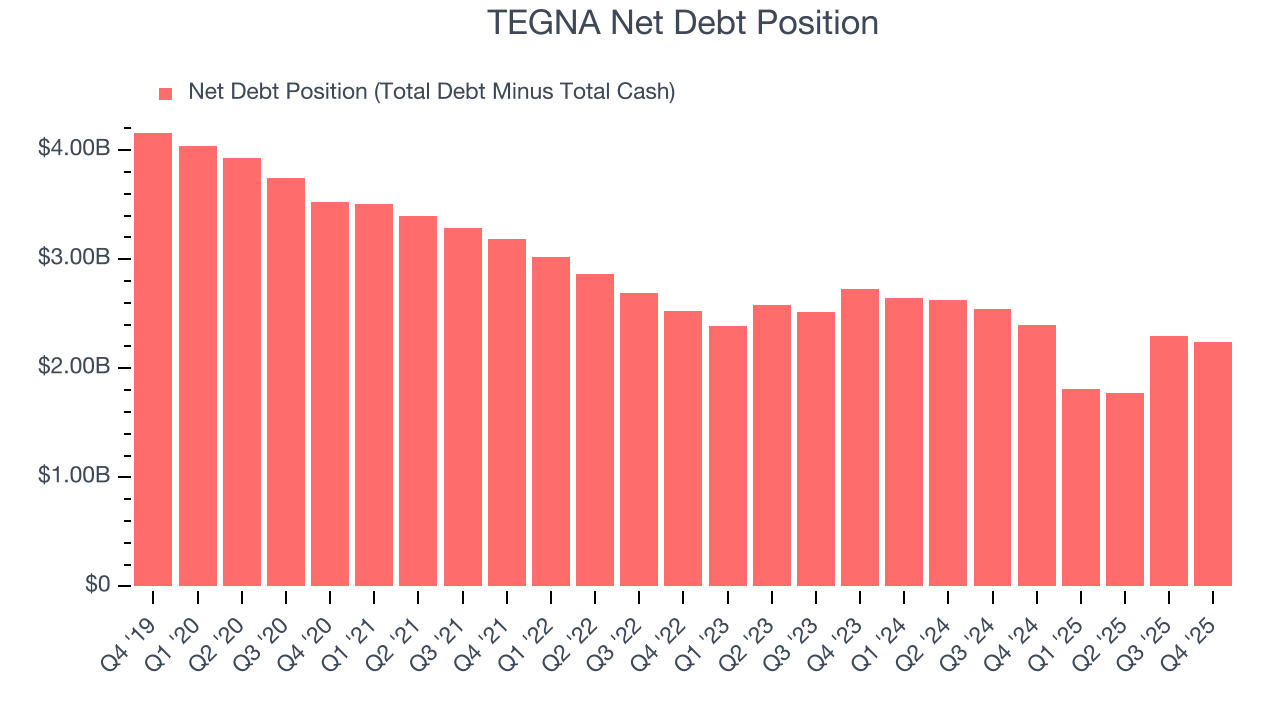
With $578.9 million of EBITDA over the last 12 months, we view TEGNA’s 3.9× net-debt-to-EBITDA ratio as safe. We also see its $67.97 million of annual interest expenses as appropriate. The company’s profits give it plenty of breathing room, allowing it to continue investing in growth initiatives.
11. Key Takeaways from TEGNA’s Q4 Results
It was good to see TEGNA beat analysts’ EPS expectations this quarter. We were also happy its EBITDA outperformed Wall Street’s estimates. Overall, this print had some key positives. The stock remained flat at $20.87 immediately following the results.
12. Is Now The Time To Buy TEGNA?
Updated: March 13, 2026 at 10:59 PM EDT
Before deciding whether to buy TEGNA or pass, we urge investors to consider business quality, valuation, and the latest quarterly results.
We cheer for all companies serving everyday consumers, but in the case of TEGNA, we’ll be cheering from the sidelines. While its projected EPS for the next year implies the company’s fundamentals will improve, the downside is its declining EPS over the last five years makes it a less attractive asset to the public markets. On top of that, its relatively low ROIC suggests management has struggled to find compelling investment opportunities.
TEGNA’s P/E ratio based on the next 12 months is 6.6x. While this valuation is optically cheap, the potential downside is huge given its shaky fundamentals. There are better stocks to buy right now.
Wall Street analysts have a consensus one-year price target of $22 on the company (compared to the current share price of $20.30).