
AMD (AMD)
AMD is an exciting business. Its strong sales growth shows it won market share, and there’s a decent chance its momentum will continue.― StockStory Analyst Team
1. News


2. Summary
Why We Like AMD
Founded in 1969 by a group of former Fairchild semiconductor executives led by Jerry Sanders, Advanced Micro Devices (NASDAQ:AMD) is one of the leading designers of computer processors and graphics chips used in PCs and data centers.
- Annual revenue growth of 28.8% over the past five years was outstanding, reflecting market share gains this cycle
- Demand for the next 12 months is expected to accelerate above its two-year trend as Wall Street forecasts robust revenue growth of 34.8%
- Earnings growth has comfortably beaten the peer group average over the last five years as its EPS has compounded at 26.4% annually


We have an affinity for AMD. The valuation seems fair when considering its quality, so this could be a prudent time to buy some shares.
Why Is Now The Time To Buy AMD?


AMD’s stock price of $199.35 implies a valuation ratio of 29.5x forward P/E. Valuation is lower than most companies in the semiconductor space, and we believe AMD is attractively-priced for its quality.
By definition, where you buy a stock impacts returns. Compared to entry price, business quality matters much more for long-term market outperformance. Buying in at a great price helps, nevertheless.
3. AMD (AMD) Research Report: Q4 CY2025 Update
Computer processor maker AMD (NASDAQ:AMD) beat Wall Street’s revenue expectations in Q4 CY2025, with sales up 34.1% year on year to $10.27 billion. On top of that, next quarter’s revenue guidance ($9.8 billion at the midpoint) was surprisingly good and 4.3% above what analysts were expecting. Its non-GAAP profit of $1.53 per share was 16% above analysts’ consensus estimates.
AMD (AMD) Q4 CY2025 Highlights:
- Revenue: $10.27 billion vs analyst estimates of $9.69 billion (34.1% year-on-year growth, 6% beat)
- Adjusted EPS: $1.53 vs analyst estimates of $1.32 (16% beat)
- Adjusted EBITDA: $3.05 billion vs analyst estimates of $2.39 billion (29.7% margin, 27.4% beat)
- Revenue Guidance for Q1 CY2026 is $9.8 billion at the midpoint, above analyst estimates of $9.40 billion
- Operating Margin: 17.1%, up from 11.4% in the same quarter last year
- Free Cash Flow Margin: 20.3%, up from 14.2% in the same quarter last year
- Inventory Days Outstanding: 163, up from 158 in the previous quarter
- Market Capitalization: $400.9 billion
Company Overview
Founded in 1969 by a group of former Fairchild semiconductor executives led by Jerry Sanders, Advanced Micro Devices (NASDAQ:AMD) is one of the leading designers of computer processors and graphics chips used in PCs and data centers.
AMD began producing computer processors (CPUs) as a second source supplier for Intel as part of Intel’s original processor deal with IBM for the first PCs in the early 1980s.
For the next few decades, AMD would have intermittent success in creating its own chips that could better run Intel's own x86 processor architecture, at times grabbing market share from Intel in the data center with innovative designs like Athlon or Opteron, it was not able to find enduring competitive success.
Faced with bankruptcy after the Great Financial Crisis, AMD spun out its manufacturing arm, Global Foundries, becoming a far less capital intensive designer of semiconductors, allowing for higher profit margins The entrance of Dr. Lisa Su as CEO in 2016 led to a turning point in chip designs, AMD’s Epyc datacenter CPUs and the Ryzen PC CPUs would eventually surpass Intel due to superior higher performance at lower cost.
Where AMD traditionally could only compete with Intel at the low end, in the years since 2016 it has captured share in the most profitable portion of the business — high-end PCs and data center servers, where performance is paramount. Essentially, AMD improved the economics of its business by outsourcing its manufacturing, and competing successfully, but partnerships with chip manufacturers like Taiwan Semiconductor Manufacturing Company will be important for enduring success.
AMD’s primary competitors are Intel (NASDAQ:INTC), Nvidia (NASDAQ:NVDA), and Qualcomm (NASDAQ:QCOM).
4. Processors and Graphics Chips
Chips need to keep getting smaller in order to advance on Moore’s law, and that is proving increasingly more complicated and expensive to achieve with time. That has caused most digital chip makers to become “fabless” designers, rather than manufacturers, instead relying on contracted foundries like TSMC to manufacture their designs. This has benefitted the digital chip makers’ free cash flow margins, as exiting the manufacturing business has removed large cash expenses from their business models.
5. Revenue Growth
Reviewing a company’s long-term sales performance reveals insights into its quality. Even a bad business can shine for one or two quarters, but a top-tier one grows for years. Luckily, AMD’s sales grew at an incredible 28.8% compounded annual growth rate over the last five years. Its growth surpassed the average semiconductor company and shows its offerings resonate with customers, a great starting point for our analysis. Semiconductors are a cyclical industry, and long-term investors should be prepared for periods of high growth followed by periods of revenue contractions (which can sometimes offer opportune times to buy).
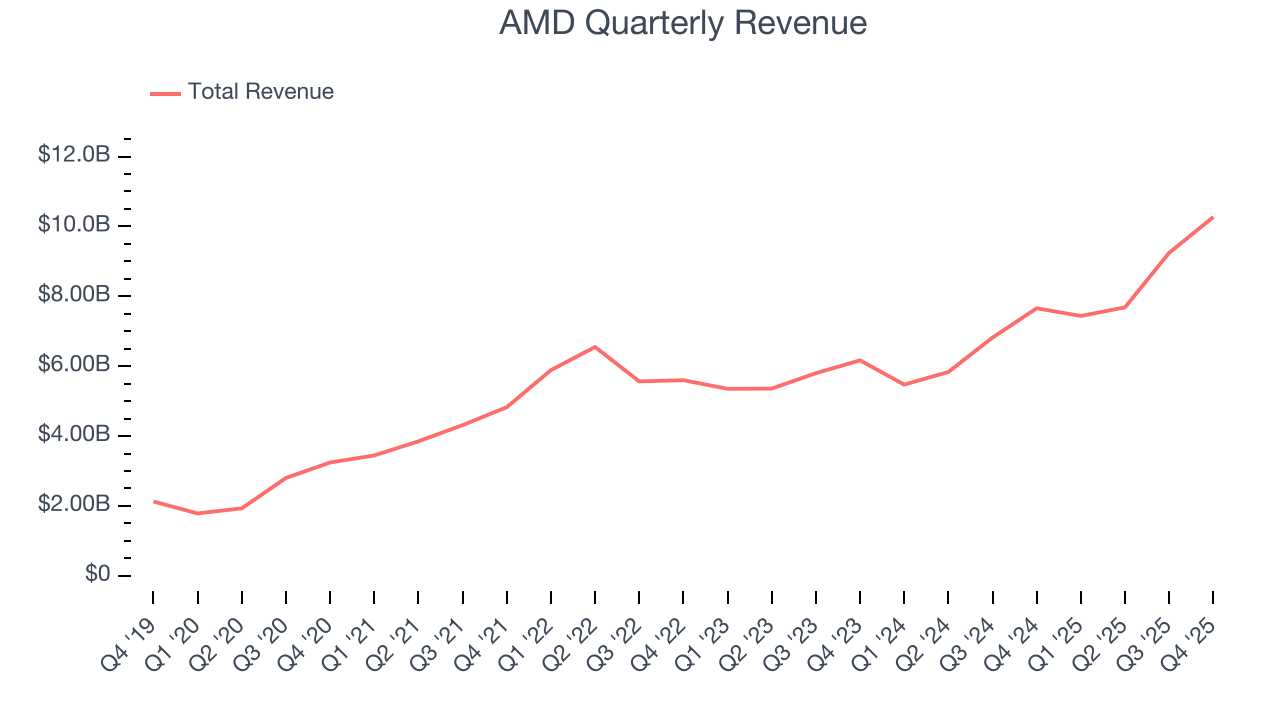
We at StockStory place the most emphasis on long-term growth, but within semiconductors, a half-decade historical view may miss new demand cycles or industry trends like AI. AMD’s annualized revenue growth of 23.6% over the last two years is below its five-year trend, but we still think the results suggest healthy demand. 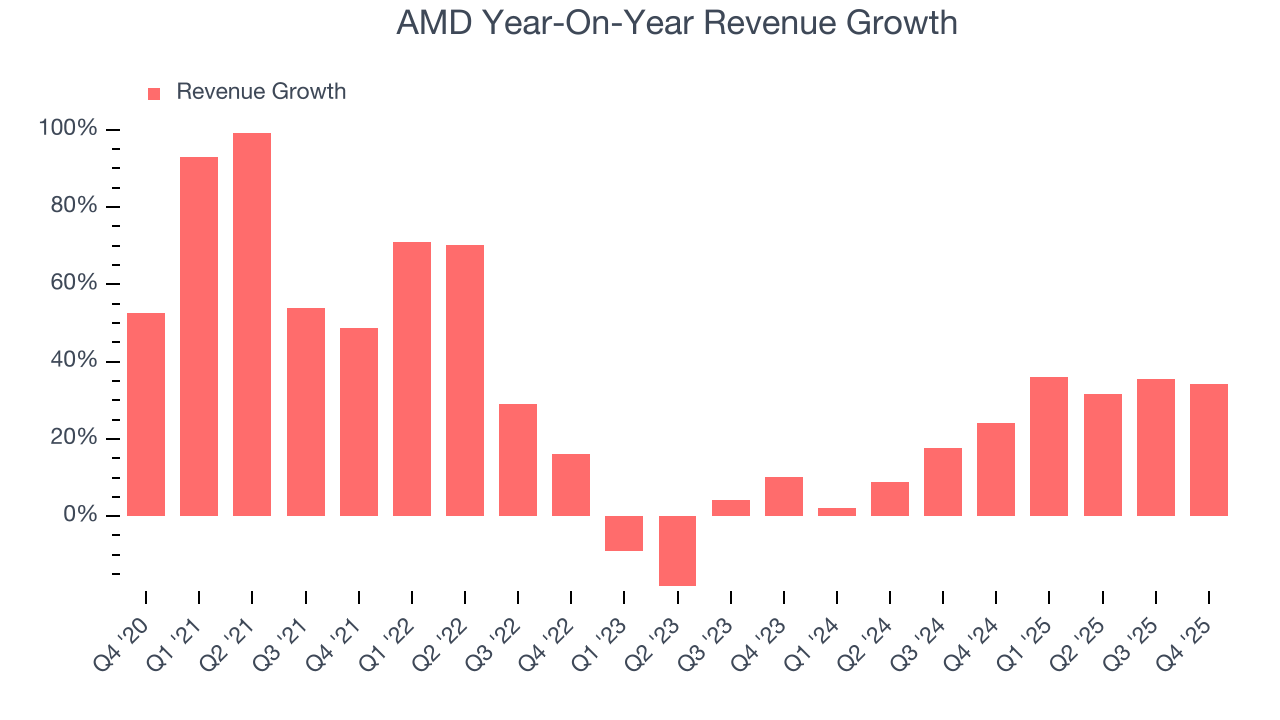
This quarter, AMD reported wonderful year-on-year revenue growth of 34.1%, and its $10.27 billion of revenue exceeded Wall Street’s estimates by 6%. Beyond the beat, this marks 10 straight quarters of growth, showing that the current upcycle has had a good run - a typical upcycle usually lasts 8-10 quarters. Company management is currently guiding for a 31.8% year-on-year increase in sales next quarter.
Looking further ahead, sell-side analysts expect revenue to grow 31.4% over the next 12 months, an improvement versus the last two years. This projection is eye-popping for a company of its scale and indicates its newer products and services will spur better top-line performance.
6. Product Demand & Outstanding Inventory
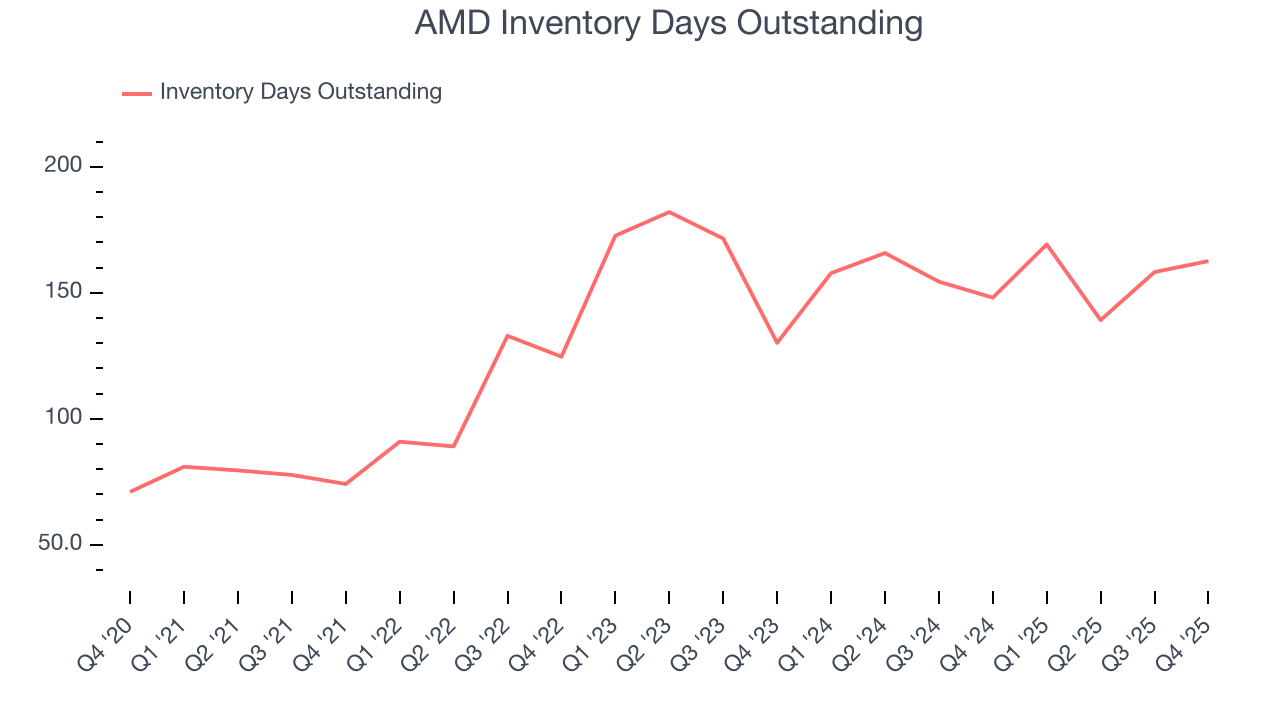
Days Inventory Outstanding (DIO) is an important metric for chipmakers, as it reflects a business’ capital intensity and the cyclical nature of semiconductor supply and demand. In a tight supply environment, inventories tend to be stable, allowing chipmakers to exert pricing power. Steadily increasing DIO can be a warning sign that demand is weak, and if inventories continue to rise, the company may have to downsize production.
This quarter, AMD’s DIO came in at 163, which is 30 days above its five-year average, suggesting that the company’s inventory has grown to higher levels than we’ve seen in the past.
7. Gross Margin & Pricing Power
In the semiconductor industry, a company’s gross profit margin is a critical metric to track because it sheds light on its pricing power, complexity of products, and ability to procure raw materials, equipment, and labor.
AMD’s unit economics are reasonably high for a semiconductor business, pointing to a lack of meaningful pricing pressure and its products’ solid competitive positioning. As you can see below, it averaged an impressive 52.7% gross margin over the last two years. That means for every $100 in revenue, roughly $52.72 was left to spend on selling, marketing, R&D, and general administrative overhead. 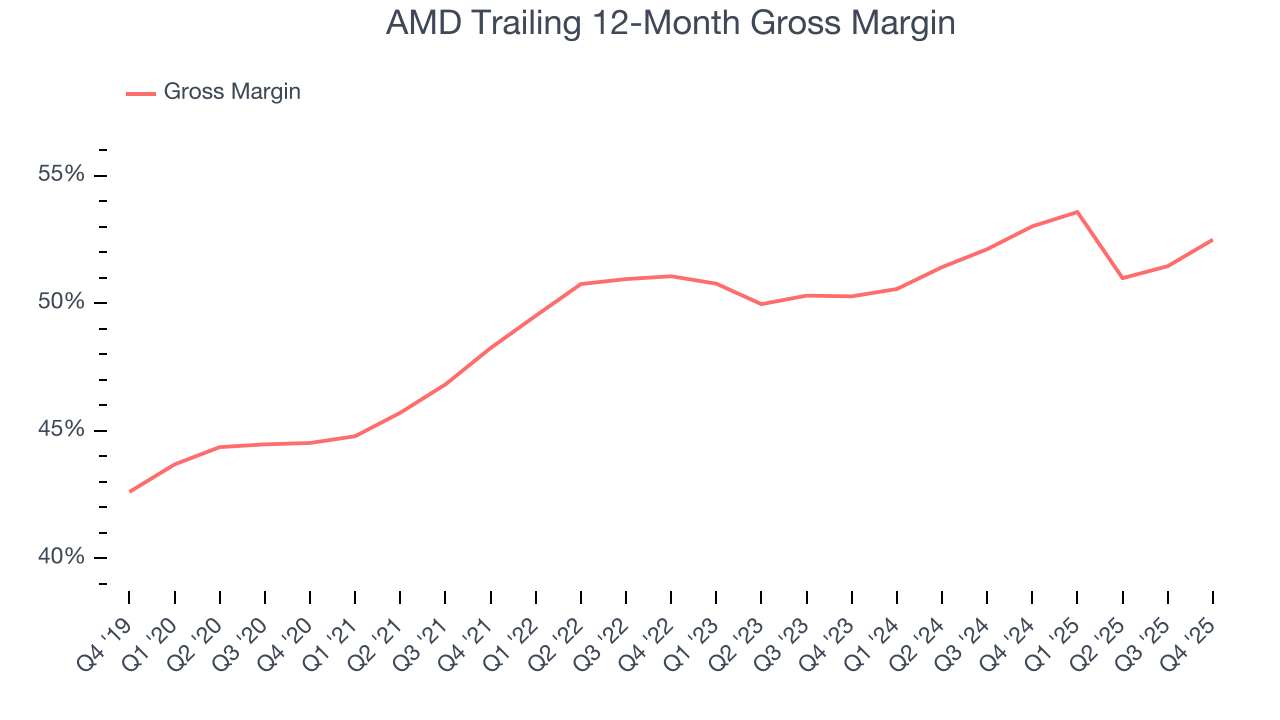
AMD produced a 56.8% gross profit margin in Q4, marking a 2.9 percentage point increase from 54% in the same quarter last year. On a wider time horizon, the company’s full-year margin has remained steady over the past four quarters, suggesting its input costs (such as raw materials and manufacturing expenses) have been stable and it isn’t under pressure to lower prices.
8. Operating Margin
Operating margin is a key measure of profitability. Think of it as net income - the bottom line - excluding the impact of taxes and interest on debt, which are less connected to business fundamentals.
AMD was profitable over the last two years but held back by its large cost base. Its average operating margin of 9.3% was weak for a semiconductor business. This result is surprising given its high gross margin as a starting point.
Looking at the trend in its profitability, AMD’s operating margin decreased by 11.5 percentage points over the last five years. This raises questions about the company’s expense base because its revenue growth should have given it leverage on its fixed costs, resulting in better economies of scale and profitability. AMD’s performance was poor no matter how you look at it - it shows that costs were rising and it couldn’t pass them onto its customers.
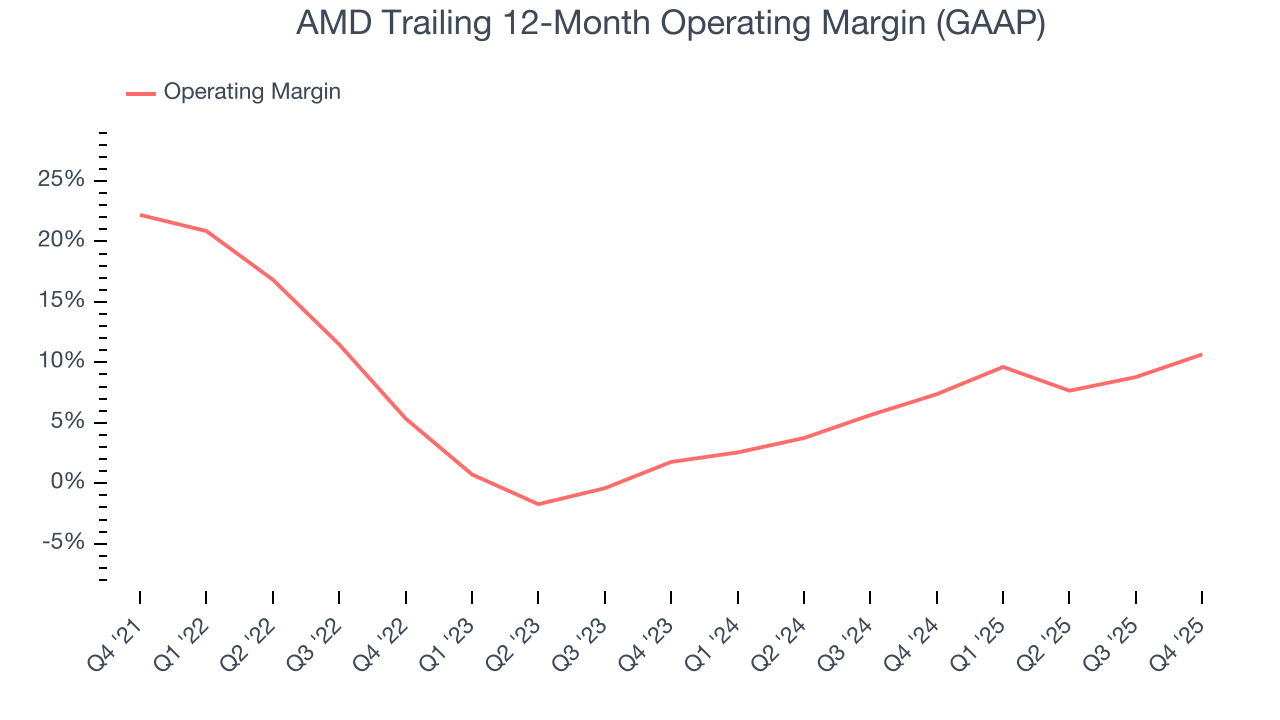
In Q4, AMD generated an operating margin profit margin of 17.1%, up 5.7 percentage points year on year. The increase was solid, and because its operating margin rose more than its gross margin, we can infer it was more efficient with expenses such as marketing, R&D, and administrative overhead.
9. Earnings Per Share
Revenue trends explain a company’s historical growth, but the long-term change in earnings per share (EPS) points to the profitability of that growth – for example, a company could inflate its sales through excessive spending on advertising and promotions.
AMD’s EPS grew at a spectacular 26.4% compounded annual growth rate over the last five years. However, this performance was lower than its 28.8% annualized revenue growth, telling us the company became less profitable on a per-share basis as it expanded.
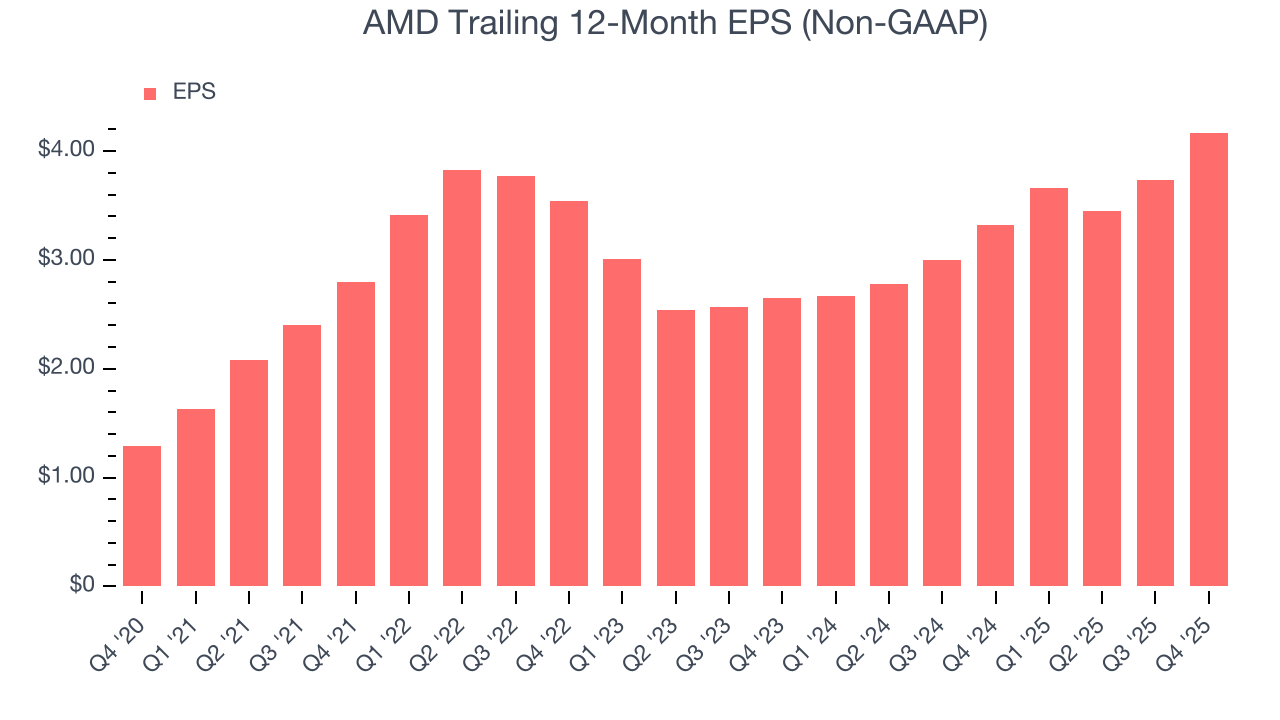
Diving into the nuances of AMD’s earnings can give us a better understanding of its performance. As we mentioned earlier, AMD’s operating margin expanded this quarter but declined by 11.5 percentage points over the last five years. Its share count also grew by 34.5%, meaning the company not only became less efficient with its operating expenses but also diluted its shareholders. 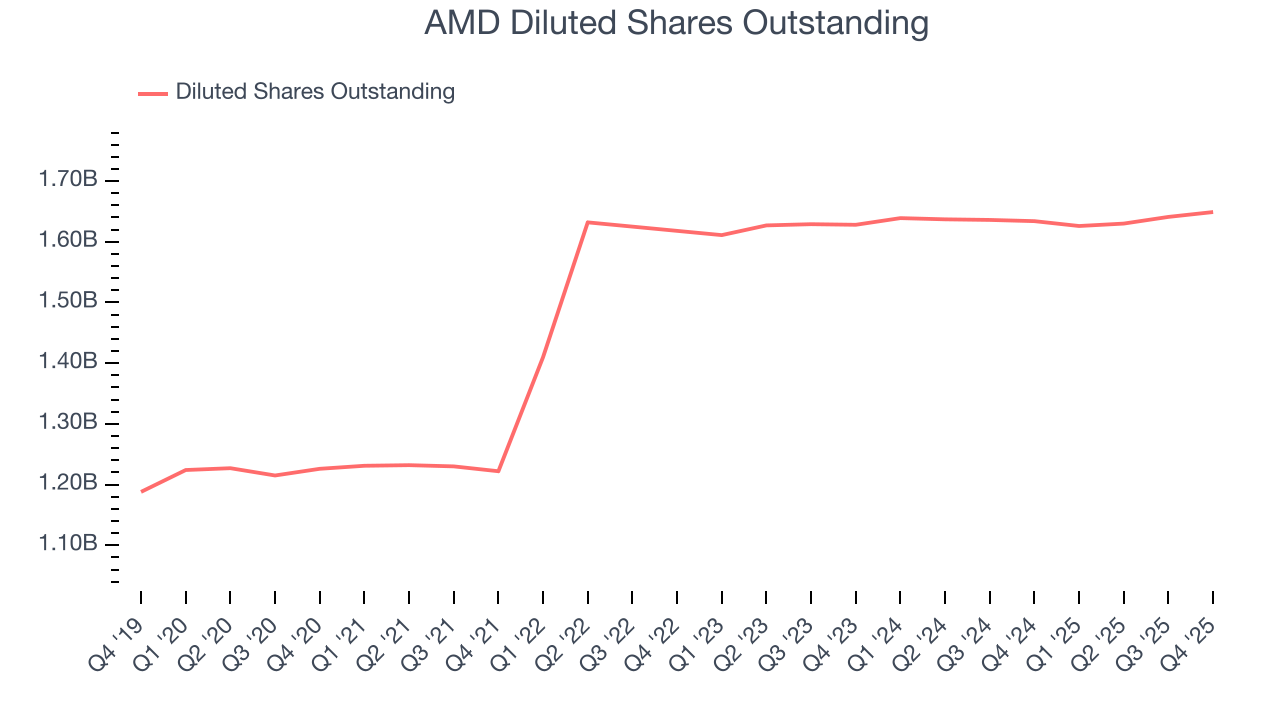
In Q4, AMD reported adjusted EPS of $1.53, up from $1.09 in the same quarter last year. This print easily cleared analysts’ estimates, and shareholders should be content with the results. Over the next 12 months, Wall Street expects AMD’s full-year EPS of $4.17 to grow 57.1%.
10. Cash Is King
If you’ve followed StockStory for a while, you know we emphasize free cash flow. Why, you ask? We believe that in the end, cash is king, and you can’t use accounting profits to pay the bills.
AMD has shown mediocre cash profitability over the last two years, giving the company limited opportunities to return capital to shareholders. Its free cash flow margin averaged 13.7%, subpar for a semiconductor business.
Taking a step back, we can see that AMD’s margin dropped by 2.6 percentage points over the last five years. It may have ticked higher more recently, but shareholders are likely hoping for its margin to at least revert to its historical level. If the longer-term trend returns, it could signal it’s in the middle of an investment cycle.
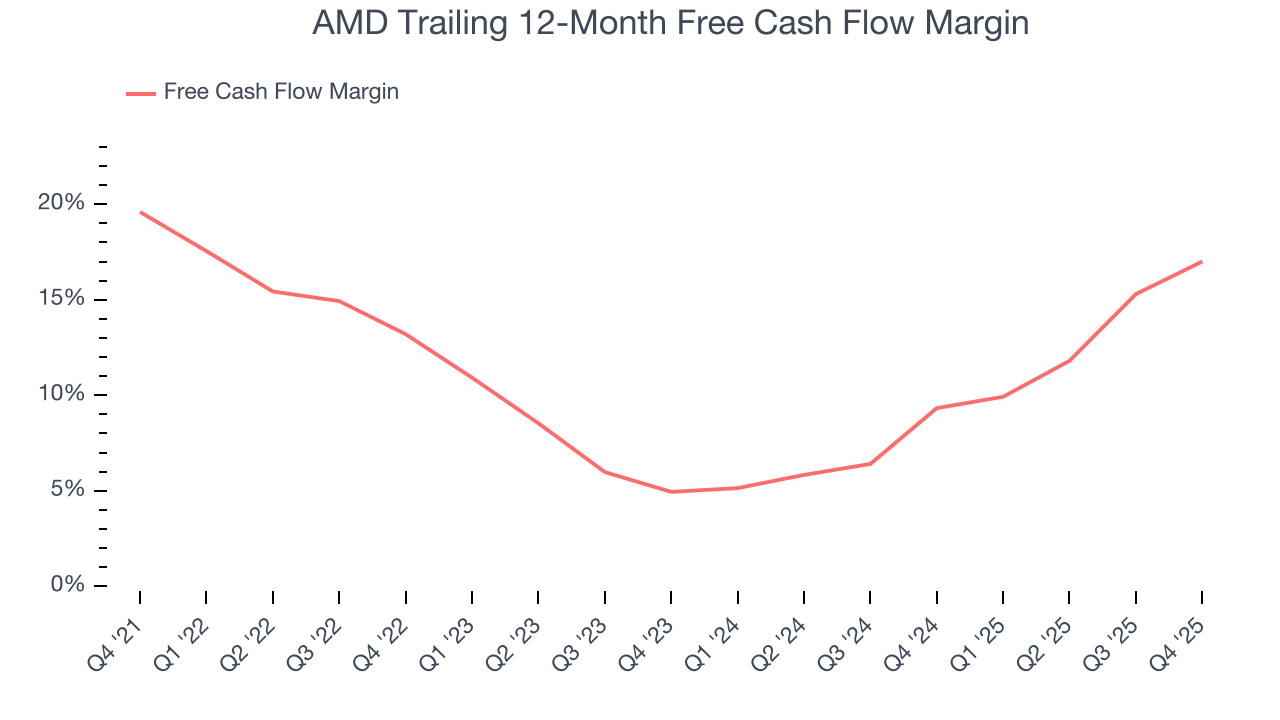
AMD’s free cash flow clocked in at $2.08 billion in Q4, equivalent to a 20.3% margin. This result was good as its margin was 6 percentage points higher than in the same quarter last year. Its cash profitability was also above its two-year level, and we hope the company can build on this trend.
11. Return on Invested Capital (ROIC)
EPS and free cash flow tell us whether a company was profitable while growing its revenue. But was it capital-efficient? A company’s ROIC explains this by showing how much operating profit it makes compared to the money it has raised (debt and equity).
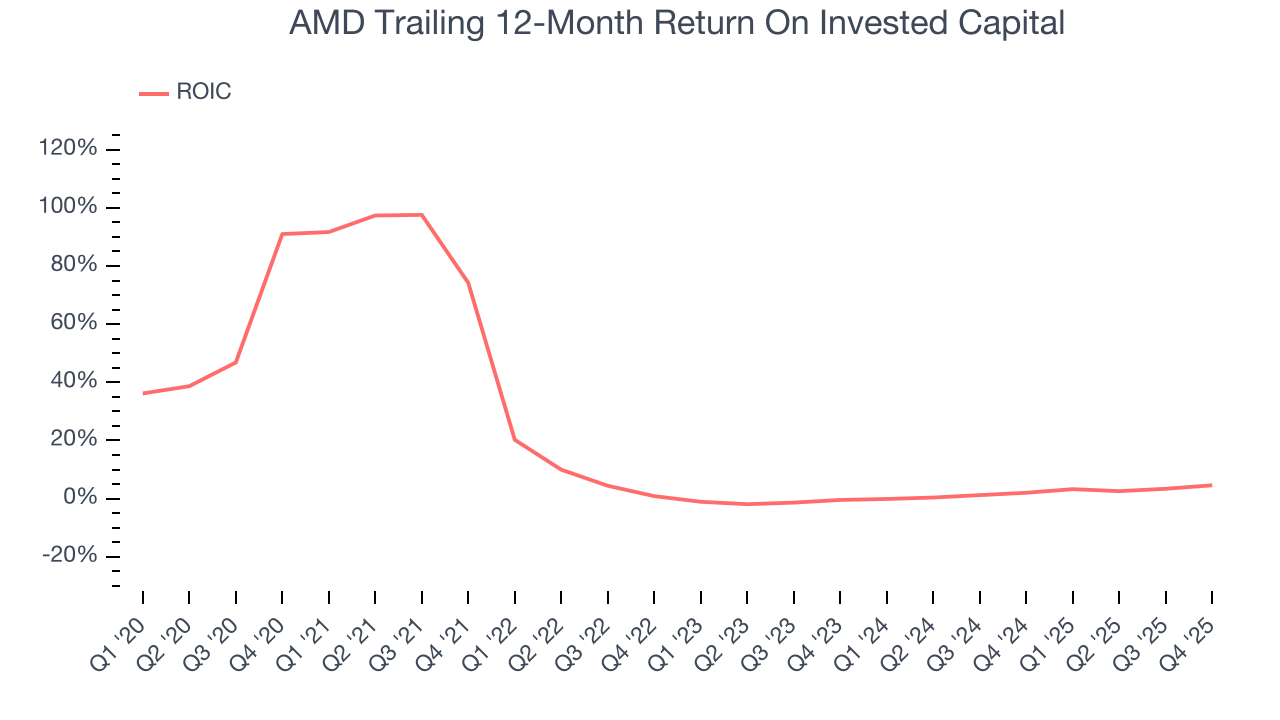
AMD’s management team makes decent investment decisions and generates value for shareholders. Its five-year average ROIC was 16.2%, slightly better than typical semiconductor business.
12. Balance Sheet Assessment
Big corporations like AMD are attractive to many investors in times of instability thanks to their fortress balance sheets that buffer pockets of soft demand.
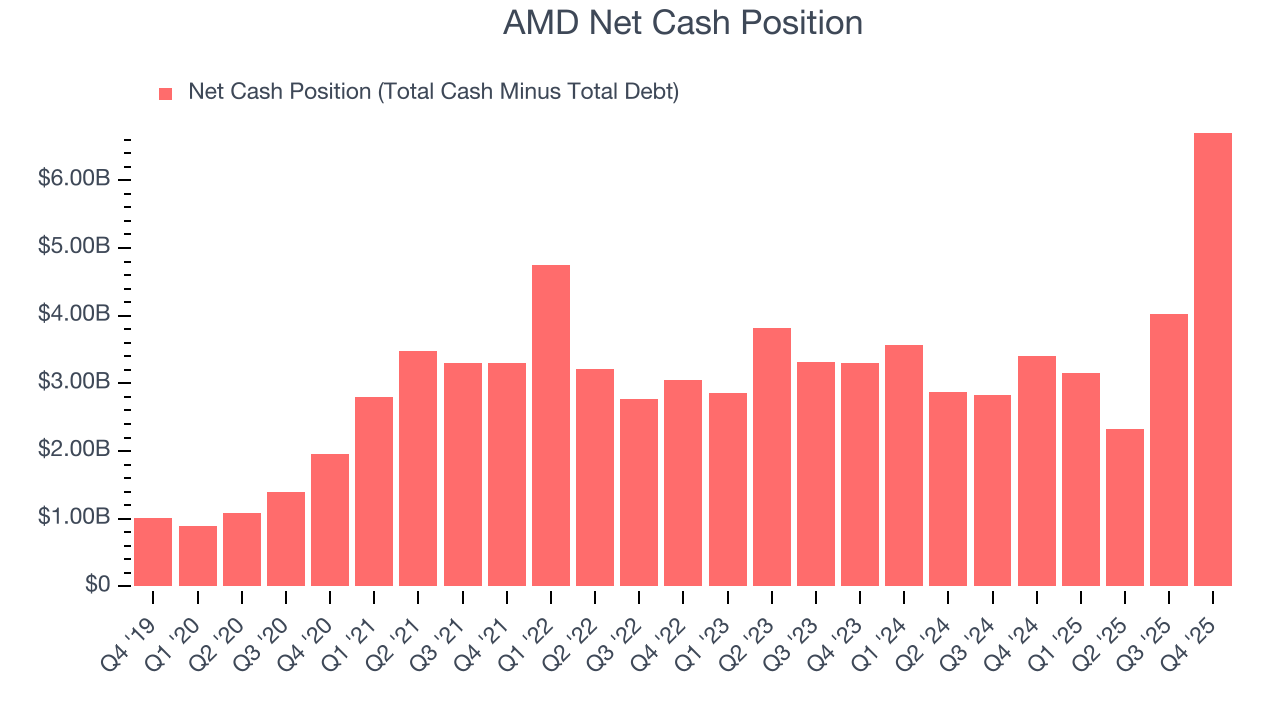
AMD is a profitable, well-capitalized company with $10.55 billion of cash and $3.85 billion of debt on its balance sheet. This $6.71 billion net cash position gives it the freedom to borrow money, return capital to shareholders, or invest in growth initiatives. Leverage is not an issue here.
13. Key Takeaways from AMD’s Q4 Results
It was good to see AMD beat analysts’ EPS expectations this quarter. We were also excited its adjusted operating income outperformed Wall Street’s estimates by a wide margin. On the other hand, its inventory levels increased. Zooming out, we think this was a solid print. Investors were likely hoping for more, and shares traded down 4.1% to $232.95 immediately after reporting.
14. Is Now The Time To Buy AMD?
Updated: March 19, 2026 at 10:24 PM EDT
Before making an investment decision, investors should account for AMD’s business fundamentals and valuation in addition to what happened in the latest quarter.
There are several reasons why we think AMD is a great business. To begin with, its revenue growth was exceptional over the last five years, and its growth over the next 12 months is expected to accelerate. On top of that, its spectacular EPS growth over the last five years shows its profits are trickling down to shareholders, and its gross margins indicate it has pricing power.
AMD’s P/E ratio based on the next 12 months is 30x. Looking across the spectrum of semiconductor companies today, AMD’s fundamentals shine bright. We like the stock at this price.
Wall Street analysts have a consensus one-year price target of $289.61 on the company (compared to the current share price of $204.80), implying they see 41.4% upside in buying AMD in the short term.