Cracker Barrel (CBRL)
Cracker Barrel keeps us up at night. Its weak sales growth and declining returns on capital show its demand and profits are shrinking.― StockStory Analyst Team
1. News
2. Summary
Why We Think Cracker Barrel Will Underperform
Known for its country-themed food and merchandise, Cracker Barrel (NASDAQ:CBRL) is a beloved American restaurant and retail chain that celebrates the warmth and charm of Southern hospitality.
- Projected sales decline of 3.2% for the next 12 months points to a tough demand environment ahead
- Performance over the past six years shows its incremental sales were much less profitable, as its earnings per share fell by 16.5% annually
- Muted 2.1% annual revenue growth over the last six years shows its demand lagged behind its restaurant peers


Cracker Barrel doesn’t fulfill our quality requirements. There are more profitable opportunities elsewhere.
Why There Are Better Opportunities Than Cracker Barrel


Cracker Barrel’s stock price of $26.75 implies a valuation ratio of 35.2x forward P/E. This multiple is higher than most restaurant companies, and we think it’s quite expensive for the weaker revenue growth you get.
There are stocks out there featuring similar valuation multiples with better fundamentals. We prefer to invest in those.
3. Cracker Barrel (CBRL) Research Report: Q3 CY2025 Update
Restaurant company Cracker Barrel (NASDAQ:CBRL) met Wall Streets revenue expectations in Q3 CY2025, but sales fell by 5.7% year on year to $797.2 million. On the other hand, the company’s full-year revenue guidance of $3.25 billion at the midpoint came in 3.7% below analysts’ estimates. Its non-GAAP loss of $0.74 per share was 1.8% below analysts’ consensus estimates.
Cracker Barrel (CBRL) Q3 CY2025 Highlights:
- Revenue: $797.2 million vs analyst estimates of $798.9 million (5.7% year-on-year decline, in line)
- Adjusted EPS: -$0.74 vs analyst expectations of -$0.73 (1.8% miss)
- Adjusted EBITDA: $7.19 million vs analyst estimates of $19.81 million (0.9% margin, 63.7% miss)
- The company dropped its revenue guidance for the full year to $3.25 billion at the midpoint from $3.4 billion, a 4.4% decrease
- EBITDA guidance for the full year is $90 million at the midpoint, below analyst estimates of $171.5 million
- Operating Margin: -4.1%, down from 0.8% in the same quarter last year
- Free Cash Flow was -$87.6 million compared to -$43.28 million in the same quarter last year
- Locations: 710 at quarter end, down from 727 in the same quarter last year
- Same-Store Sales fell 4.7% year on year (2.9% in the same quarter last year)
- Market Capitalization: $592.8 million
Company Overview
Known for its country-themed food and merchandise, Cracker Barrel (NASDAQ:CBRL) is a beloved American restaurant and retail chain that celebrates the warmth and charm of Southern hospitality.
The company was founded in 1969 when founder Dan Evins envisioned creating a welcoming stop along the highway to provide travelers with a taste of home-cooked Southern meals and a place to rest and relax. This idea led to the first Cracker Barrel Old Country Store in Lebanon, Tennessee.
Today, Cracker Barrel is a nationwide brand and has become a cherished destination for travelers and locals alike. Its extensive menu features classic favorites such as chicken and dumplings, meatloaf, and country-fried steak, served with delectable sides including macaroni and cheese, green beans, and cornbread.
The Cracker Barrel experience, however, is about more than just delicious food; it's a journey back in time. Each restaurant evokes the nostalgic charm of an old country store, complete with wooden rocking chairs on the front porch, vintage memorabilia, and unique decorations that tell a story of American heritage.
To further immerse themselves, guests can also explore the fan-favorite Cracker Barrel gift shop after their meals, offering anything from country-inspired clothing and home décor to old-school toys and classic candies. Just like its meals, Cracker Barrel's retail offerings are carefully curated to reflect the best of country living.
4. Sit-Down Dining
Sit-down restaurants offer a complete dining experience with table service. These establishments span various cuisines and are renowned for their warm hospitality and welcoming ambiance, making them perfect for family gatherings, special occasions, or simply unwinding. Their extensive menus range from appetizers to indulgent desserts and wines and cocktails. This space is extremely fragmented and competition includes everything from publicly-traded companies owning multiple chains to single-location mom-and-pop restaurants.
Full-service restaurant competitors include Bloomin’ Brands (NASDAQ:BLMN), Darden Restaurants (NYSE:DRI), Dine Brands (NYSE:DIN), and Texas Roadhouse (NASDAQ:TXRH).
5. Revenue Growth
A company’s long-term performance is an indicator of its overall quality. Any business can put up a good quarter or two, but the best consistently grow over the long haul.
With $3.44 billion in revenue over the past 12 months, Cracker Barrel is one of the larger restaurant chains in the industry and benefits from a well-known brand that influences consumer purchasing decisions. However, its scale is a double-edged sword because there are only a finite of number places to build restaurants, making it harder to find incremental growth. To accelerate system-wide sales, Cracker Barrel likely needs to optimize its pricing or lean into new chains and international expansion.
As you can see below, Cracker Barrel grew its sales at a weak 1.8% compounded annual growth rate over the last six years (we compare to 2019 to normalize for COVID-19 impacts) as its restaurant footprint remained unchanged and it barely increased sales at existing, established dining locations.
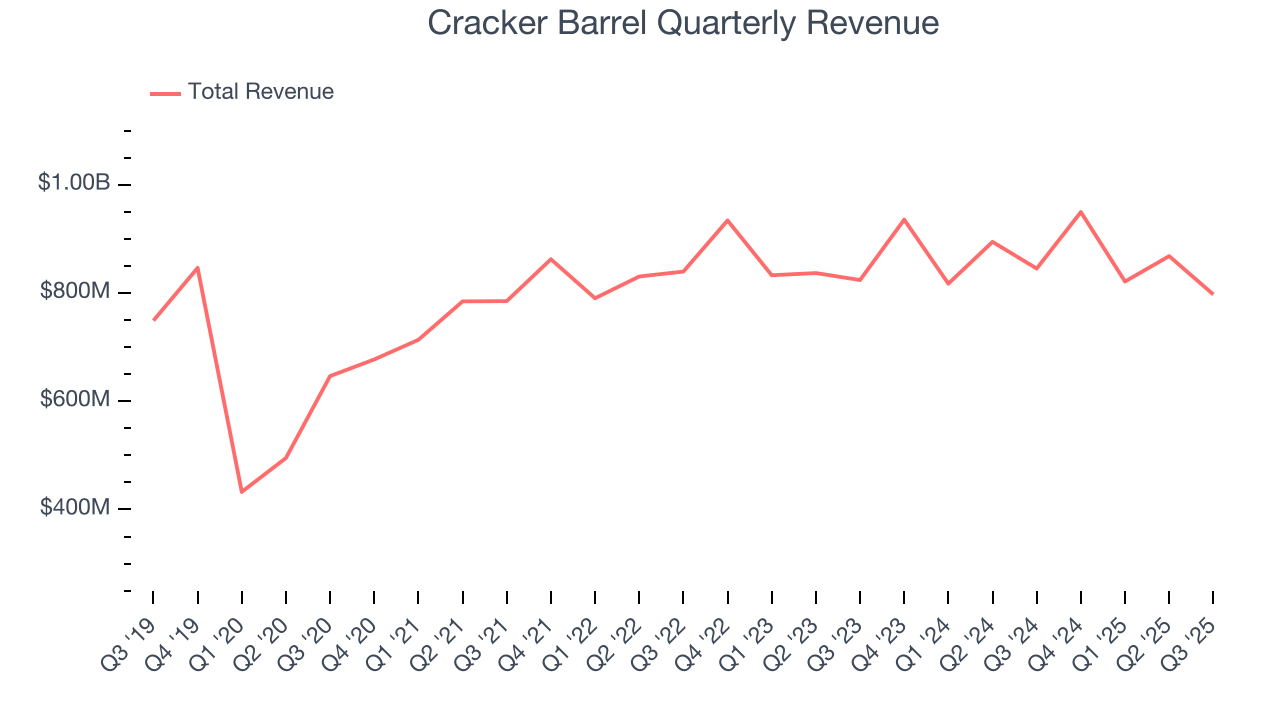
This quarter, Cracker Barrel reported a rather uninspiring 5.7% year-on-year revenue decline to $797.2 million of revenue, in line with Wall Street’s estimates.
Looking ahead, sell-side analysts expect revenue to decline by 1% over the next 12 months, a slight deceleration versus the last six years. This projection is underwhelming and implies its menu offerings will face some demand challenges.
6. Restaurant Performance
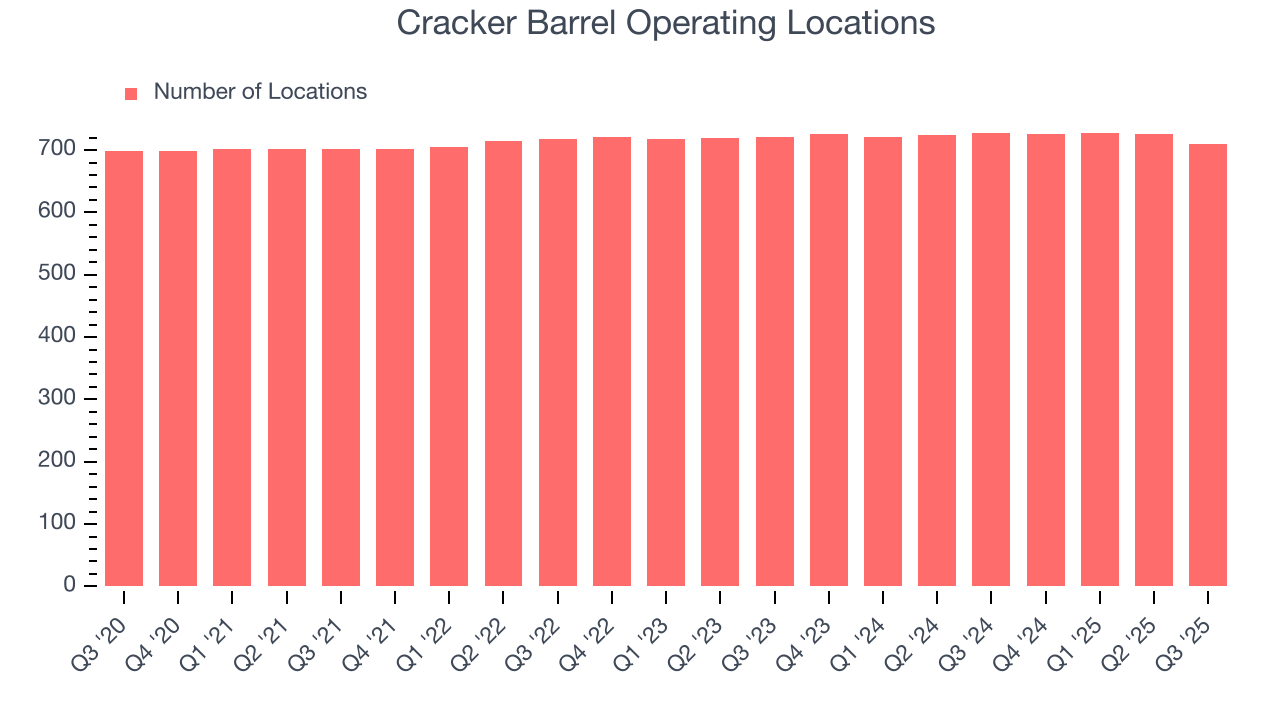
Number of Restaurants
Cracker Barrel listed 710 locations in the latest quarter and has kept its restaurant count flat over the last two years while other restaurant businesses have opted for growth.
When a chain doesn’t open many new restaurants, it usually means there’s stable demand for its meals and it’s focused on improving operational efficiency to increase profitability.
Same-Store Sales
A company's restaurant base only paints one part of the picture. When demand is high, it makes sense to open more. But when demand is low, it’s prudent to close some locations and use the money in other ways. Same-store sales is an industry measure of whether revenue is growing at those existing restaurants and is driven by customer visits (often called traffic) and the average spending per customer (ticket).
Cracker Barrel’s demand within its existing dining locations has been relatively stable over the last two years but was below most restaurant chains. On average, the company’s same-store sales have grown by 1.2% per year. Given its flat restaurant base over the same period, this performance stems from a mixture of higher prices and increased foot traffic at existing locations.
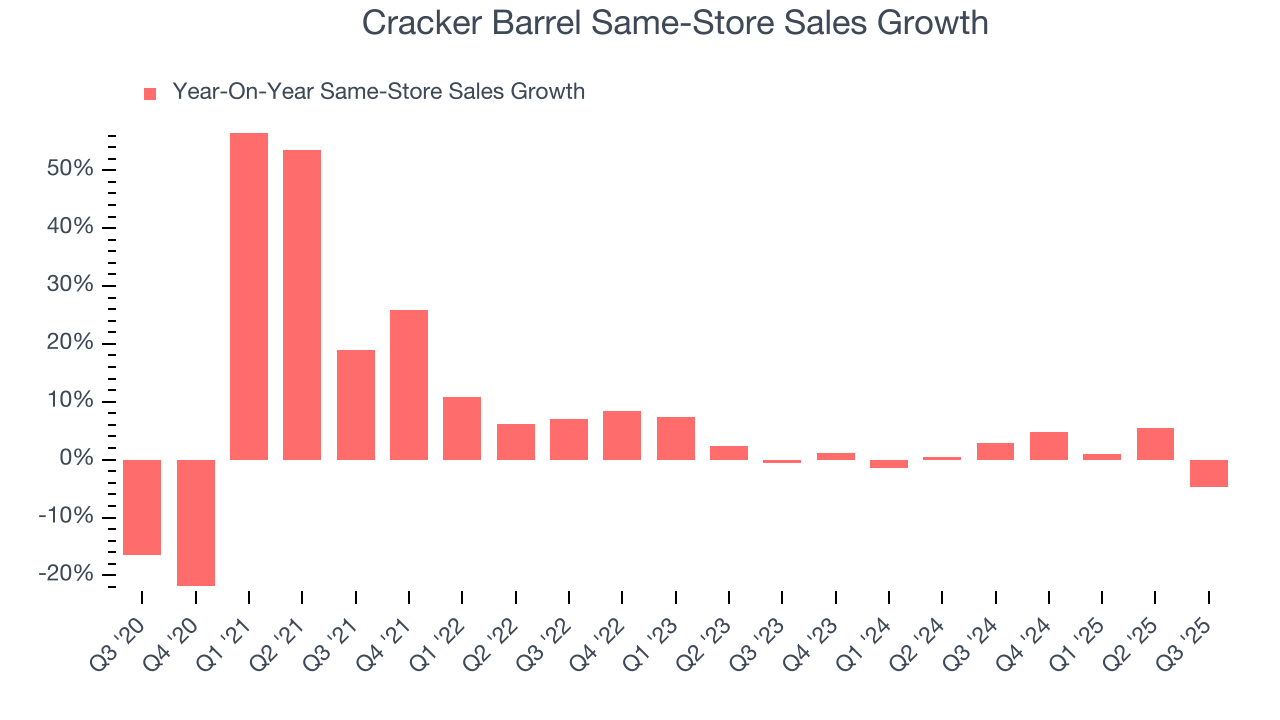
In the latest quarter, Cracker Barrel’s same-store sales fell by 4.7% year on year. This decline was a reversal from its historical levels.
7. Gross Margin & Pricing Power
Gross profit margins are an important measure of a restaurant’s pricing power and differentiation, whether it be the dining experience or quality and taste of food.
Cracker Barrel has good unit economics for a restaurant company, giving it the opportunity to invest in areas such as marketing and talent to stay competitive. As you can see below, it averaged an impressive 32.4% gross margin over the last two years. Said differently, Cracker Barrel paid its suppliers $67.62 for every $100 in revenue. 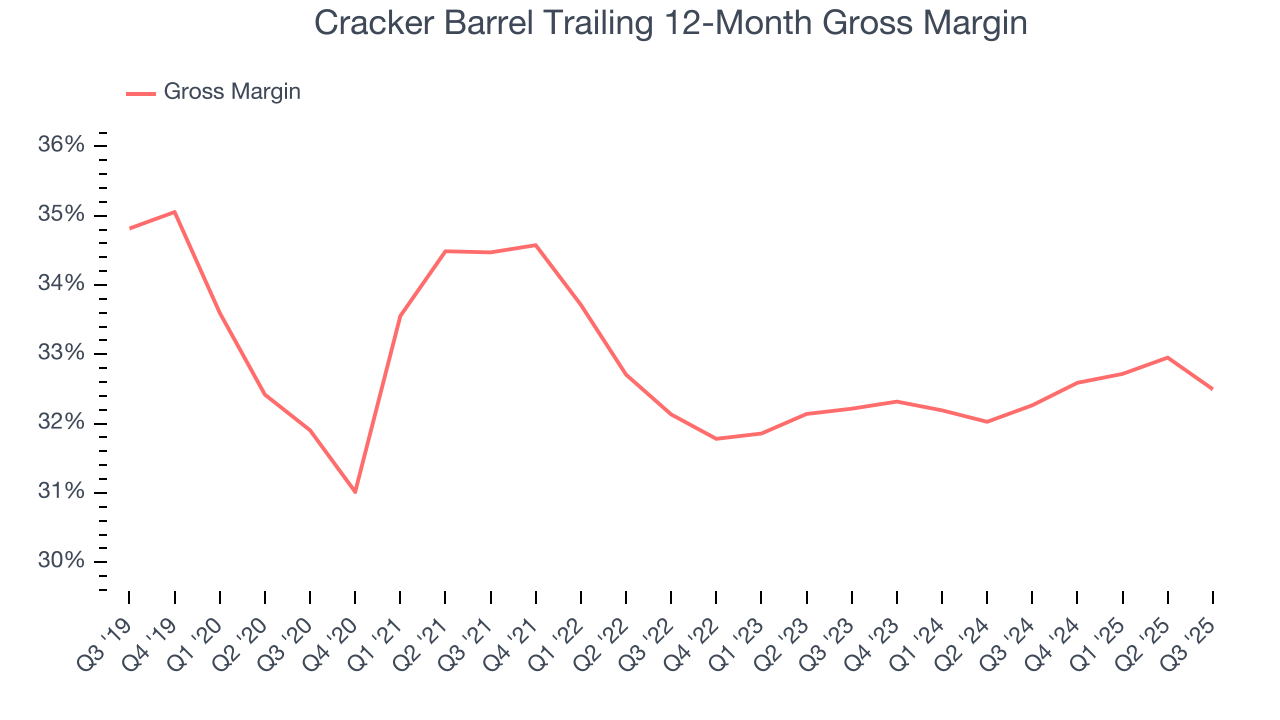
Cracker Barrel’s gross profit margin came in at 31% this quarter, down 2 percentage points year on year. On a wider time horizon, the company’s full-year margin has remained steady over the past four quarters, suggesting its input costs (such as ingredients and transportation expenses) have been stable and it isn’t under pressure to lower prices.
8. Operating Margin
Cracker Barrel’s operating margin might fluctuated slightly over the last 12 months but has generally stayed the same. The company broke even over the last two years, inadequate for a restaurant business. Its large expense base and inefficient cost structure were the main culprits behind this performance.
Looking at the trend in its profitability, Cracker Barrel’s operating margin might fluctuated slightly but has generally stayed the same over the last year. This raises questions about the company’s expense base because its revenue growth should have given it leverage on its fixed costs, resulting in better economies of scale and profitability.
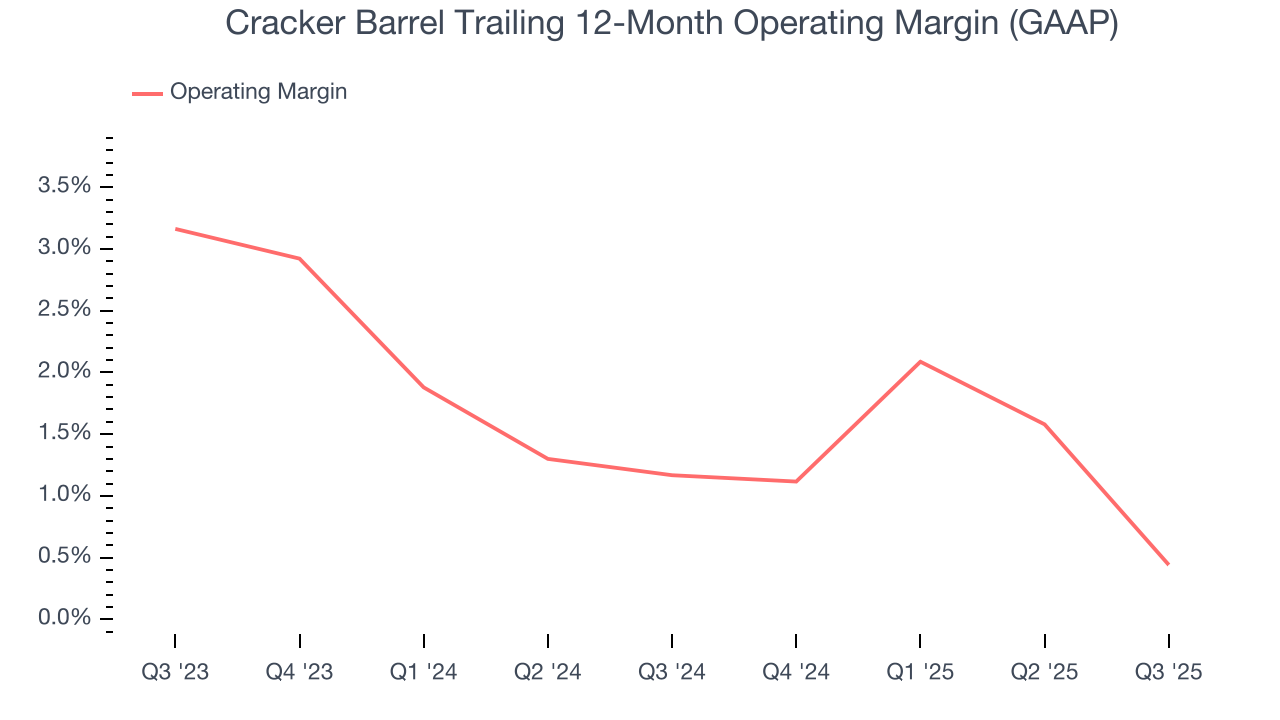
In Q3, Cracker Barrel generated an operating margin profit margin of negative 4.1%, down 5 percentage points year on year. Since Cracker Barrel’s operating margin decreased more than its gross margin, we can assume it was less efficient because expenses such as marketing, and administrative overhead increased.
9. Earnings Per Share
Revenue trends explain a company’s historical growth, but the long-term change in earnings per share (EPS) points to the profitability of that growth – for example, a company could inflate its sales through excessive spending on advertising and promotions.
Sadly for Cracker Barrel, its EPS declined by 22.6% annually over the last six years while its revenue grew by 1.8%. This tells us the company became less profitable on a per-share basis as it expanded due to non-fundamental factors such as interest expenses and taxes.
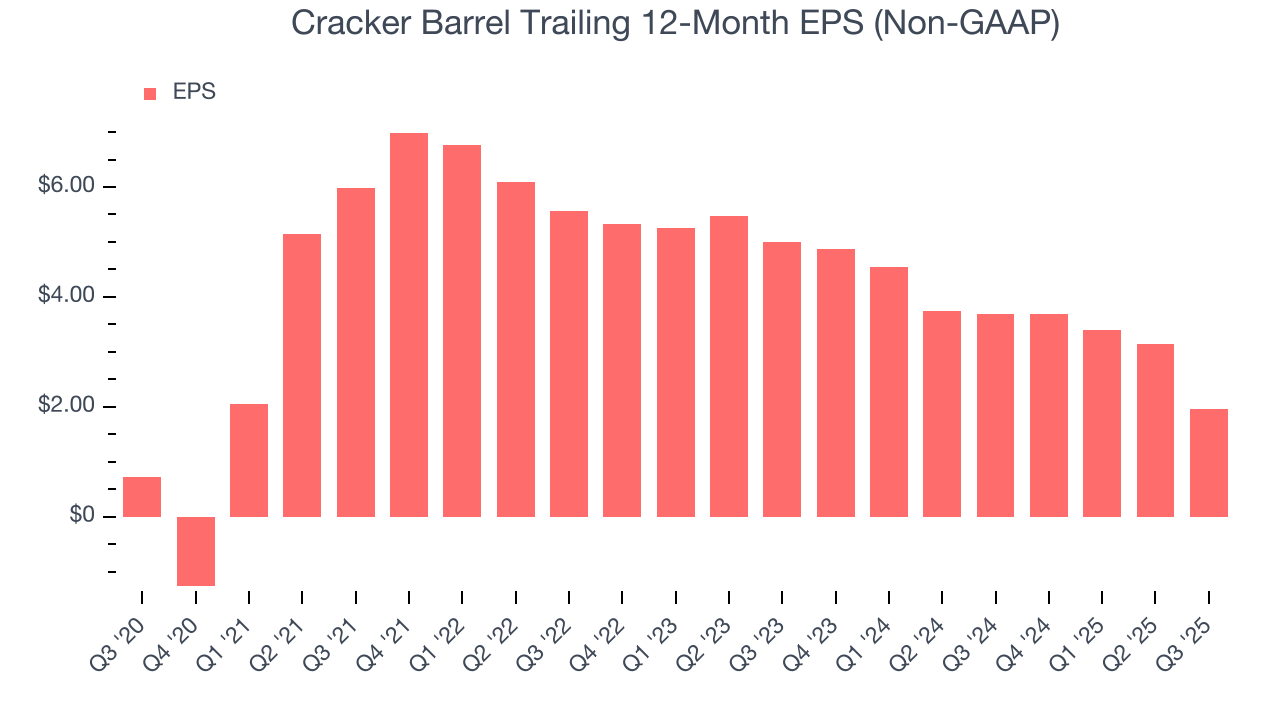
In Q3, Cracker Barrel reported adjusted EPS of negative $0.74, down from $0.45 in the same quarter last year. This print slightly missed analysts’ estimates. Over the next 12 months, Wall Street expects Cracker Barrel’s full-year EPS of $1.96 to shrink by 21.4%.
10. Cash Is King
Although earnings are undoubtedly valuable for assessing company performance, we believe cash is king because you can’t use accounting profits to pay the bills.
Cracker Barrel broke even from a free cash flow perspective over the last two years, giving the company limited opportunities to return capital to shareholders.
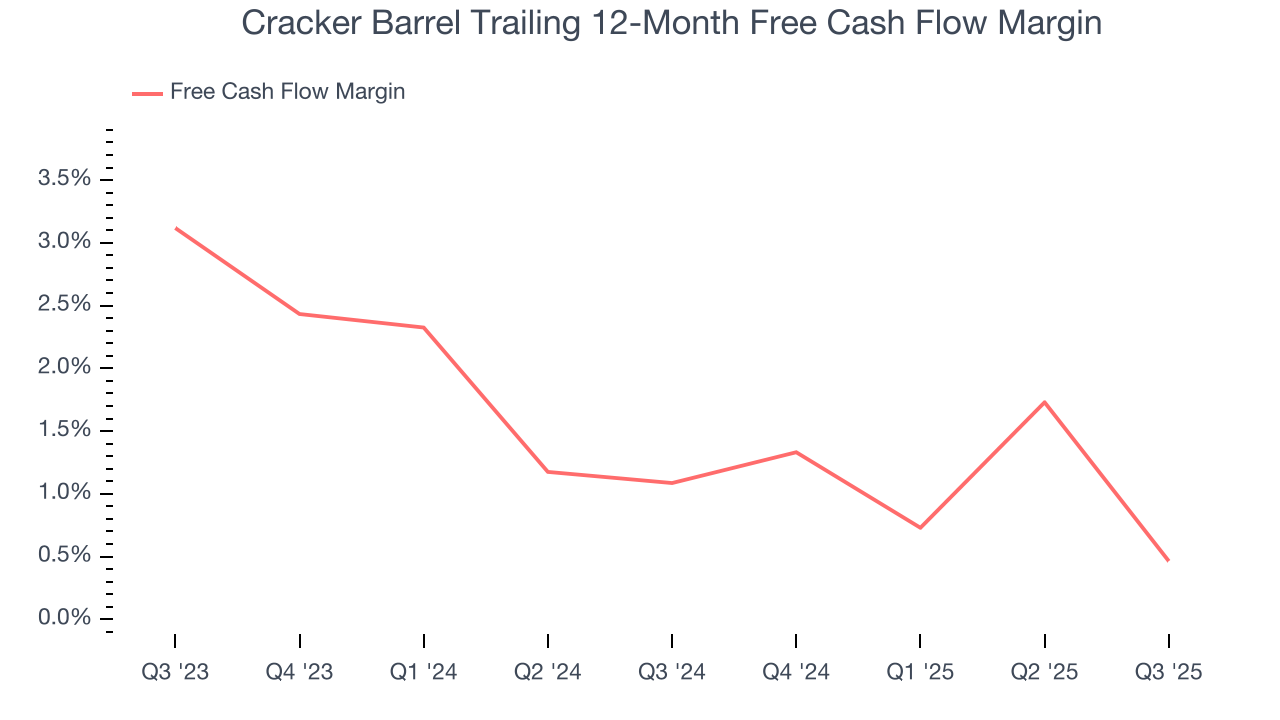
Cracker Barrel burned through $87.6 million of cash in Q3, equivalent to a negative 11% margin. The company’s cash burn increased from $43.28 million of lost cash in the same quarter last year.
11. Return on Invested Capital (ROIC)
EPS and free cash flow tell us whether a company was profitable while growing its revenue. But was it capital-efficient? A company’s ROIC explains this by showing how much operating profit it makes compared to the money it has raised (debt and equity).
Cracker Barrel historically did a mediocre job investing in profitable growth initiatives. Its five-year average ROIC was 5.7%, somewhat low compared to the best restaurant companies that consistently pump out 15%+.
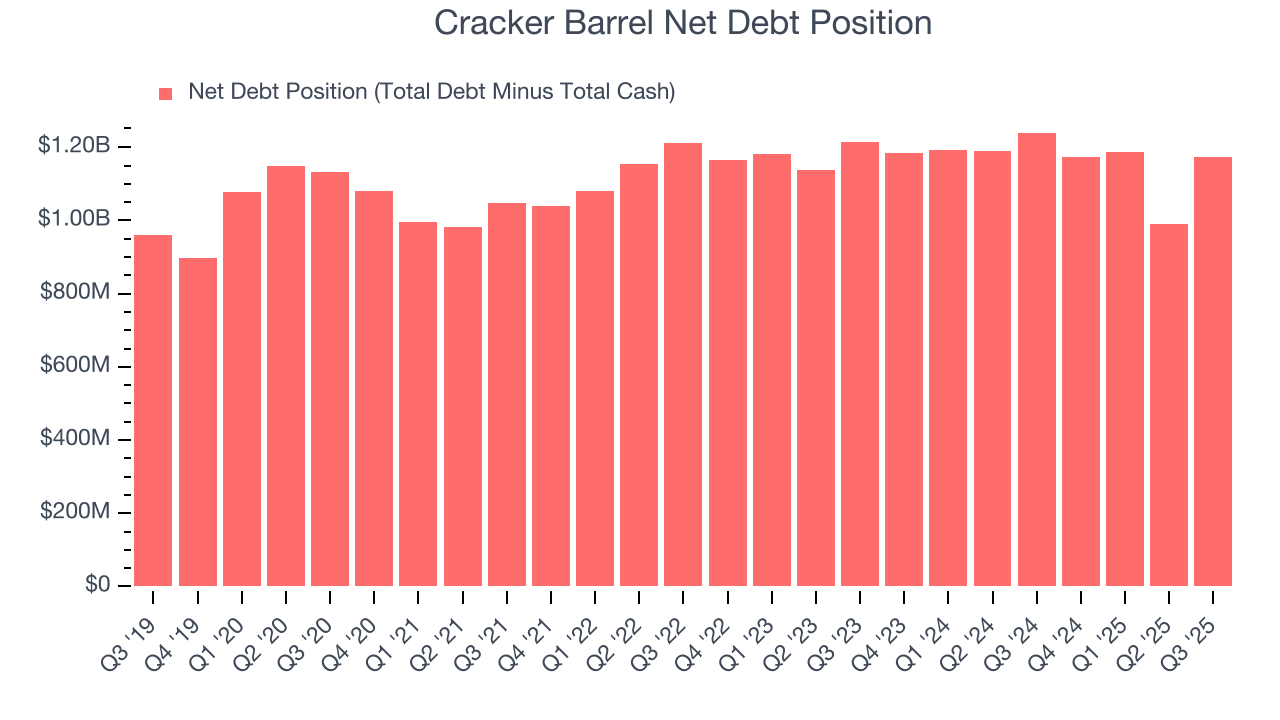
12. Balance Sheet Risk
As long-term investors, the risk we care about most is the permanent loss of capital, which can happen when a company goes bankrupt or raises money from a disadvantaged position. This is separate from short-term stock price volatility, something we are much less bothered by.
Cracker Barrel’s $1.18 billion of debt exceeds the $8.94 million of cash on its balance sheet. Furthermore, its 6× net-debt-to-EBITDA ratio (based on its EBITDA of $185.7 million over the last 12 months) shows the company is overleveraged.
At this level of debt, incremental borrowing becomes increasingly expensive and credit agencies could downgrade the company’s rating if profitability falls. Cracker Barrel could also be backed into a corner if the market turns unexpectedly – a situation we seek to avoid as investors in high-quality companies.
We hope Cracker Barrel can improve its balance sheet and remain cautious until it increases its profitability or pays down its debt.
13. Key Takeaways from Cracker Barrel’s Q3 Results
We struggled to find many positives in these results. Same-stores sales declined meaningfully, leading to an EBITDA miss in the quarter. Looking ahead, the company's full-year revenue guidance missed and its full-year EBITDA guidance also fell short of Wall Street’s estimates. Overall, this quarter was bad. The stock traded down 12% to $23.65 immediately after reporting.
14. Is Now The Time To Buy Cracker Barrel?
Updated: December 9, 2025 at 9:48 PM EST
Before making an investment decision, investors should account for Cracker Barrel’s business fundamentals and valuation in addition to what happened in the latest quarter.
We see the value of companies helping consumers, but in the case of Cracker Barrel, we’re out. For starters, its revenue growth was weak over the last six years, and analysts expect its demand to deteriorate over the next 12 months. And while its favorable reputation gives it meaningful influence over consumers’ dining decisions, the downside is its declining EPS over the last six years makes it a less attractive asset to the public markets. On top of that, its projected EPS for the next year is lacking.
Cracker Barrel’s P/E ratio based on the next 12 months is 17.3x. While this valuation is reasonable, we don’t see a big opportunity at the moment. There are better stocks to buy right now.
Wall Street analysts have a consensus one-year price target of $39.88 on the company (compared to the current share price of $24.93).
Although the price target is bullish, readers should exercise caution because analysts tend to be overly optimistic. The firms they work for, often big banks, have relationships with companies that extend into fundraising, M&A advisory, and other rewarding business lines. As a result, they typically hesitate to say bad things for fear they will lose out. We at StockStory do not suffer from such conflicts of interest, so we’ll always tell it like it is.