
Connection (CNXN)
We wouldn’t recommend Connection. Its underwhelming revenue growth and failure to generate meaningful free cash flow is a concerning trend.― StockStory Analyst Team
1. News


2. Summary
Why We Think Connection Will Underperform
Starting as a small computer products seller in 1982 and evolving into a Fortune 1000 company, Connection (NASDAQ:CNXN) is a technology solutions provider that helps businesses and government agencies design, purchase, implement, and manage their IT infrastructure and systems.
- Sales stagnated over the last two years and signal the need for new growth strategies
- Operating margin falls short of the industry average, and the smaller profit dollars make it harder to react to unexpected market developments
- Earnings growth underperformed the sector average over the last two years as its EPS grew by just 4.5% annually


Connection’s quality doesn’t meet our expectations. More profitable opportunities exist elsewhere.
Why There Are Better Opportunities Than Connection


Connection is trading at $58.76 per share, or 16.6x forward P/E. This multiple is cheaper than most business services peers, but we think this is justified.
It’s better to pay up for high-quality businesses with higher long-term earnings potential rather than to buy lower-quality stocks because they appear cheap. These challenged businesses often don’t re-rate, a phenomenon known as a “value trap”.
3. Connection (CNXN) Research Report: Q4 CY2025 Update
IT solutions provider Connection (NASDAQ:CNXN) missed Wall Street’s revenue expectations in Q4 CY2025, with sales flat year on year at $702.9 million. Its non-GAAP profit of $0.91 per share was 5.8% above analysts’ consensus estimates.
Connection (CNXN) Q4 CY2025 Highlights:
- Revenue: $702.9 million vs analyst estimates of $735.5 million (flat year on year, 4.4% miss)
- Adjusted EPS: $0.91 vs analyst estimates of $0.86 (5.8% beat)
- Adjusted EBITDA: $31.77 million vs analyst estimates of $28.5 million (4.5% margin, 11.5% beat)
- Operating Margin: 3.4%, in line with the same quarter last year
- Free Cash Flow Margin: 3.6%, similar to the same quarter last year
- Market Capitalization: $1.48 billion
Company Overview
Starting as a small computer products seller in 1982 and evolving into a Fortune 1000 company, Connection (NASDAQ:CNXN) is a technology solutions provider that helps businesses and government agencies design, purchase, implement, and manage their IT infrastructure and systems.
Connection operates through three distinct segments targeting different markets: Enterprise Solutions for large corporations, Business Solutions for small to medium-sized businesses, and Public Sector Solutions for government and educational institutions. The company serves as a bridge between technology manufacturers and end users, offering hardware, software, cloud solutions, and a range of IT services.
The company's Technology Solutions Organization provides technical expertise and consulting services, helping customers navigate complex IT decisions. Their ISO-certified Technology Integration and Distribution Center in Ohio handles product configuration, imaging, and custom integration services, processing hundreds of thousands of custom configurations annually.
A typical customer might engage Connection when upgrading their corporate network infrastructure. Connection's account managers would assess their needs, recommend appropriate hardware and software from their catalog of over 460,000 products, configure the equipment to the customer's specifications, and potentially provide ongoing support services.
Connection generates revenue primarily through product sales and service fees. The company maintains relationships with approximately 2,500 technology suppliers, including major vendors like Microsoft, HP, Dell, Apple, and Cisco. This extensive network allows Connection to offer competitive pricing and product availability to its customers.
The company employs a multi-channel sales approach, combining inside sales representatives, field sales personnel, and e-commerce platforms. Their custom web-based procurement system, MarkITplace, allows corporate customers to efficiently search, compare prices, and purchase IT products online. Connection also maintains specialized industry teams focused on sectors like healthcare, retail, finance, and manufacturing to address unique vertical market needs.
4. IT Distribution & Solutions
IT Distribution & Solutions will be buoyed by the increasing complexity of IT ecosystems, rising cloud adoption, and demand for cybersecurity solutions. Enterprises are less likely than ever to embark on these complicated journeys solo, and companies in the sector boast expertise and scale in these areas. However, cloud migration also means less need for hardware, which could dent demand for large portions of the product portfolio and hurt margins. Additionally, planning for potentially supply chain disruptions is ongoing, as the COVID-19 pandemic showed how damaging a pause in global trade could be in areas like semiconductor procurement.
Connection competes with other national IT solutions providers such as CDW Corporation, SHI, and Insight Enterprises. The company also faces competition from manufacturers selling directly to customers (like Dell, HP, and Apple), cloud providers (including Amazon Web Services, Google, and Microsoft), and large system integrators such as Accenture, CGI, and IBM.
5. Revenue Growth
A company’s long-term sales performance can indicate its overall quality. Even a bad business can shine for one or two quarters, but a top-tier one grows for years.
With $2.87 billion in revenue over the past 12 months, Connection is a mid-sized business services company, which sometimes brings disadvantages compared to larger competitors benefiting from better economies of scale.
As you can see below, Connection’s sales grew at a sluggish 2.1% compounded annual growth rate over the last five years. This shows it failed to generate demand in any major way and is a rough starting point for our analysis.
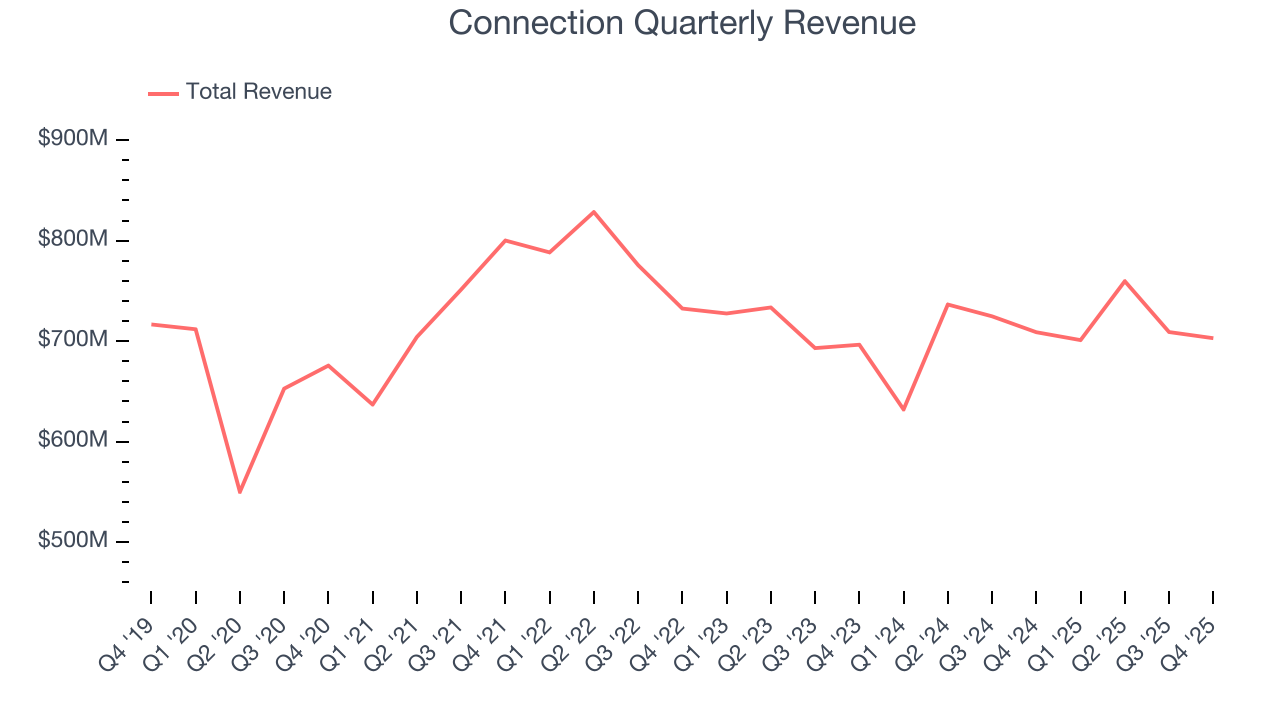
We at StockStory place the most emphasis on long-term growth, but within business services, a half-decade historical view may miss recent innovations or disruptive industry trends. Connection’s recent performance shows its demand has slowed as its revenue was flat over the last two years. 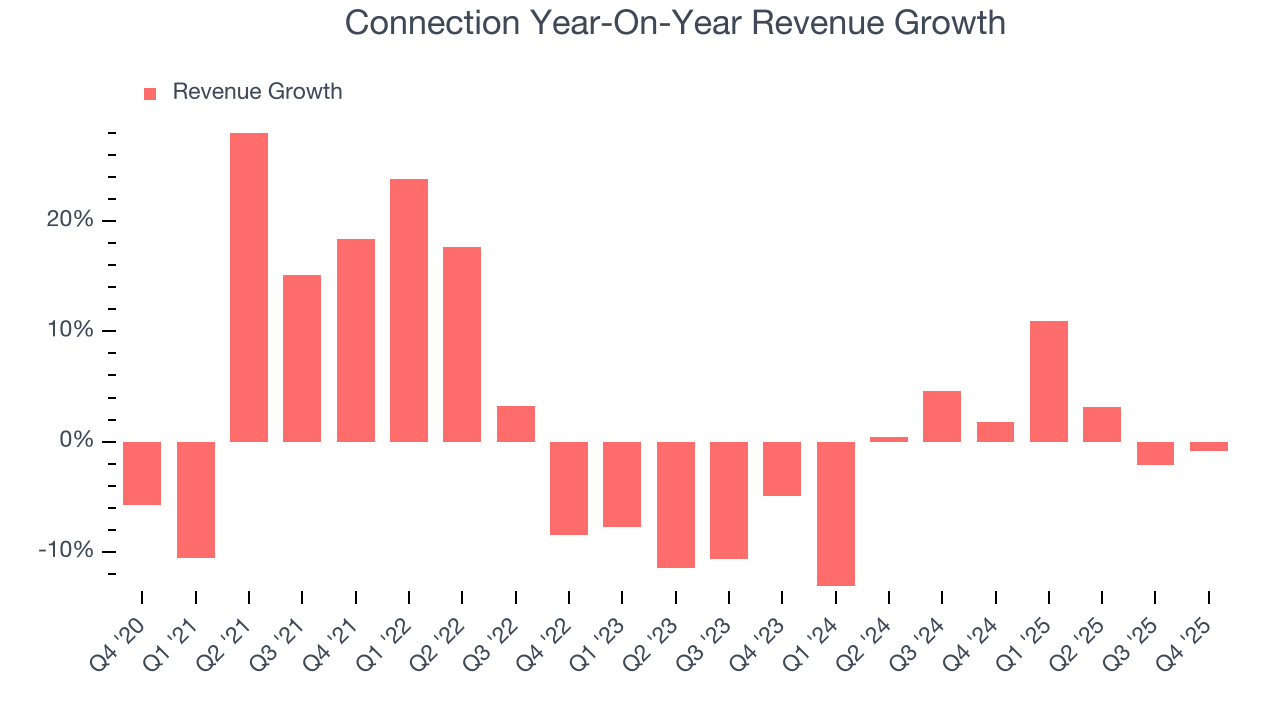
This quarter, Connection missed Wall Street’s estimates and reported a rather uninspiring 0.8% year-on-year revenue decline, generating $702.9 million of revenue.
Looking ahead, sell-side analysts expect revenue to grow 5.7% over the next 12 months, an improvement versus the last two years. This projection is above average for the sector and indicates its newer products and services will spur better top-line performance.
6. Operating Margin
Operating margin is a key measure of profitability. Think of it as net income - the bottom line - excluding the impact of taxes and interest on debt, which are less connected to business fundamentals.
Connection’s operating margin might fluctuated slightly over the last 12 months but has remained more or less the same, averaging 3.6% over the last five years. This profitability was lousy for a business services business and caused by its suboptimal cost structure.
Analyzing the trend in its profitability, Connection’s operating margin might fluctuated slightly but has generally stayed the same over the last five years. This raises questions about the company’s expense base because its revenue growth should have given it leverage on its fixed costs, resulting in better economies of scale and profitability.
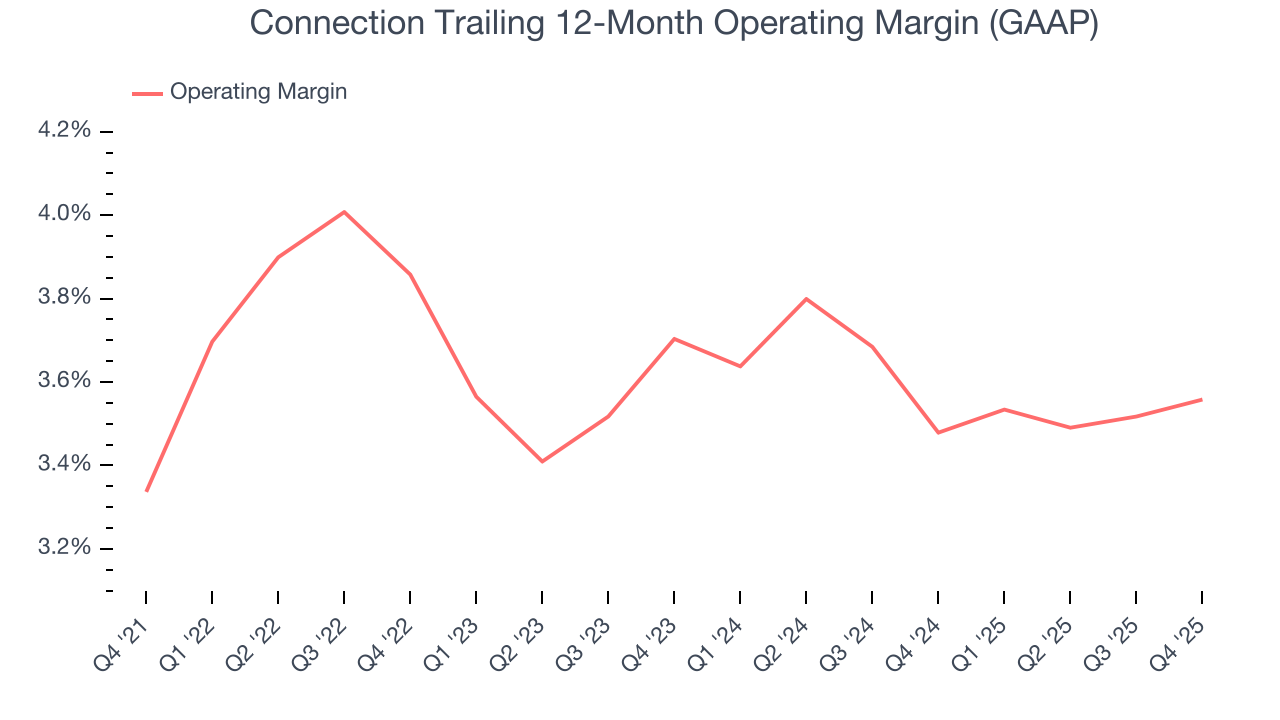
This quarter, Connection generated an operating margin profit margin of 3.4%, in line with the same quarter last year. This indicates the company’s overall cost structure has been relatively stable.
7. Earnings Per Share
We track the long-term change in earnings per share (EPS) for the same reason as long-term revenue growth. Compared to revenue, however, EPS highlights whether a company’s growth is profitable.
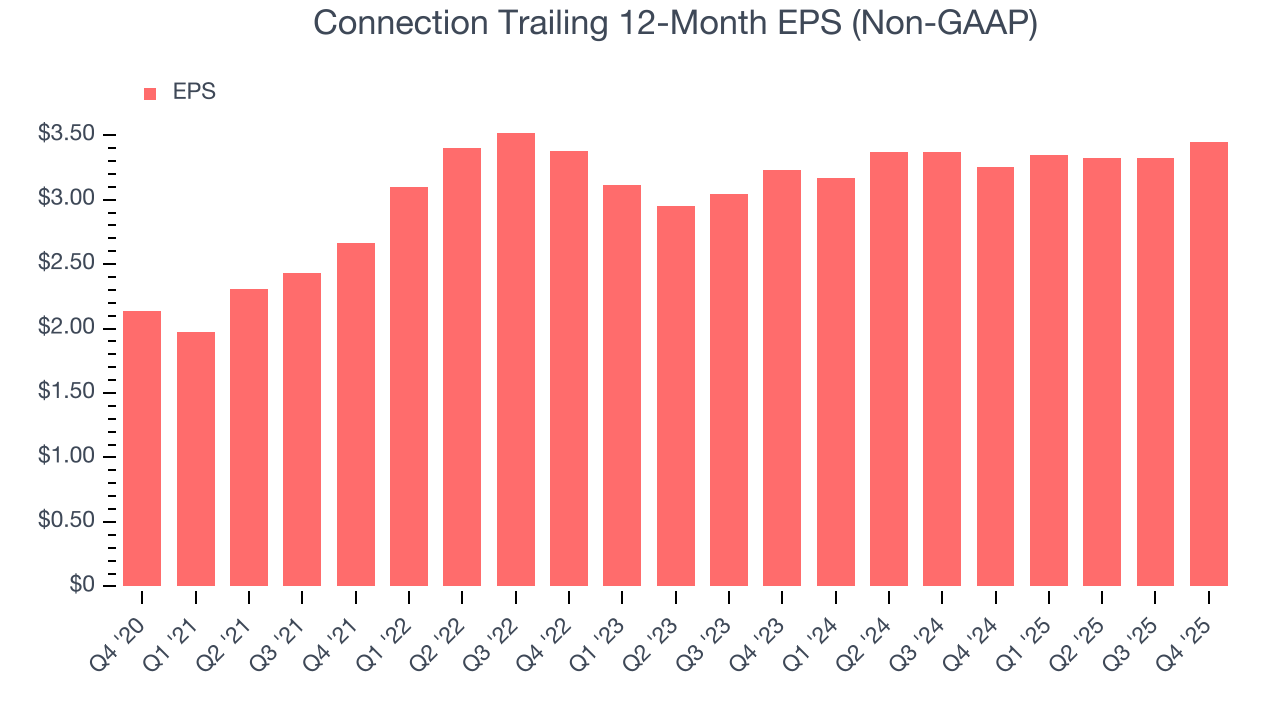
Connection’s EPS grew at a solid 10% compounded annual growth rate over the last five years, higher than its 2.1% annualized revenue growth. However, this alone doesn’t tell us much about its business quality because its operating margin didn’t improve.
Like with revenue, we analyze EPS over a shorter period to see if we are missing a change in the business.
For Connection, its two-year annual EPS growth of 3.3% was lower than its five-year trend. We hope its growth can accelerate in the future.
In Q4, Connection reported adjusted EPS of $0.91, up from $0.78 in the same quarter last year. This print beat analysts’ estimates by 5.8%. Over the next 12 months, Wall Street expects Connection’s full-year EPS of $3.45 to grow 10%.
8. Cash Is King
If you’ve followed StockStory for a while, you know we emphasize free cash flow. Why, you ask? We believe that in the end, cash is king, and you can’t use accounting profits to pay the bills.
Connection has shown weak cash profitability over the last five years, giving the company limited opportunities to return capital to shareholders. Its free cash flow margin averaged 3.3%, subpar for a business services business.
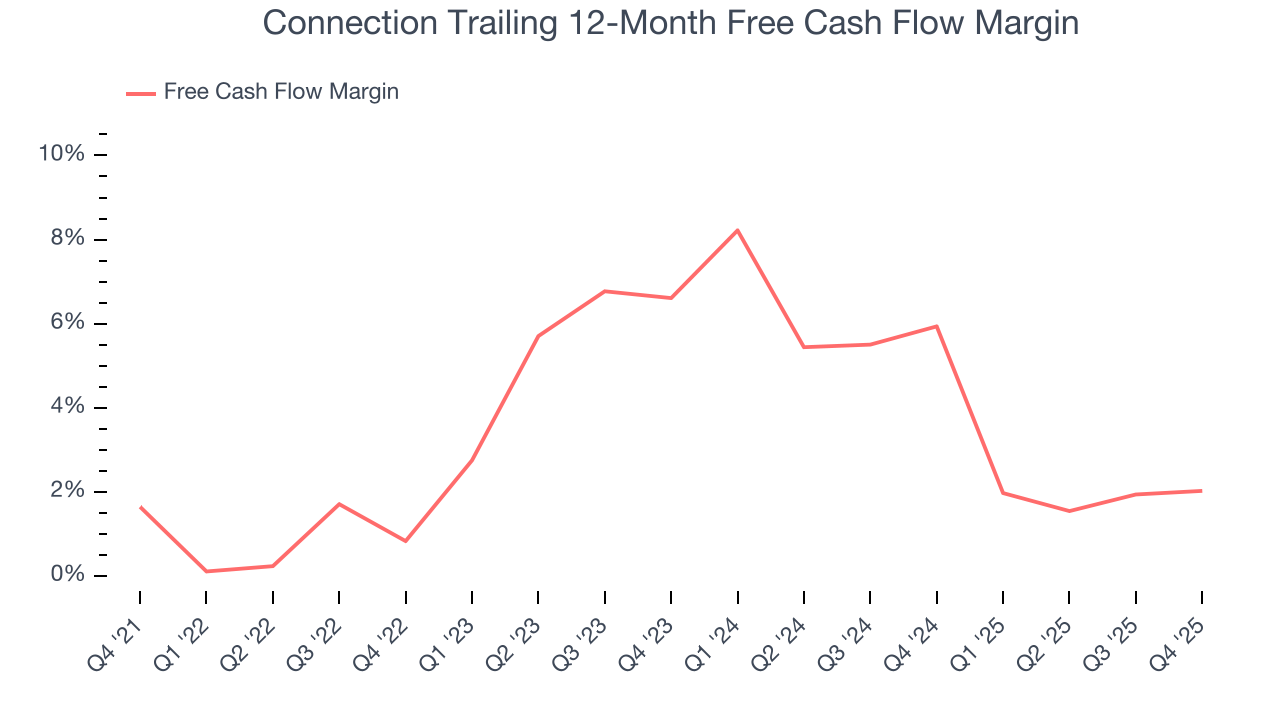
Connection’s free cash flow clocked in at $25.23 million in Q4, equivalent to a 3.6% margin. This cash profitability was in line with the comparable period last year and its five-year average.
9. Return on Invested Capital (ROIC)
EPS and free cash flow tell us whether a company was profitable while growing its revenue. But was it capital-efficient? A company’s ROIC explains this by showing how much operating profit it makes compared to the money it has raised (debt and equity).
Although Connection hasn’t been the highest-quality company lately because of its poor top-line performance, it historically found a few growth initiatives that worked. Its five-year average ROIC was 13.9%, higher than most business services businesses.
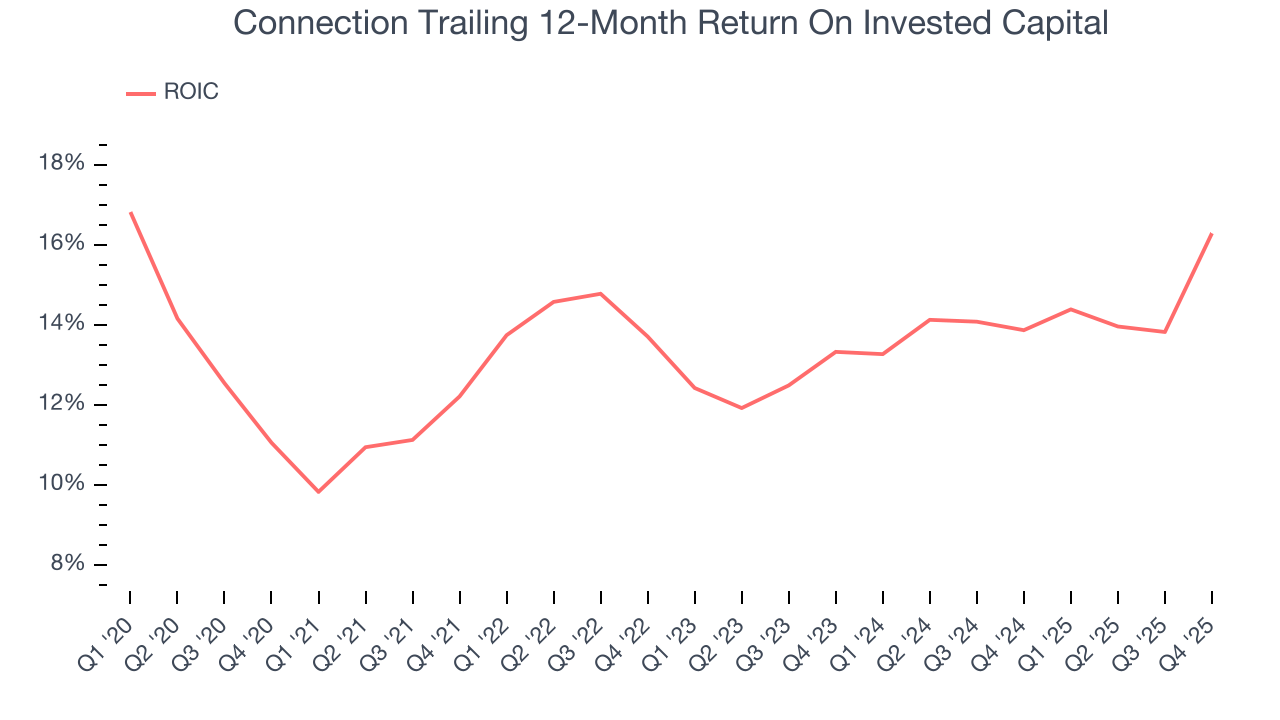
We like to invest in businesses with high returns, but the trend in a company’s ROIC is what often surprises the market and moves the stock price. On average, Connection’s ROIC increased by 2.1 percentage points annually each year over the last few years. This is a good sign, and we hope the company can keep improving.
10. Balance Sheet Assessment
One of the best ways to mitigate bankruptcy risk is to hold more cash than debt.
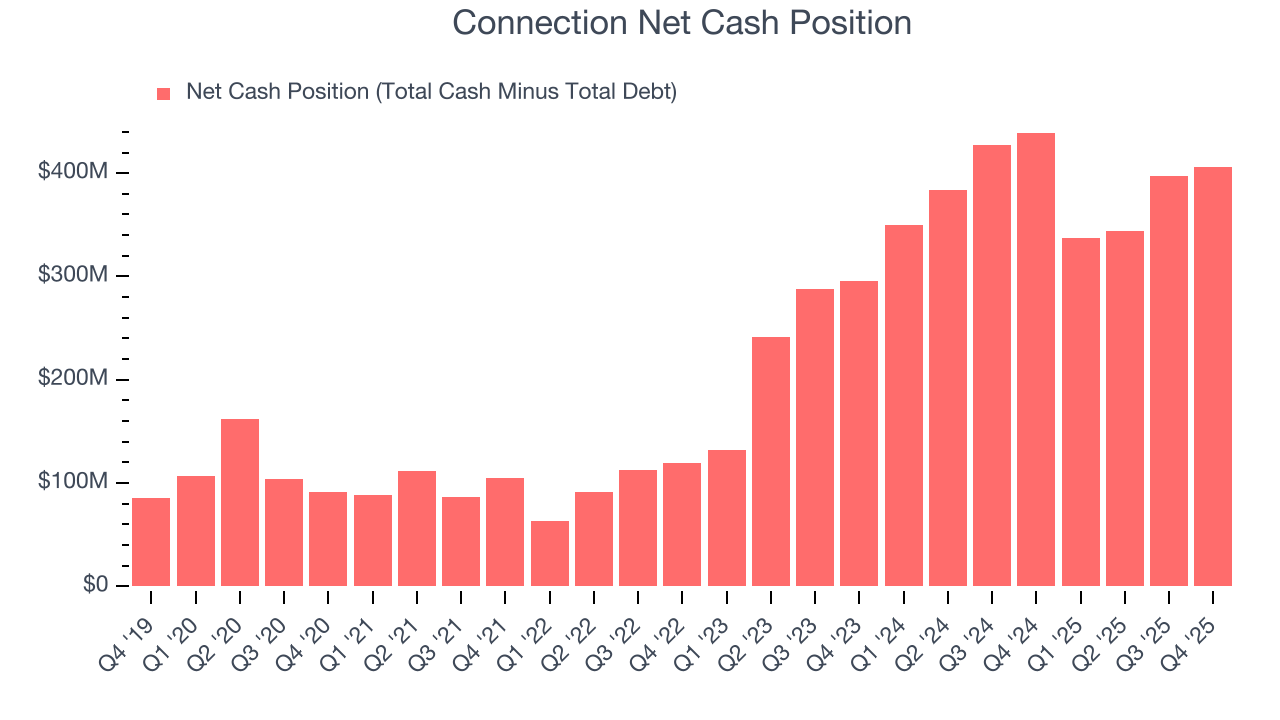
Connection is a profitable, well-capitalized company with $406.7 million of cash and $498,000 of debt on its balance sheet. This $406.2 million net cash position is 27.4% of its market cap and gives it the freedom to borrow money, return capital to shareholders, or invest in growth initiatives. Leverage is not an issue here.
11. Key Takeaways from Connection’s Q4 Results
It was good to see Connection beat analysts’ EPS expectations this quarter. On the other hand, its revenue missed. Overall, this was a mixed quarter . The stock remained flat at $60.24 immediately following the results.
12. Is Now The Time To Buy Connection?
Updated: February 4, 2026 at 4:17 PM EST
Before making an investment decision, investors should account for Connection’s business fundamentals and valuation in addition to what happened in the latest quarter.
We see the value of companies helping their customers, but in the case of Connection, we’re out. For starters, its revenue growth was weak over the last five years. And while its projected EPS for the next year implies the company will continue generating shareholder value, the downside is its operating margins reveal poor profitability compared to other business services companies. On top of that, its low free cash flow margins give it little breathing room.
Connection’s P/E ratio based on the next 12 months is 15.9x. This valuation tells us a lot of optimism is priced in - you can find more timely opportunities elsewhere.
Wall Street analysts have a consensus one-year price target of $76 on the company (compared to the current share price of $60.24).
Although the price target is bullish, readers should exercise caution because analysts tend to be overly optimistic. The firms they work for, often big banks, have relationships with companies that extend into fundraising, M&A advisory, and other rewarding business lines. As a result, they typically hesitate to say bad things for fear they will lose out. We at StockStory do not suffer from such conflicts of interest, so we’ll always tell it like it is.