CSX (CSX)
We wouldn’t buy CSX. Its poor sales growth and falling returns on capital suggest its growth opportunities are shrinking.― StockStory Analyst Team
1. News


2. Summary
Why We Think CSX Will Underperform
Established as part of the Chessie System and Seaboard Coast Line Industries merger, CSX (NASDAQ:CSX) is a transportation company specializing in freight rail services.
- Products and services are facing significant end-market challenges during this cycle as sales have declined by 1.9% annually over the last two years
- Sales were less profitable over the last two years as its earnings per share fell by 6.5% annually, worse than its revenue declines
- Estimated sales growth of 2.9% for the next 12 months is soft and implies weaker demand


CSX’s quality doesn’t meet our expectations. There are more rewarding stocks elsewhere.
Why There Are Better Opportunities Than CSX


At $40.28 per share, CSX trades at 22.3x forward P/E. This multiple is cheaper than most industrials peers, but we think this is justified.
We’d rather pay up for companies with elite fundamentals than get a bargain on weak ones. Cheap stocks can be value traps, and as their performance deteriorates, they will stay cheap or get even cheaper.
3. CSX (CSX) Research Report: Q4 CY2025 Update
Freight rail services provider CSX (NASDAQ:CSX) missed Wall Street’s revenue expectations in Q4 CY2025, with sales flat year on year at $3.51 billion. Its non-GAAP profit of $0.39 per share was 5.3% below analysts’ consensus estimates.
CSX (CSX) Q4 CY2025 Highlights:
- Revenue: $3.51 billion vs analyst estimates of $3.54 billion (flat year on year, 0.9% miss)
- Adjusted EPS: $0.39 vs analyst expectations of $0.41 (5.3% miss)
- Adjusted EBITDA: $1.51 billion vs analyst estimates of $1.62 billion (43.2% margin, 6.4% miss)
- Operating Margin: 31.6%, in line with the same quarter last year
- Free Cash Flow Margin: 20.2%, up from 16% in the same quarter last year
- Sales Volumes rose 1.4% year on year, in line with the same quarter last year
- Market Capitalization: $68.02 billion
Company Overview
Established as part of the Chessie System and Seaboard Coast Line Industries merger, CSX (NASDAQ:CSX) is a transportation company specializing in freight rail services.
CSX was created to enhance the efficiency and scope of freight rail services in the eastern United States. The merger aimed to consolidate rail networks, streamline operations, and provide a more robust and reliable transportation infrastructure for various industries.
CSX provides comprehensive freight rail services, addressing the logistical needs of industries such as agriculture, automotive, chemicals, coal, and intermodal transportation. By offering efficient and cost-effective rail solutions, CSX helps businesses move large quantities of goods across significant distances while reducing transit times and logistical complexities.
The company's revenue is primarily derived from transportation fees for hauling freight across its extensive rail network. CSX's business model focuses on long-term contracts with major industries, ensuring a steady and recurring revenue stream. By leveraging its strategic rail infrastructure and logistics capabilities, CSX provides value to customers seeking reliable transportation solutions.
4. Rail Transportation
The growth of e-commerce and global trade continues to drive demand for shipping services, presenting opportunities for rail transportation companies. While moving large volumes by rail can be highly cost-efficient for customers compared to air and ground transport, this mode of transportation results in slower delivery times, presenting a trade off. To improve transit times, the industry continues to invest in digitization to optimize fleets, loads, and even braking systems. However, rail transportation companies are still at the whim of economic cycles. Consumer spending, for example, can greatly impact the demand for these companies’ offerings while fuel costs can influence profit margins.
Public competitors in the rail industry include Union Pacific (NYSE:UNP), Norfolk Southern (NYSE:NSC), and CPKC (NYSE:CP)
5. Revenue Growth
Examining a company’s long-term performance can provide clues about its quality. Any business can put up a good quarter or two, but the best consistently grow over the long haul. Over the last five years, CSX grew its sales at a tepid 5.9% compounded annual growth rate. This fell short of our benchmark for the industrials sector and is a poor baseline for our analysis.
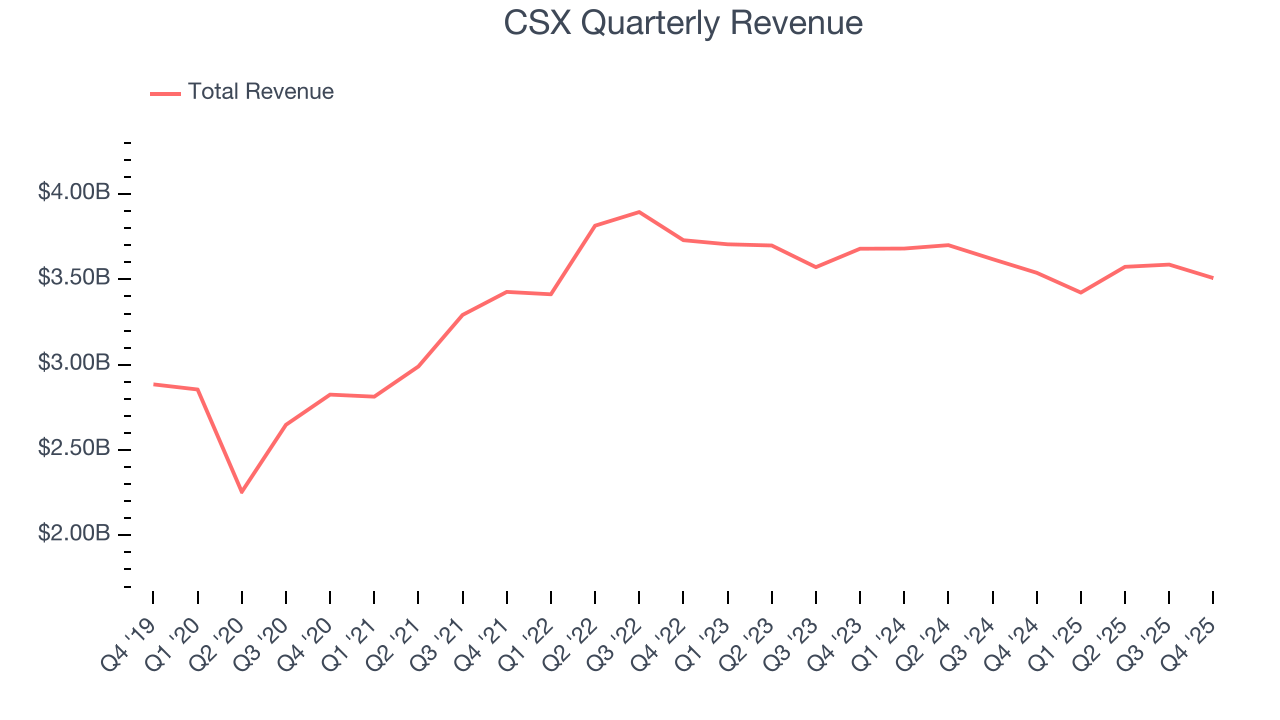
Long-term growth is the most important, but within industrials, a half-decade historical view may miss new industry trends or demand cycles. CSX’s performance shows it grew in the past but relinquished its gains over the last two years, as its revenue fell by 1.9% annually. CSX isn’t alone in its struggles as the Rail Transportation industry experienced a cyclical downturn, with many similar businesses observing lower sales at this time. 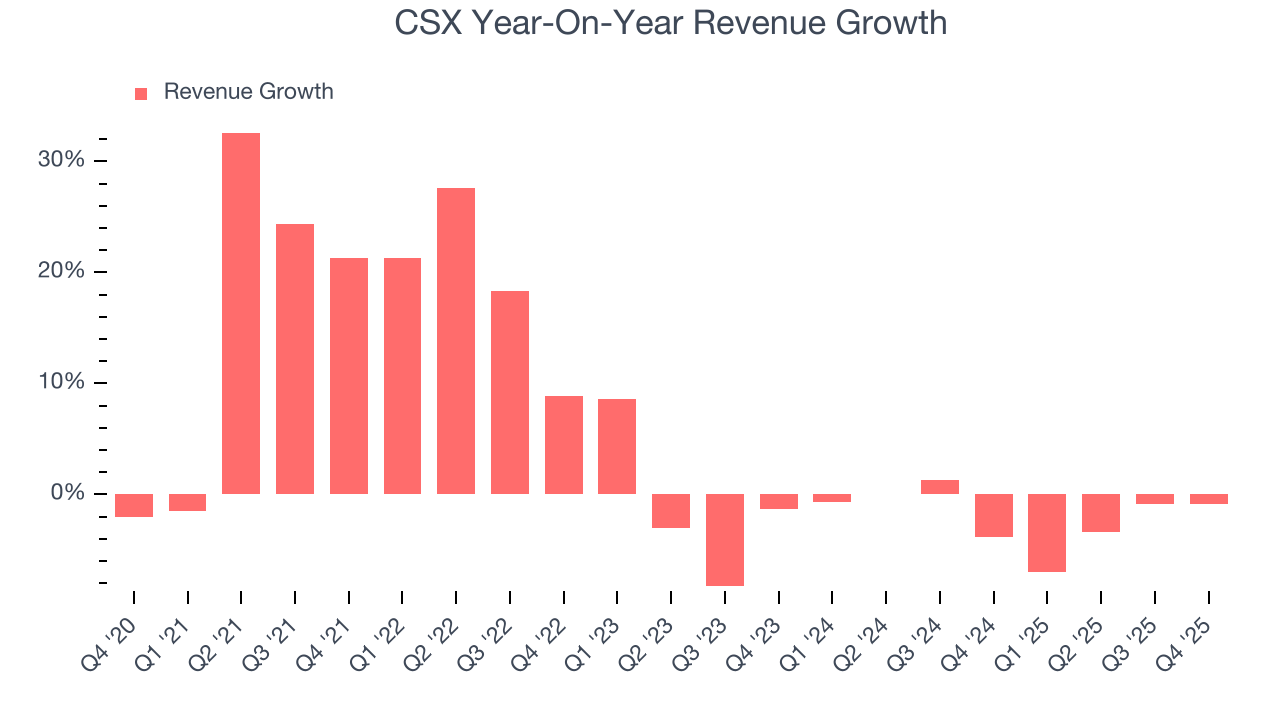
We can dig further into the company’s revenue dynamics by analyzing its number of units sold, which reached 1.6 million in the latest quarter. Over the last two years, CSX’s units sold averaged 1.3% year-on-year growth. Because this number is better than its revenue growth, we can see the company’s average selling price decreased. 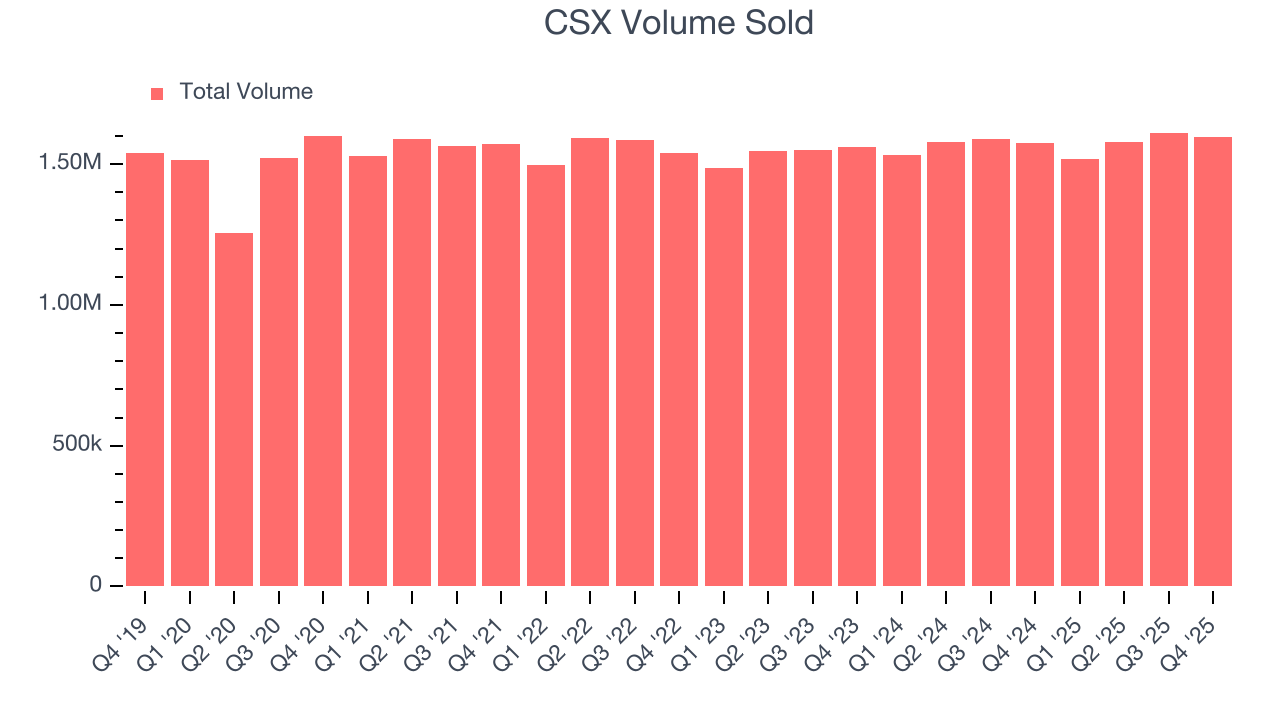
This quarter, CSX missed Wall Street’s estimates and reported a rather uninspiring 0.9% year-on-year revenue decline, generating $3.51 billion of revenue.
Looking ahead, sell-side analysts expect revenue to grow 4% over the next 12 months. While this projection suggests its newer products and services will spur better top-line performance, it is still below the sector average.
6. Gross Margin & Pricing Power
CSX has best-in-class unit economics for an industrials company, enabling it to invest in areas such as research and development. Its margin also signals it sells differentiated products, not commodities. As you can see below, it averaged an elite 49% gross margin over the last five years. Said differently, roughly $49.01 was left to spend on selling, marketing, R&D, and general administrative overhead for every $100 in revenue. 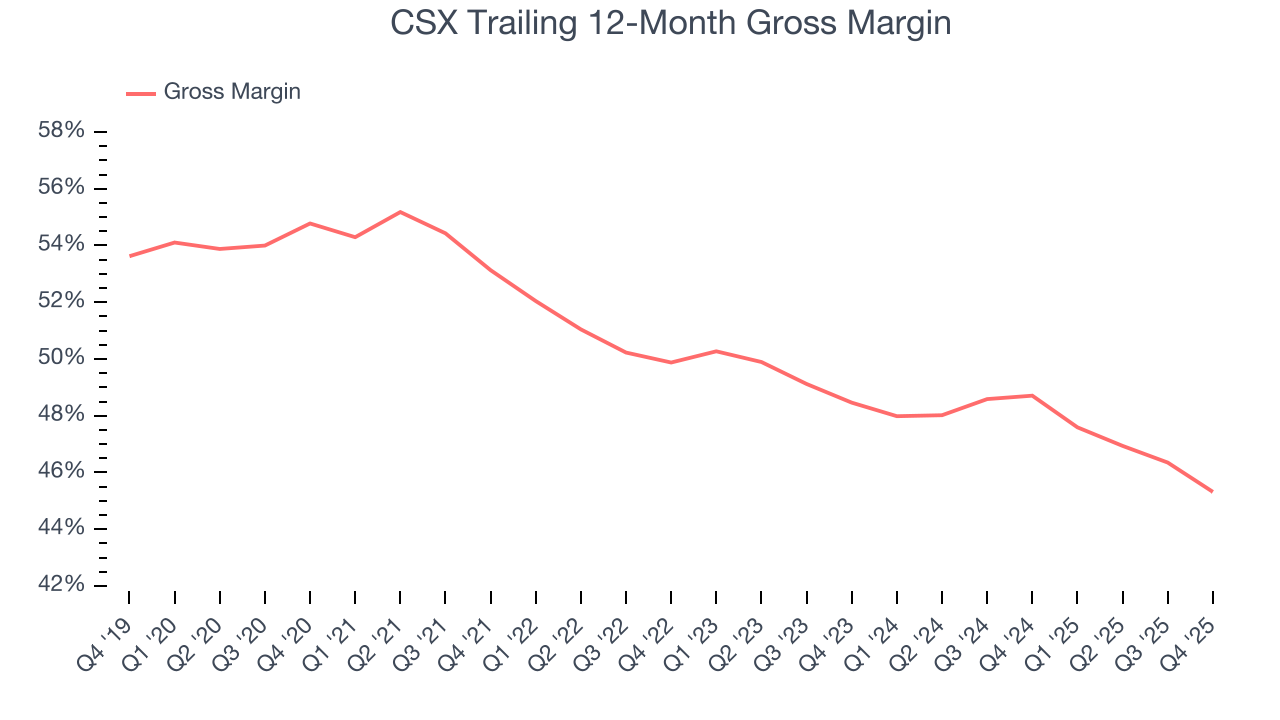
CSX produced a 43.2% gross profit margin in Q4, marking a 4.1 percentage point decrease from 47.3% in the same quarter last year. CSX’s full-year margin has also been trending down over the past 12 months, decreasing by 3.4 percentage points. If this move continues, it could suggest a more competitive environment with some pressure to lower prices and higher input costs (such as raw materials and manufacturing expenses).
7. Operating Margin
Operating margin is a key measure of profitability. Think of it as net income - the bottom line - excluding the impact of taxes and interest on debt, which are less connected to business fundamentals.
CSX has been a well-oiled machine over the last five years. It demonstrated elite profitability for an industrials business, boasting an average operating margin of 38%. This result isn’t surprising as its high gross margin gives it a favorable starting point.
Looking at the trend in its profitability, CSX’s operating margin decreased by 12.6 percentage points over the last five years. Many Rail Transportation companies also saw their margins fall (along with revenue, as mentioned above) because the cycle turned in the wrong direction. We hope CSX can emerge from this a stronger company, as the silver lining of a downturn is that market share can be won and efficiencies found.
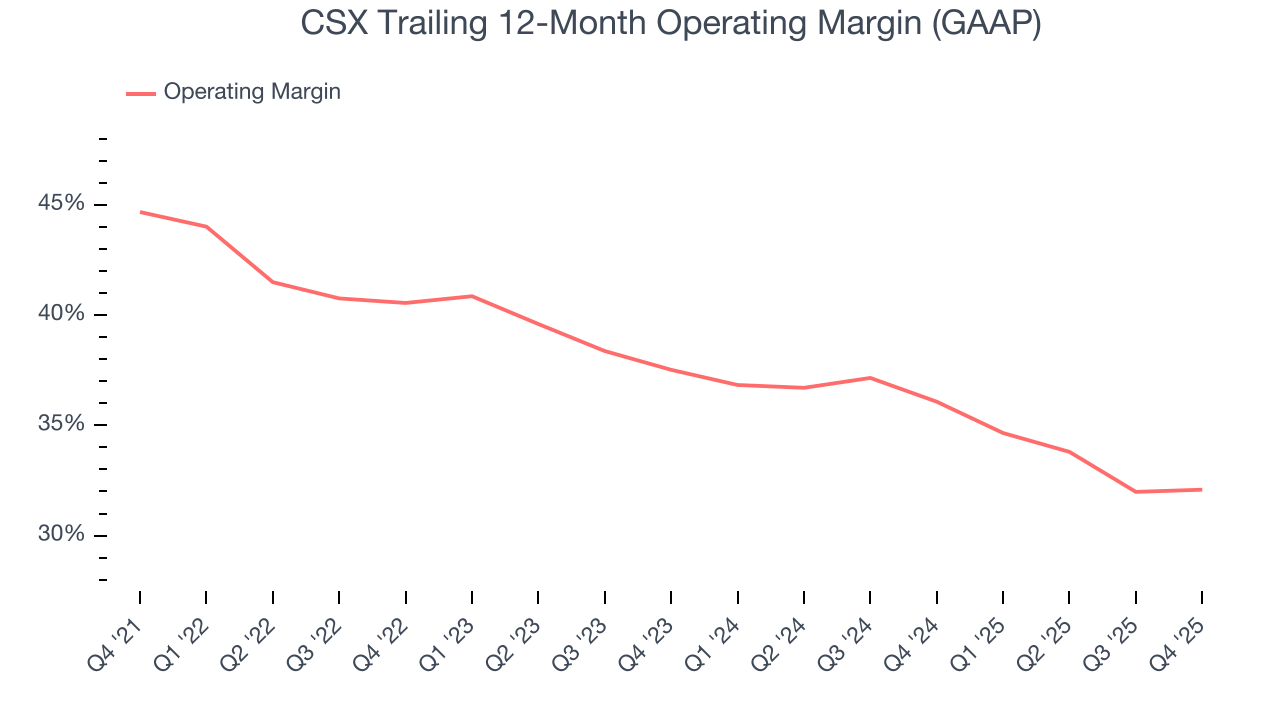
This quarter, CSX generated an operating margin profit margin of 31.6%, in line with the same quarter last year. This indicates the company’s cost structure has recently been stable.
8. Earnings Per Share
We track the long-term change in earnings per share (EPS) for the same reason as long-term revenue growth. Compared to revenue, however, EPS highlights whether a company’s growth is profitable.
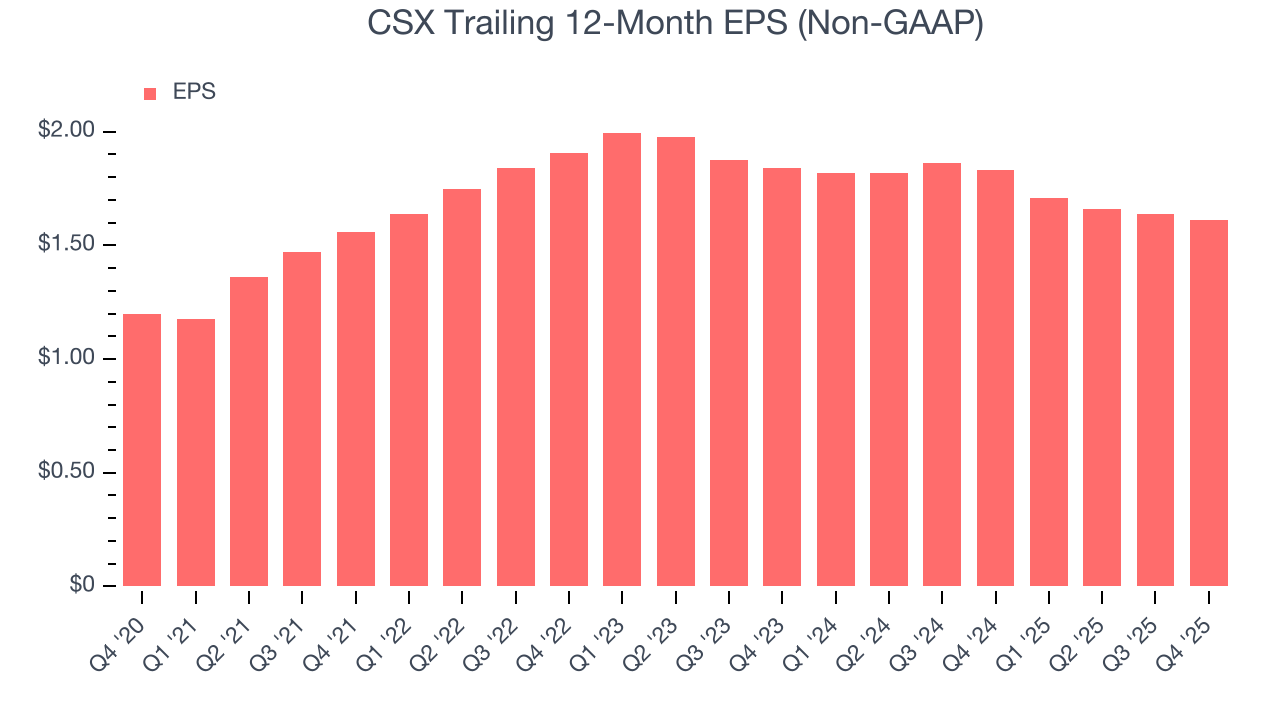
CSX’s unimpressive 6.1% annual EPS growth over the last five years aligns with its revenue performance. This tells us it maintained its per-share profitability as it expanded.
Like with revenue, we analyze EPS over a more recent period because it can provide insight into an emerging theme or development for the business.
CSX’s two-year annual EPS declines of 6.5% were bad and lower than its two-year revenue losses.
Diving into the nuances of CSX’s earnings can give us a better understanding of its performance. While we mentioned earlier that CSX’s operating margin was flat this quarter, a two-year view shows its margin has declined. This was the most relevant factor (aside from the revenue impact) behind its lower earnings; interest expenses and taxes can also affect EPS but don’t tell us as much about a company’s fundamentals.
In Q4, CSX reported adjusted EPS of $0.39, down from $0.42 in the same quarter last year. This print missed analysts’ estimates. Over the next 12 months, Wall Street expects CSX’s full-year EPS of $1.61 to grow 16.2%.
9. Cash Is King
If you’ve followed StockStory for a while, you know we emphasize free cash flow. Why, you ask? We believe that in the end, cash is king, and you can’t use accounting profits to pay the bills.
CSX has shown terrific cash profitability, putting it in an advantageous position to invest in new products, return capital to investors, and consolidate the market during industry downturns. The company’s free cash flow margin was among the best in the industrials sector, averaging 21.9% over the last five years.
Taking a step back, we can see that CSX’s margin dropped by 18.1 percentage points during that time. If its declines continue, it could signal increasing investment needs and capital intensity.
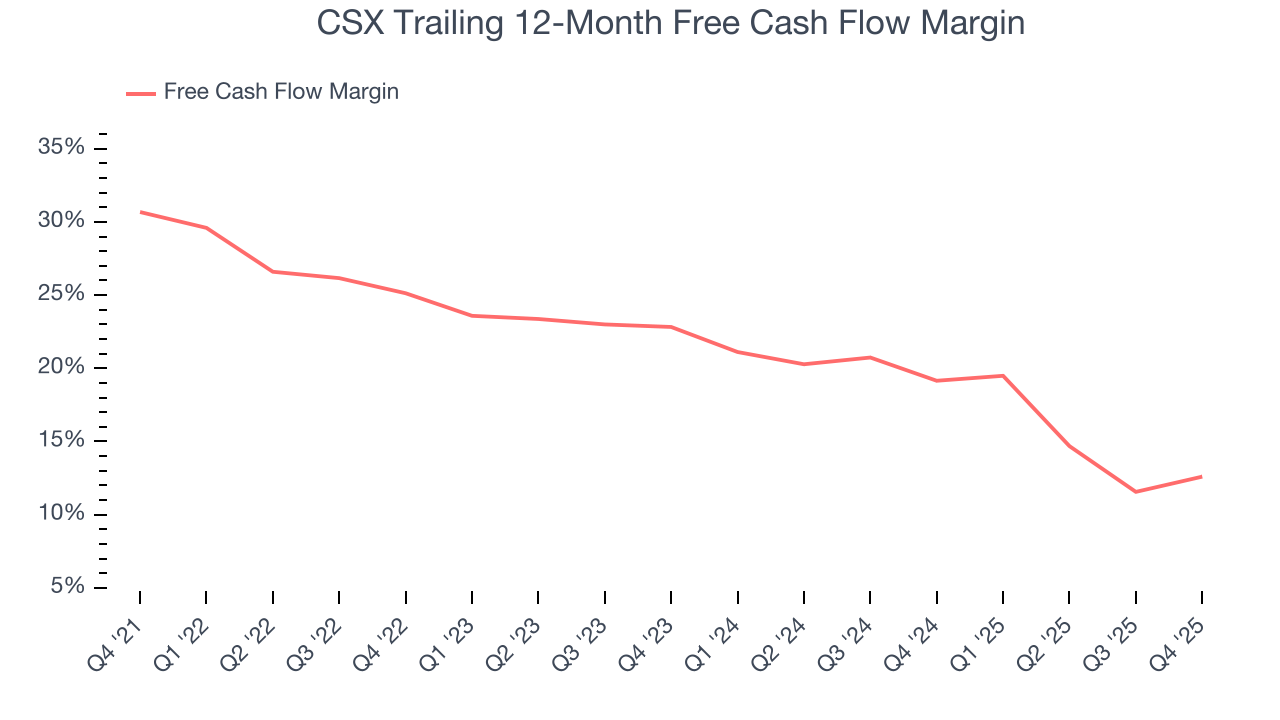
CSX’s free cash flow clocked in at $709 million in Q4, equivalent to a 20.2% margin. This result was good as its margin was 4.2 percentage points higher than in the same quarter last year, but we wouldn’t read too much into the short term because investment needs can be seasonal, leading to temporary swings. Long-term trends trump fluctuations.
10. Return on Invested Capital (ROIC)
EPS and free cash flow tell us whether a company was profitable while growing its revenue. But was it capital-efficient? Enter ROIC, a metric showing how much operating profit a company generates relative to the money it has raised (debt and equity).
Although CSX hasn’t been the highest-quality company lately, it historically found a few growth initiatives that worked out well. Its five-year average ROIC was 15.1%, impressive for an industrials business.
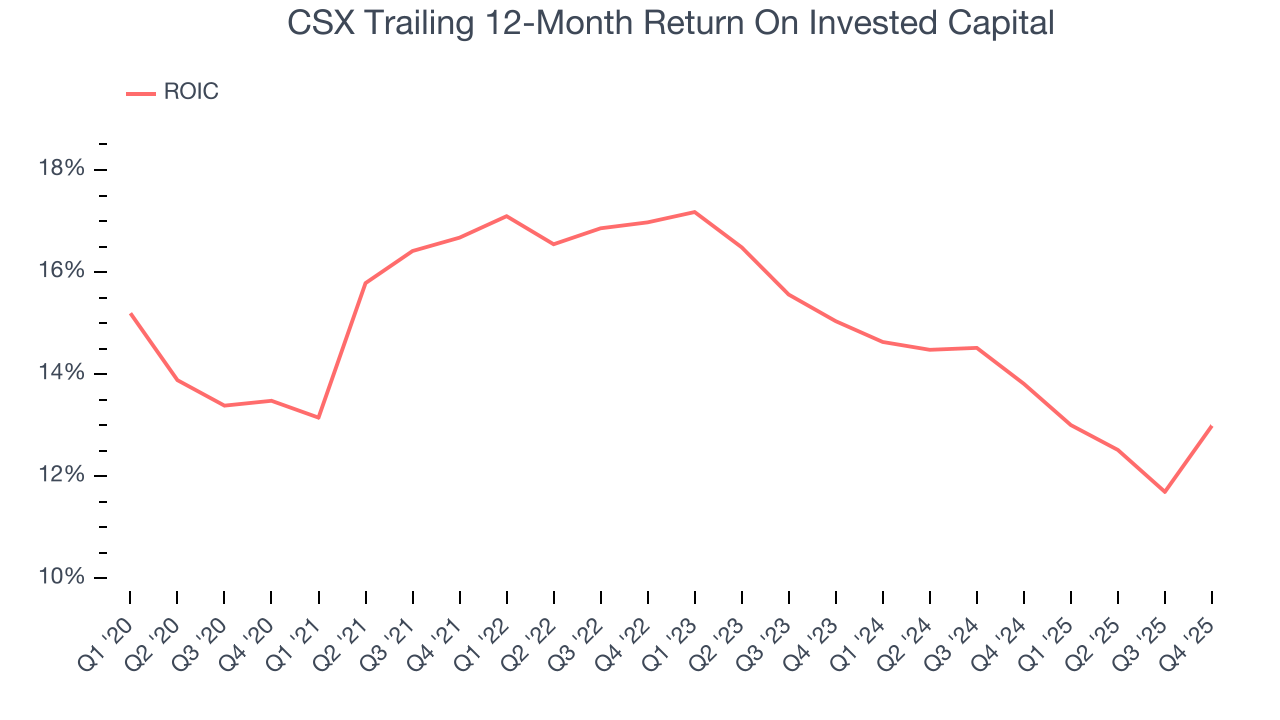
We like to invest in businesses with high returns, but the trend in a company’s ROIC is what often surprises the market and moves the stock price. Unfortunately, CSX’s ROIC averaged 3.4 percentage point decreases over the last few years. We like what management has done in the past, but its declining returns are perhaps a symptom of fewer profitable growth opportunities.
11. Balance Sheet Assessment
CSX reported $675 million of cash and $18.87 billion of debt on its balance sheet in the most recent quarter. As investors in high-quality companies, we primarily focus on two things: 1) that a company’s debt level isn’t too high and 2) that its interest payments are not excessively burdening the business.
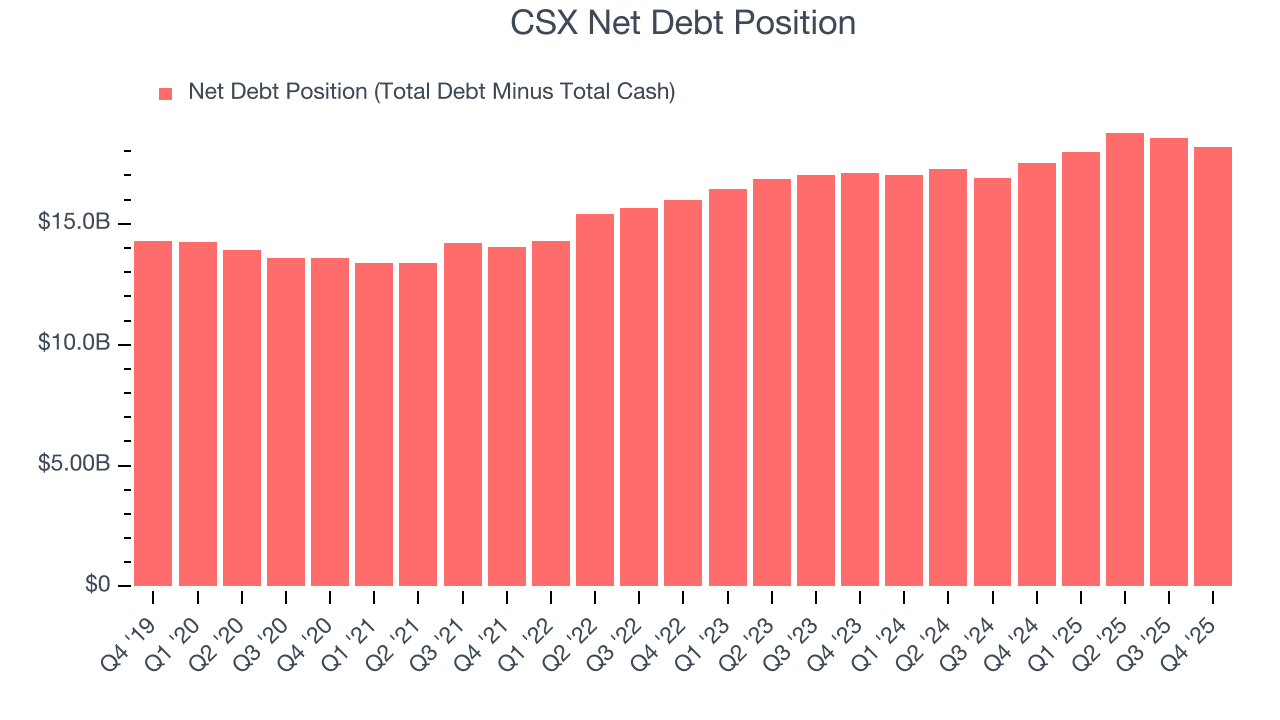
With $6.37 billion of EBITDA over the last 12 months, we view CSX’s 2.9× net-debt-to-EBITDA ratio as safe. We also see its $418 million of annual interest expenses as appropriate. The company’s profits give it plenty of breathing room, allowing it to continue investing in growth initiatives.
12. Key Takeaways from CSX’s Q4 Results
We struggled to find many positives in these results. Its EBITDA missed and its EPS fell short of Wall Street’s estimates. Overall, this was a weaker quarter. The stock traded up 4.2% to $37.51 immediately after reporting.
13. Is Now The Time To Buy CSX?
Updated: March 8, 2026 at 11:52 PM EDT
The latest quarterly earnings matters, sure, but we actually think longer-term fundamentals and valuation matter more. Investors should consider all these pieces before deciding whether or not to invest in CSX.
CSX doesn’t pass our quality test. To kick things off, its revenue growth was uninspiring over the last five years, and analysts expect its demand to deteriorate over the next 12 months. While its admirable gross margins indicate the mission-critical nature of its offerings, the downside is its declining operating margin shows the business has become less efficient. On top of that, its cash profitability fell over the last five years.
CSX’s P/E ratio based on the next 12 months is 22.3x. At this valuation, there’s a lot of good news priced in - you can find more timely opportunities elsewhere.
Wall Street analysts have a consensus one-year price target of $40.81 on the company (compared to the current share price of $40.28).