
Energy Recovery (ERII)
Energy Recovery doesn’t impress us. Its weak sales growth and declining returns on capital show its demand and profits are shrinking.― StockStory Analyst Team
1. News


2. Summary
Why Energy Recovery Is Not Exciting
Having saved far more than a trillion gallons of water, Energy Recovery (NASDAQ:ERII) provides energy recovery devices to the water treatment, oil and gas, and chemical processing sectors.
- Estimated sales decline of 11.2% for the next 12 months implies a challenging demand environment
- Sales trends were unexciting over the last five years as its 2.6% annual growth was below the typical industrials company
- On the plus side, its superior product capabilities and pricing power result in a best-in-class gross margin of 67.5%


Energy Recovery’s quality isn’t up to par. Better businesses are for sale in the market.
Why There Are Better Opportunities Than Energy Recovery


Energy Recovery is trading at $10.26 per share, or 15.5x forward P/E. Energy Recovery’s multiple may seem like a great deal among industrials peers, but we think there are valid reasons why it’s this cheap.
Cheap stocks can look like a great deal at first glance, but they can be value traps. They often have less earnings power, meaning there is more reliance on a re-rating to generate good returns - an unlikely scenario for low-quality companies.
3. Energy Recovery (ERII) Research Report: Q4 CY2025 Update
Energy recovery device manufacturer Energy Recovery (NASDAQ:ERII) missed Wall Street’s revenue expectations in Q4 CY2025, with sales flat year on year at $66.87 million. Its non-GAAP profit of $0.53 per share was 20.9% below analysts’ consensus estimates.
Energy Recovery (ERII) Q4 CY2025 Highlights:
- Revenue: $66.87 million vs analyst estimates of $82.59 million (flat year on year, 19% miss)
- Adjusted EPS: $0.53 vs analyst expectations of $0.67 (20.9% miss)
- Adjusted EBITDA: $33.6 million vs analyst estimates of $39.8 million (50.2% margin, 15.6% miss)
- Operating Margin: 46.8%, up from 41.9% in the same quarter last year
- Free Cash Flow Margin: 9.6%, down from 13.2% in the same quarter last year
- Market Capitalization: $851.3 million
Company Overview
Having saved far more than a trillion gallons of water, Energy Recovery (NASDAQ:ERII) provides energy recovery devices to the water treatment, oil and gas, and chemical processing sectors.
Energy Recovery was founded in 1992 and initially specialized in developing pressure exchangers for seawater desalination plants. Following its IPO in 2008, the company broadened its product line to include a range of pressure exchangers for desalination, wastewater treatment, and CO2 refrigeration. Today, its products are used in the water treatment, oil and gas, and chemical processing sectors.
The company's flagship product, the PX Pressure Exchanger, is widely used in seawater desalination plants to reduce energy consumption during the desalination process. Additionally, Energy Recovery offers turbochargers and pumps for oil and gas production. Turbochargers help improve the performance of gas turbines used in processing facilities while pumps are utilized for fluid transfer, injection, and circulation within production systems.
Energy Recovery primarily sells its products to original equipment manufacturers (OEMs) and engineering, procurement, and construction (EPC) firms. Specifically, the company engages in long-term supply agreements with these partners and also offers aftermarket services for its products. These aftermarket services include spare parts, repair services, field services, and various commissioning activities, helping plant owners optimize and upgrade their existing installations while creating a recurring revenue source for the company. Offered alongside these long-term supply agreements are volume discounts to incentivize larger orders and foster stronger partnerships.
4. Water Infrastructure
Trends towards conservation and reducing groundwater depletion are putting water infrastructure and treatment products front and center. Companies that can innovate and create solutions–especially automated or connected solutions–to address these thematic trends will create incremental demand and speed up replacement cycles. On the other hand, water infrastructure and treatment companies are at the whim of economic cycles. Consumer spending and interest rates, for example, can greatly impact the industrial production that drives demand for these companies’ offerings.
Competitors offering similar products include Dupont (NYSE:DD), Pentair (NYSE:PNR), and Xylem (NYSE:XYL).
5. Revenue Growth
A company’s long-term performance is an indicator of its overall quality. Any business can have short-term success, but a top-tier one grows for years. Over the last five years, Energy Recovery grew its sales at a sluggish 2.6% compounded annual growth rate. This wasn’t a great result, but there are still things to like about Energy Recovery.
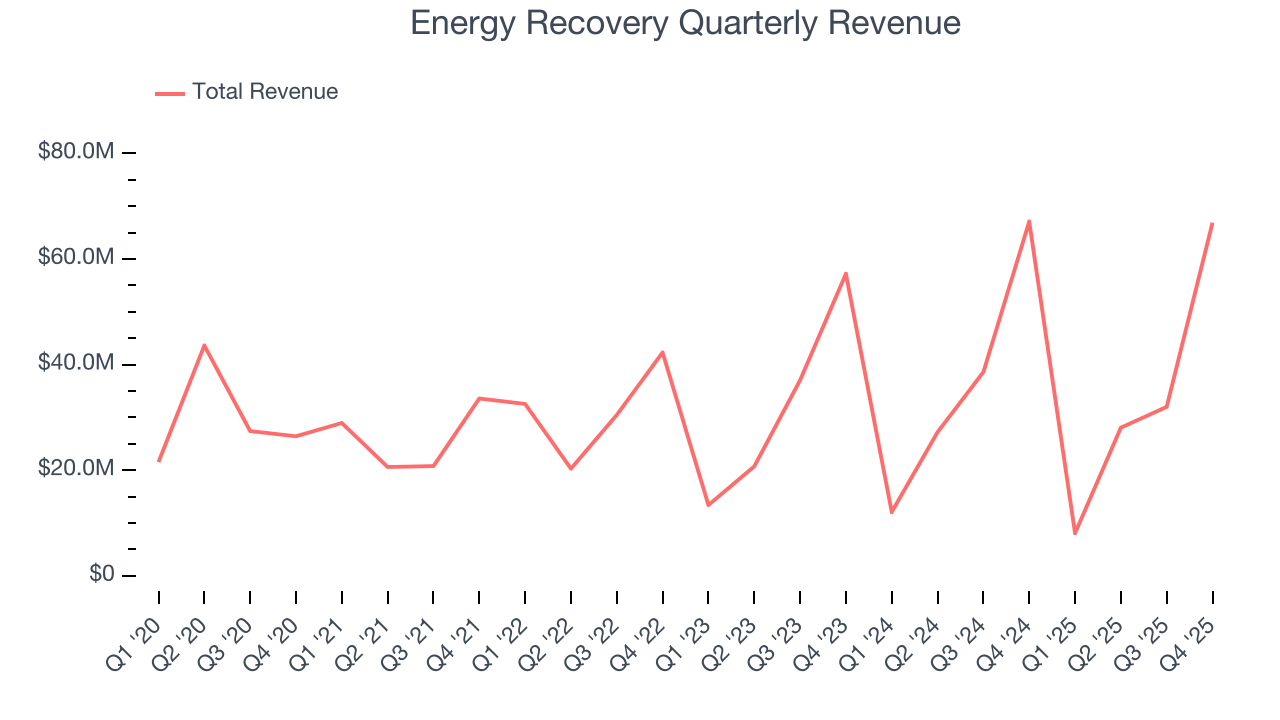
We at StockStory place the most emphasis on long-term growth, but within industrials, a half-decade historical view may miss cycles, industry trends, or a company capitalizing on catalysts such as a new contract win or a successful product line. Energy Recovery’s annualized revenue growth of 2.6% over the last two years aligns with its five-year trend, suggesting its demand was consistently weak. 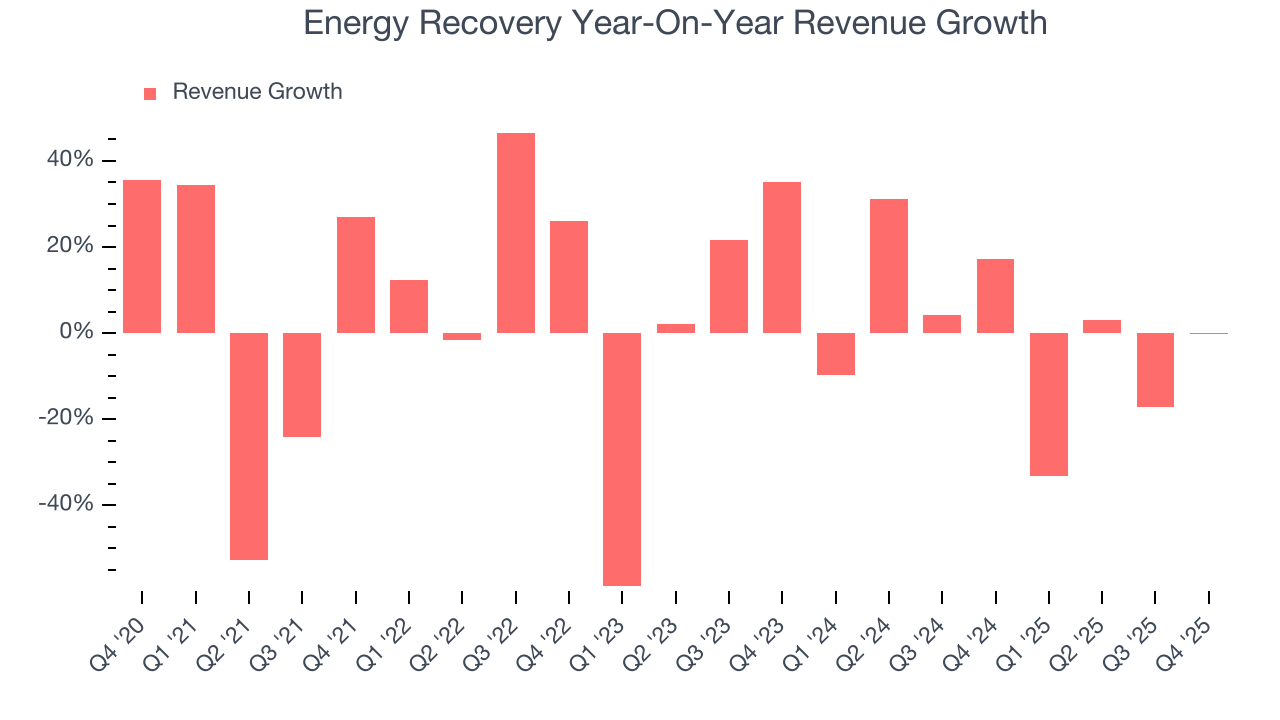
This quarter, Energy Recovery missed Wall Street’s estimates and reported a rather uninspiring 0.3% year-on-year revenue decline, generating $66.87 million of revenue.
Looking ahead, sell-side analysts expect revenue to grow 17% over the next 12 months, an improvement versus the last two years. This projection is eye-popping and indicates its newer products and services will catalyze better top-line performance.
6. Gross Margin & Pricing Power
At StockStory, we prefer high gross margin businesses because they indicate the company has pricing power or differentiated products, giving it a chance to generate higher operating profits.
Energy Recovery has best-in-class unit economics for an industrials company, enabling it to invest in areas such as research and development. Its margin also signals it sells differentiated products, not commodities. As you can see below, it averaged an elite 67.5% gross margin over the last five years. Said differently, roughly $67.51 was left to spend on selling, marketing, R&D, and general administrative overhead for every $100 in revenue. 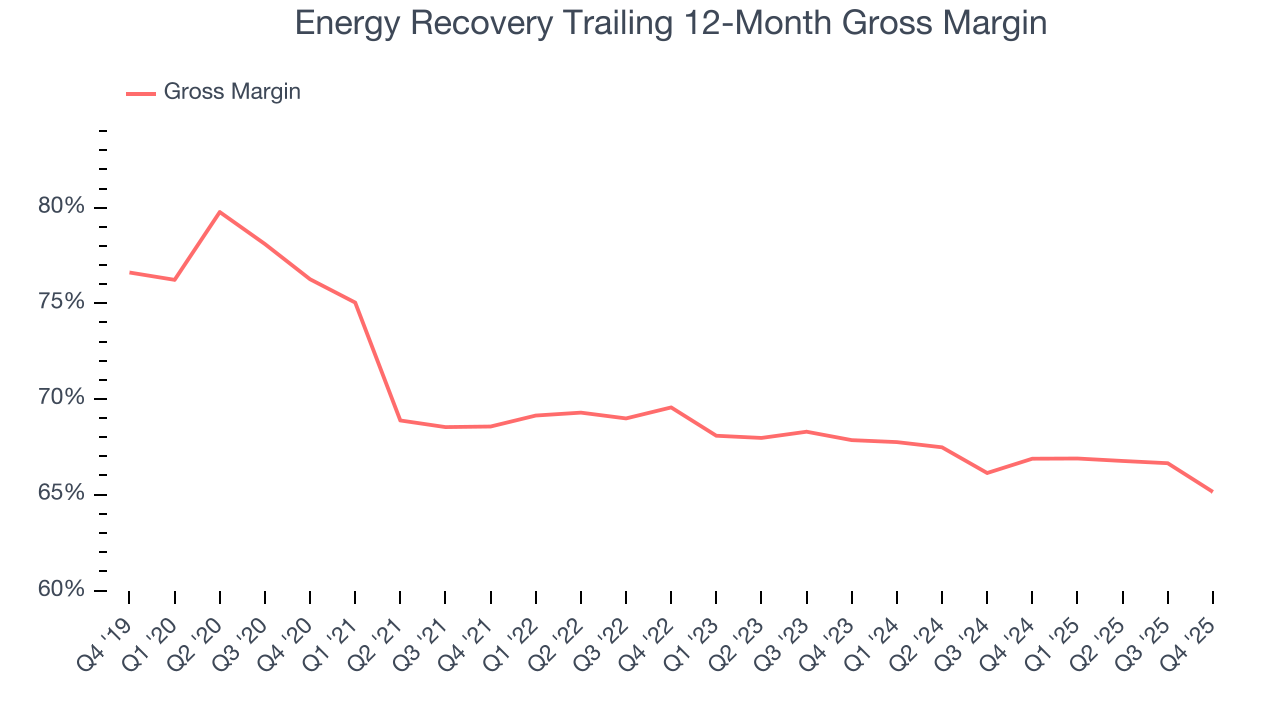
This quarter, Energy Recovery’s gross profit margin was 67.2%, down 3 percentage points year on year. Energy Recovery’s full-year margin has also been trending down over the past 12 months, decreasing by 1.7 percentage points. If this move continues, it could suggest a more competitive environment with some pressure to lower prices and higher input costs (such as raw materials and manufacturing expenses).
7. Operating Margin
Operating margin is an important measure of profitability as it shows the portion of revenue left after accounting for all core expenses – everything from the cost of goods sold to advertising and wages. It’s also useful for comparing profitability across companies with different levels of debt and tax rates because it excludes interest and taxes.
Energy Recovery has been a well-oiled machine over the last five years. It demonstrated elite profitability for an industrials business, boasting an average operating margin of 16.4%. This result isn’t surprising as its high gross margin gives it a favorable starting point.
Analyzing the trend in its profitability, Energy Recovery’s operating margin rose by 4.8 percentage points over the last five years, as its sales growth gave it operating leverage.
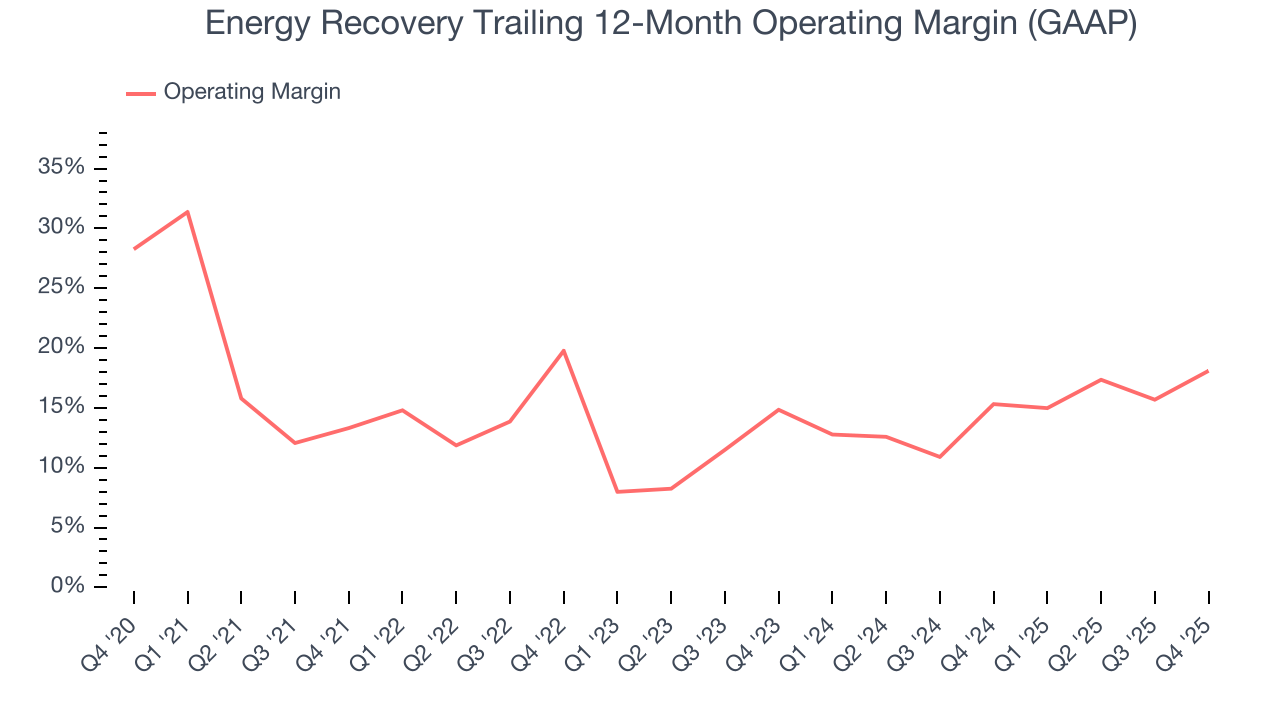
This quarter, Energy Recovery generated an operating margin profit margin of 46.8%, up 4.9 percentage points year on year. The increase was encouraging, and because its gross margin actually decreased, we can assume it was more efficient because its operating expenses like marketing, R&D, and administrative overhead grew slower than its revenue.
8. Earnings Per Share
Revenue trends explain a company’s historical growth, but the long-term change in earnings per share (EPS) points to the profitability of that growth – for example, a company could inflate its sales through excessive spending on advertising and promotions.
Energy Recovery’s weak 2.9% annual EPS growth over the last five years aligns with its revenue performance. On the bright side, this tells us its incremental sales were profitable.
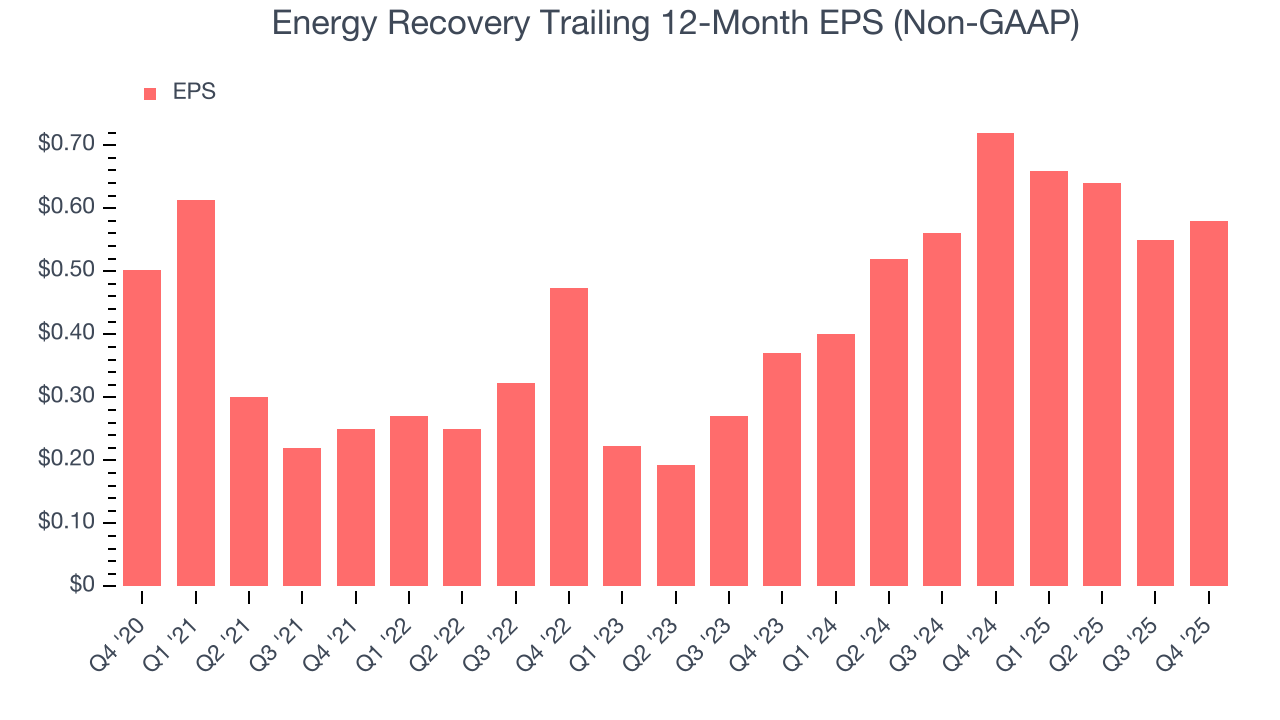
Like with revenue, we analyze EPS over a more recent period because it can provide insight into an emerging theme or development for the business.
Energy Recovery’s two-year annual EPS growth of 25.1% was fantastic and topped its 2.6% two-year revenue growth.
We can take a deeper look into Energy Recovery’s earnings quality to better understand the drivers of its performance. Energy Recovery’s operating margin has expanded over the last two yearswhile its share count has shrunk 7.5%. Improving profitability and share buybacks are positive signs for shareholders as they juice EPS growth relative to revenue growth. 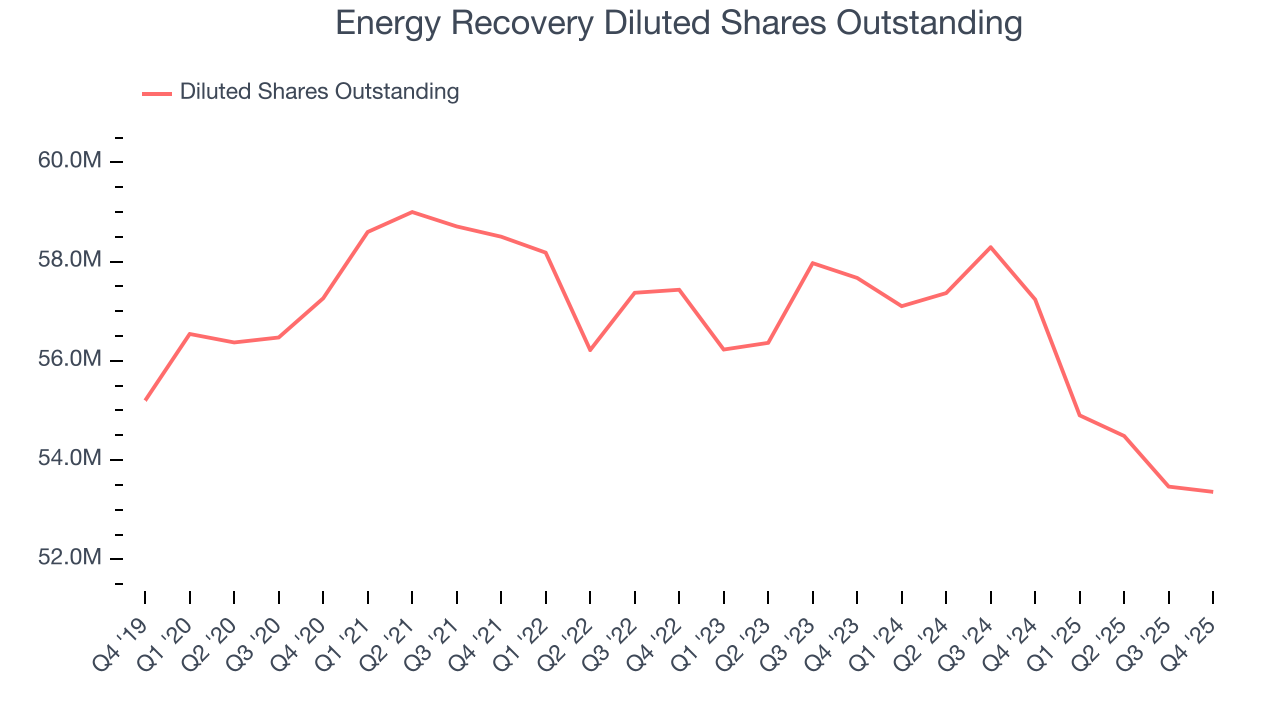
In Q4, Energy Recovery reported adjusted EPS of $0.53, up from $0.50 in the same quarter last year. Despite growing year on year, this print missed analysts’ estimates. Over the next 12 months, Wall Street expects Energy Recovery’s full-year EPS of $0.58 to grow 51.9%.
9. Cash Is King
Although earnings are undoubtedly valuable for assessing company performance, we believe cash is king because you can’t use accounting profits to pay the bills.
Energy Recovery has shown robust cash profitability, enabling it to comfortably ride out cyclical downturns while investing in plenty of new offerings and returning capital to investors. The company’s free cash flow margin averaged 11.8% over the last five years, quite impressive for an industrials business.
Taking a step back, we can see that Energy Recovery’s margin expanded by 6.3 percentage points during that time. This is encouraging, and we can see it became a less capital-intensive business because its free cash flow profitability rose more than its operating profitability.
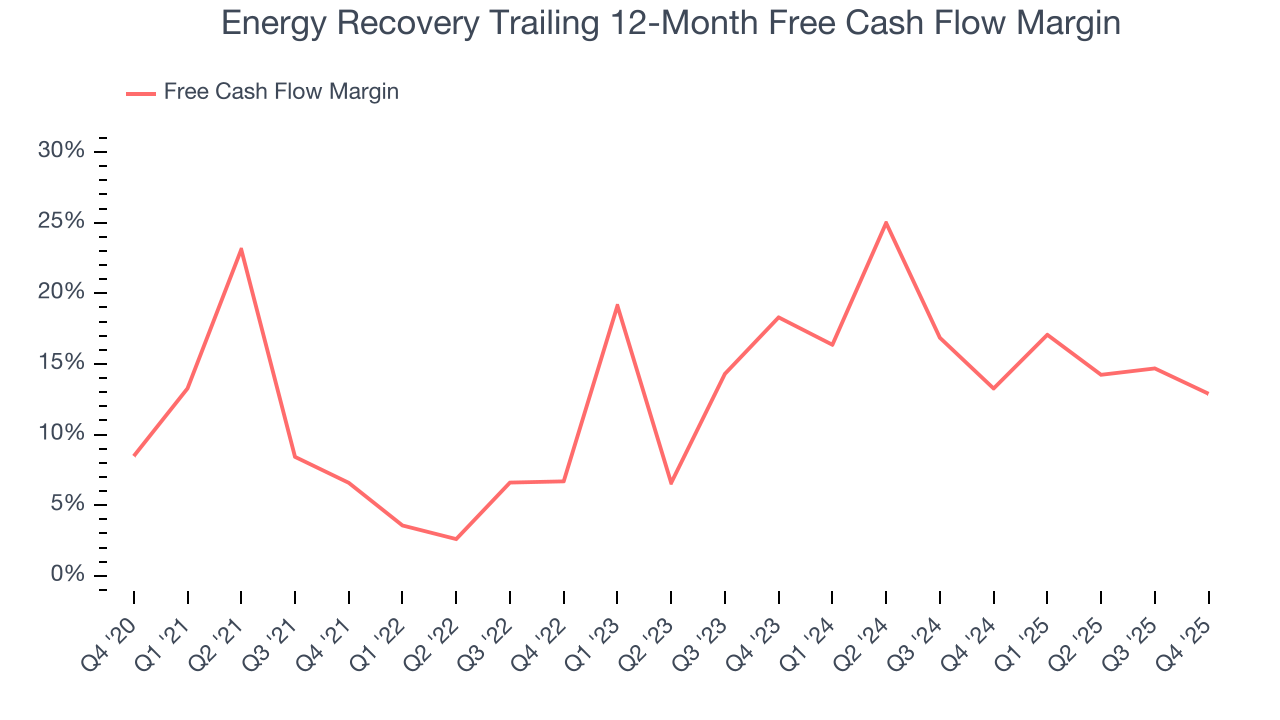
Energy Recovery’s free cash flow clocked in at $6.4 million in Q4, equivalent to a 9.6% margin. The company’s cash profitability regressed as it was 3.6 percentage points lower than in the same quarter last year, but we wouldn’t read too much into it because capital expenditures can be seasonal and companies often stockpile inventory in anticipation of higher demand, causing quarter-to-quarter swings. Long-term trends trump fluctuations.
10. Return on Invested Capital (ROIC)
EPS and free cash flow tell us whether a company was profitable while growing its revenue. But was it capital-efficient? Enter ROIC, a metric showing how much operating profit a company generates relative to the money it has raised (debt and equity).
Energy Recovery’s five-year average ROIC was 19.1%, placing it among the best industrials companies. This illustrates its management team’s ability to invest in highly profitable ventures and produce tangible results for shareholders.
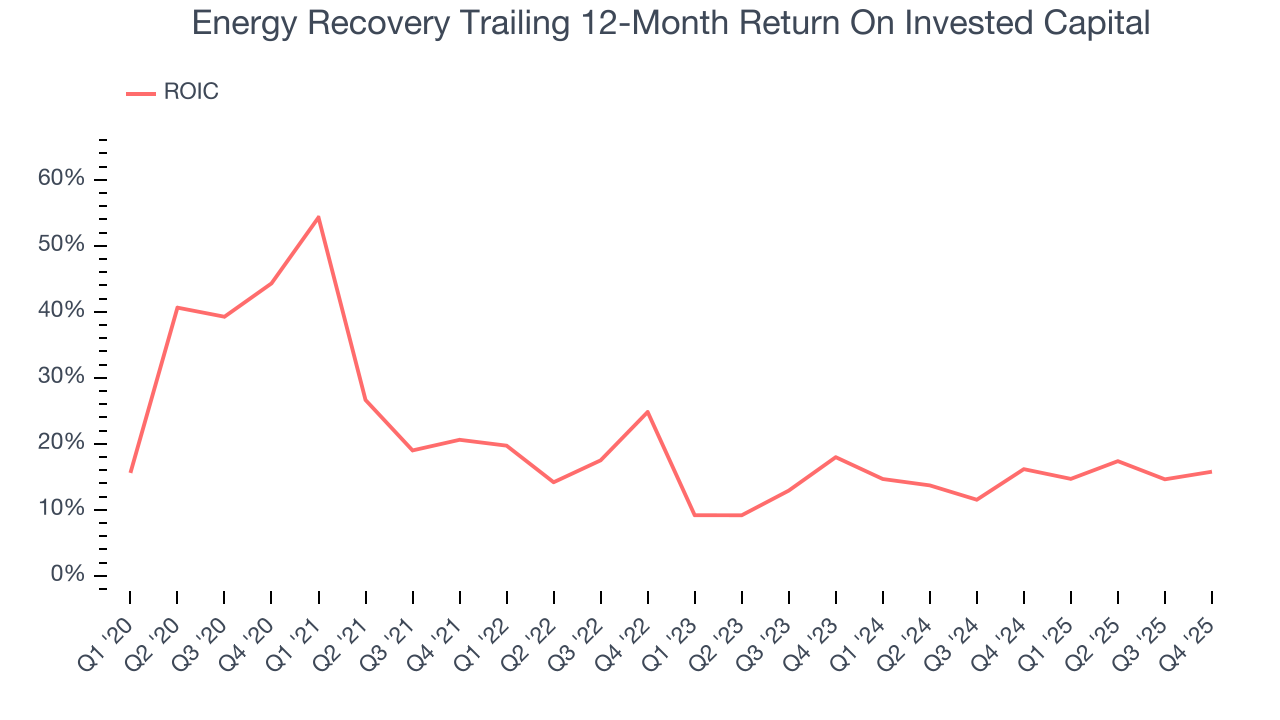
We like to invest in businesses with high returns, but the trend in a company’s ROIC is what often surprises the market and moves the stock price. Over the last few years, Energy Recovery’s ROIC has unfortunately decreased. Only time will tell if its new bets can bear fruit and potentially reverse the trend.
11. Balance Sheet Assessment
One of the best ways to mitigate bankruptcy risk is to hold more cash than debt.
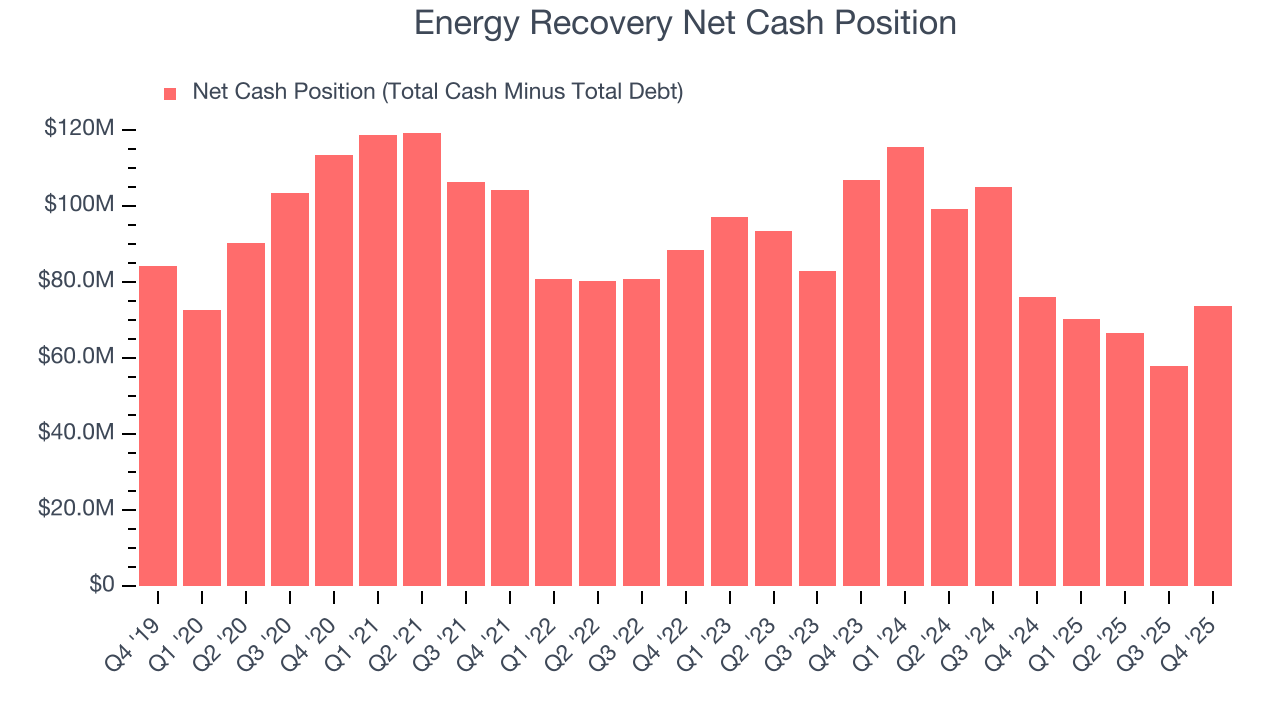
Energy Recovery is a profitable, well-capitalized company with $83.28 million of cash and $9.43 million of debt on its balance sheet. This $73.85 million net cash position is 8.7% of its market cap and gives it the freedom to borrow money, return capital to shareholders, or invest in growth initiatives. Leverage is not an issue here.
12. Key Takeaways from Energy Recovery’s Q4 Results
We struggled to find many positives in these results. Its revenue missed and its EBITDA fell short of Wall Street’s estimates. Overall, this quarter could have been better. The stock traded down 18.7% to $13.11 immediately following the results.
13. Is Now The Time To Buy Energy Recovery?
Updated: March 16, 2026 at 11:04 PM EDT
Before investing in or passing on Energy Recovery, we urge you to understand the company’s business quality (or lack thereof), valuation, and the latest quarterly results - in that order.
Energy Recovery isn’t a bad business, but we’re not clamoring to buy it here and now. Although its revenue growth was weak over the last five years and analysts expect growth to slow over the next 12 months, its admirable gross margins indicate the mission-critical nature of its offerings. We advise investors to be cautious with this one, however, as its diminishing returns show management's prior bets haven't worked out.
Energy Recovery’s P/E ratio based on the next 12 months is 15.5x. While this valuation is reasonable, we don’t really see a big opportunity at the moment. We're fairly confident there are better investments elsewhere.
Wall Street analysts have a consensus one-year price target of $14 on the company (compared to the current share price of $10.26).