JFrog (FROG)
We love companies like JFrog. Its financials show it’s a customer acquisition machine that can expand both quickly and organically.― StockStory Analyst Team
1. News
2. Summary
Why We Like JFrog
Named after the amphibian that continuously evolves from egg to tadpole to adult, JFrog (NASDAQ:FROG) provides a platform that helps organizations securely create, store, manage, and distribute software packages across any system.
- ARR growth averaged 23.6% over the last year, showing customers are willing to take multi-year bets on its software
- Impressive 23.3% annual revenue growth over the last two years indicates it’s winning market share
- Impressive free cash flow profitability enables the company to fund new investments or reward investors with share buybacks/dividends


We’re fond of companies like JFrog. The valuation looks fair when considering its quality, so this could be an opportune time to invest in some shares.
Why Is Now The Time To Buy JFrog?


At $43.66 per share, JFrog trades at 8.2x forward price-to-sales. Most companies in the software sector may feature a cheaper multiple, but we think JFrog is priced fairly given its fundamentals.
By definition, where you buy a stock impacts returns. But according to our work on the topic, business quality is a much bigger determinant of market outperformance over the long term compared to entry price.
3. JFrog (FROG) Research Report: Q4 CY2025 Update
Software supply chain platform JFrog (NASDAQ:FROG) reported Q4 CY2025 results topping the market’s revenue expectations, with sales up 25.2% year on year to $145.3 million. Guidance for next quarter’s revenue was optimistic at $147 million at the midpoint, 2.4% above analysts’ estimates. Its non-GAAP profit of $0.22 per share was 16.2% above analysts’ consensus estimates.
JFrog (FROG) Q4 CY2025 Highlights:
- Revenue: $145.3 million vs analyst estimates of $138.1 million (25.2% year-on-year growth, 5.2% beat)
- Adjusted EPS: $0.22 vs analyst estimates of $0.19 (16.2% beat)
- Adjusted Operating Income: $25.75 million vs analyst estimates of $21.82 million (17.7% margin, 18% beat)
- Revenue Guidance for Q1 CY2026 is $147 million at the midpoint, above analyst estimates of $143.6 million
- Adjusted EPS guidance for the upcoming financial year 2026 is $0.90 at the midpoint, beating analyst estimates by 1.8%
- Operating Margin: -14.7%, up from -21.9% in the same quarter last year
- Free Cash Flow Margin: 34.3%, up from 21% in the previous quarter
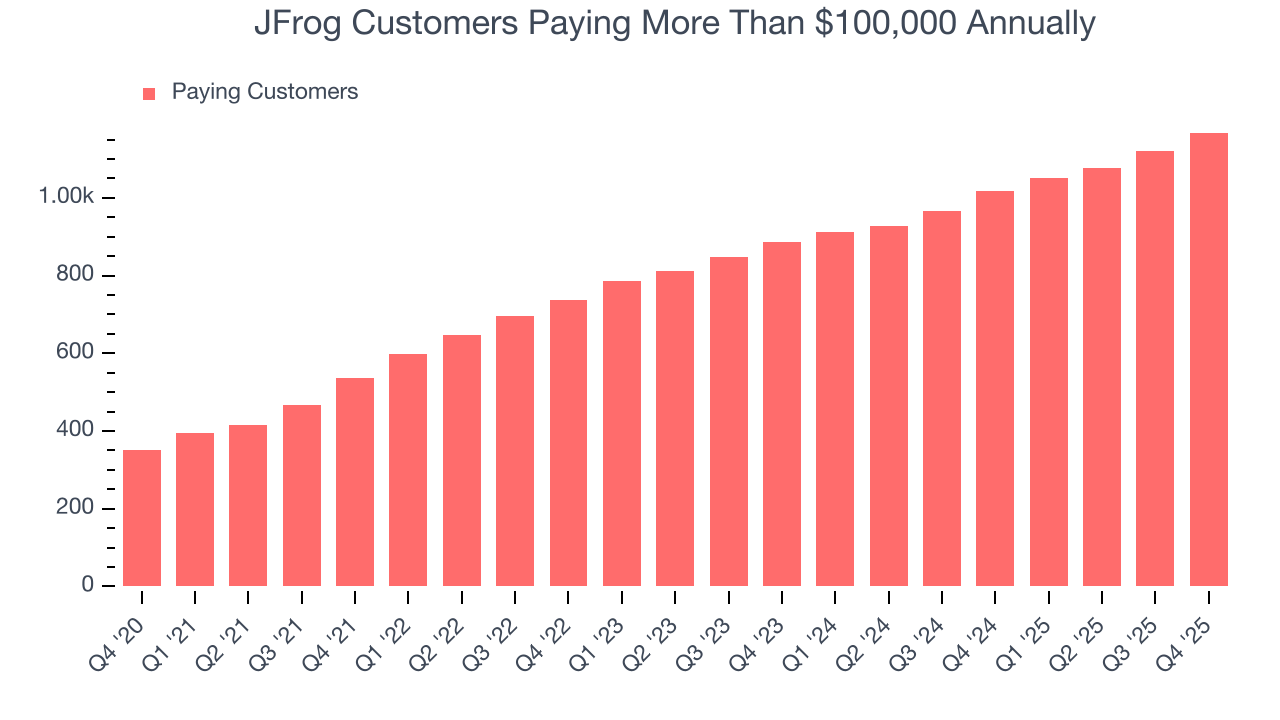
- Customers: 1,168 customers paying more than $100,000 annually
- Net Revenue Retention Rate: 119%, up from 118% in the previous quarter
- Billings: $178.5 million at quarter end, up 22.2% year on year
- Market Capitalization: $6.15 billion
Company Overview
Named after the amphibian that continuously evolves from egg to tadpole to adult, JFrog (NASDAQ:FROG) provides a platform that helps organizations securely create, store, manage, and distribute software packages across any system.
JFrog's platform serves as the critical bridge between software development and deployment, acting as the "database of DevOps" where all software packages are stored, scanned, and managed. At its core is JFrog Artifactory, a universal package repository that functions as a single source of truth for an organization's software components. The platform understands dependencies between packages, ensuring that deployed software is always current and secure.
Beyond Artifactory, JFrog offers a suite of integrated products that cover the entire software supply chain. JFrog Xray scans for vulnerabilities and compliance issues, while JFrog Advanced Security provides deeper binary-level security analysis. JFrog Distribution handles reliable package distribution to multiple locations, and JFrog Artifactory Edge enables efficient updates at runtime environments. The platform also includes tools for pipeline automation, device management, and DevOps intelligence.
Companies typically begin with free trials or open-source versions before upgrading to paid tiers that include more functionality. JFrog's multi-tiered subscription model ranges from JFrog Pro for basic needs to JFrog Enterprise Plus for organizations requiring the full platform capabilities. This approach has helped JFrog build a diverse customer base across industries, with organizations relying on its technology to continuously deliver secure software updates.
4. Developer Operations
As Marc Andreessen says, "software is eating the world" which means the volume of software produced is exploding. But building software is complex and difficult work which drives demand for software tools that help increase the speed, quality, and security of software deployment.
JFrog competes with GitHub Actions (Microsoft), GitLab CI/CD (NASDAQ: GTLB), Sonatype Nexus, Docker Hub, Snyk, and Atlassian's Bitbucket Pipelines (NASDAQ: TEAM), as well as cloud provider offerings like AWS CodeArtifact and Google Artifact Registry.
5. Revenue Growth
Examining a company’s long-term performance can provide clues about its quality. Any business can put up a good quarter or two, but the best consistently grow over the long haul. Luckily, JFrog’s sales grew at an impressive 28.7% compounded annual growth rate over the last five years. Its growth surpassed the average software company and shows its offerings resonate with customers, a great starting point for our analysis.
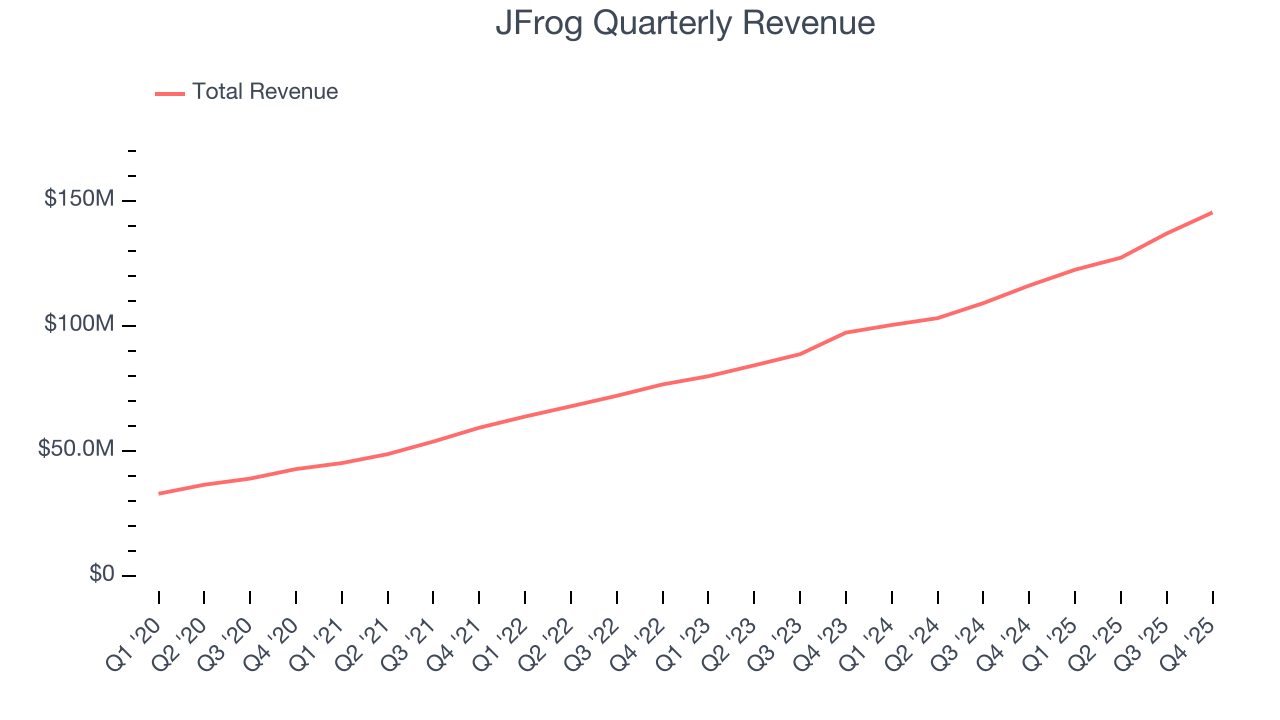
We at StockStory place the most emphasis on long-term growth, but within software, a half-decade historical view may miss recent innovations or disruptive industry trends. JFrog’s annualized revenue growth of 23.3% over the last two years is below its five-year trend, but we still think the results suggest healthy demand. 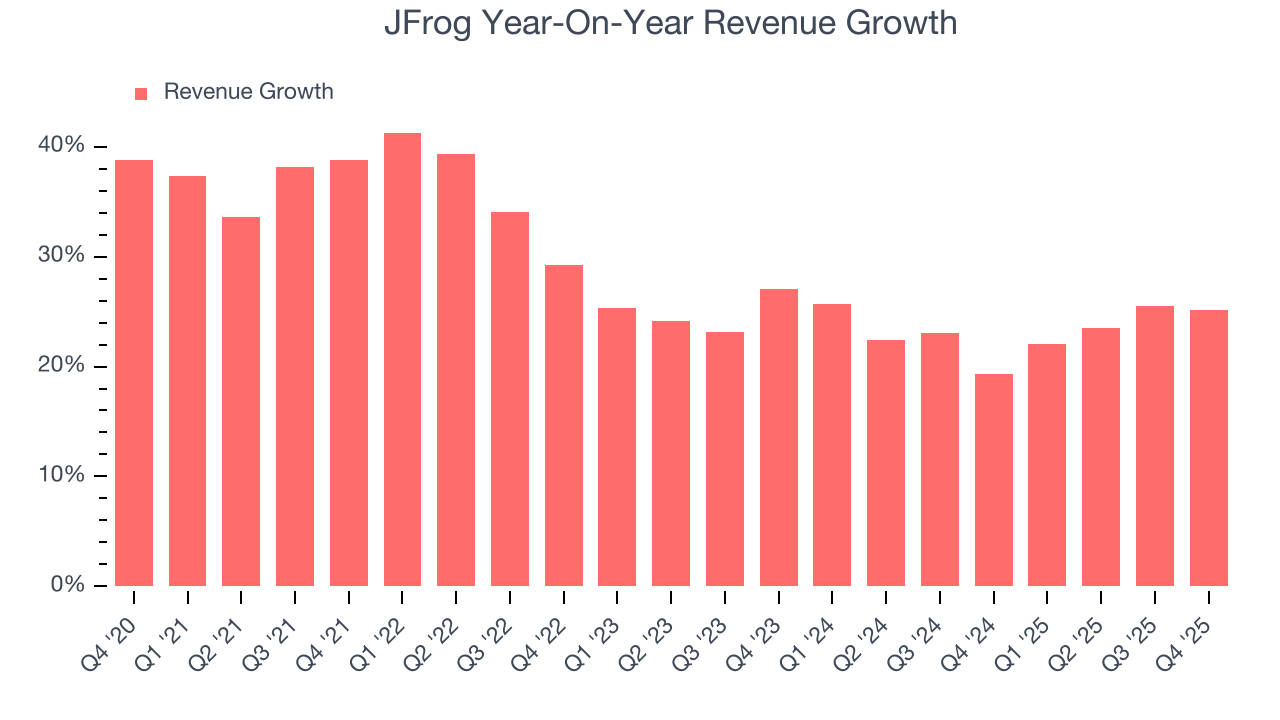
This quarter, JFrog reported robust year-on-year revenue growth of 25.2%, and its $145.3 million of revenue topped Wall Street estimates by 5.2%. Company management is currently guiding for a 20.1% year-on-year increase in sales next quarter.
Looking further ahead, sell-side analysts expect revenue to grow 15% over the next 12 months, a deceleration versus the last two years. Despite the slowdown, this projection is above average for the sector and implies the market sees some success for its newer products and services.
6. Billings
Billings is a non-GAAP metric that is often called “cash revenue” because it shows how much money the company has collected from customers in a certain period. This is different from revenue, which must be recognized in pieces over the length of a contract.
JFrog’s billings punched in at $178.5 million in Q4, and over the last four quarters, its growth was impressive as it averaged 22.8% year-on-year increases. This performance aligned with its total sales growth, indicating robust customer demand. The high level of cash collected from customers also enhances liquidity and provides a solid foundation for future investments and growth. 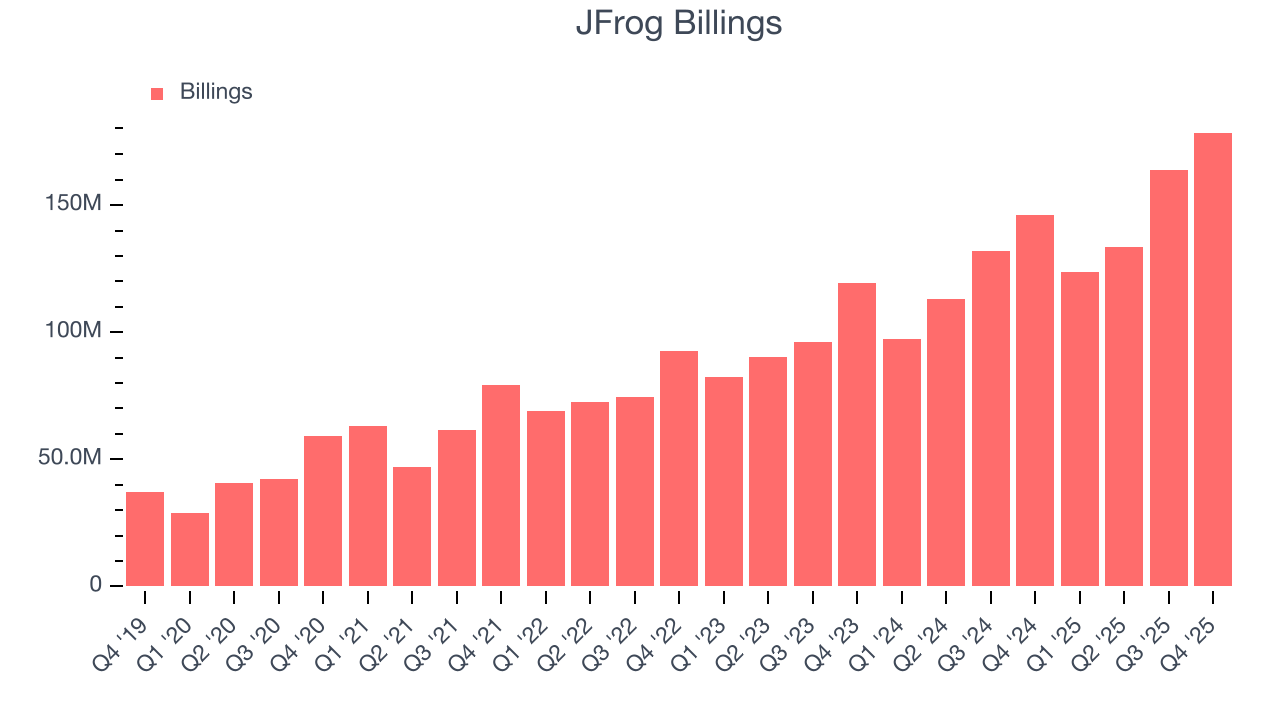
7. Enterprise Customer Base
This quarter, JFrog reported 1,168 enterprise customers paying more than $100,000 annually, an increase of 47 from the previous quarter. That’s in line with the number of contract wins in the last quarter and quite a bit above what we’ve seen over the previous year, confirming that the company is maintaining its sales momentum.
8. Customer Acquisition Efficiency
The customer acquisition cost (CAC) payback period measures the months a company needs to recoup the money spent on acquiring a new customer. This metric helps assess how quickly a business can break even on its sales and marketing investments.
JFrog is quite efficient at acquiring new customers, and its CAC payback period checked in at 30.3 months this quarter. The company’s rapid recovery of its customer acquisition costs indicates it has a strong brand reputation, giving it more resources pursue new product initiatives while maintaining the flexibility to increase its sales and marketing investments. 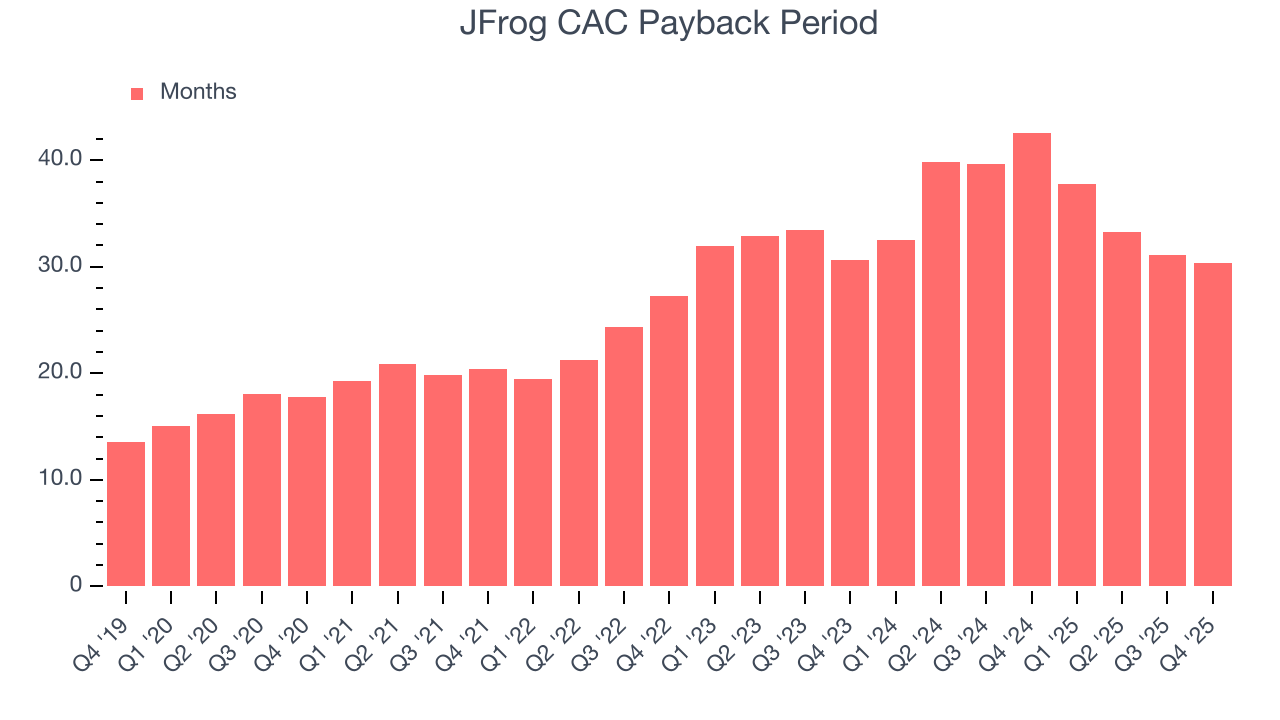
9. Customer Retention
One of the best parts about the software-as-a-service business model (and a reason why they trade at high valuation multiples) is that customers typically spend more on a company’s products and services over time.
JFrog’s net revenue retention rate, a key performance metric measuring how much money existing customers from a year ago are spending today, was 118% in Q4. This means JFrog would’ve grown its revenue by 17.8% even if it didn’t win any new customers over the last 12 months.
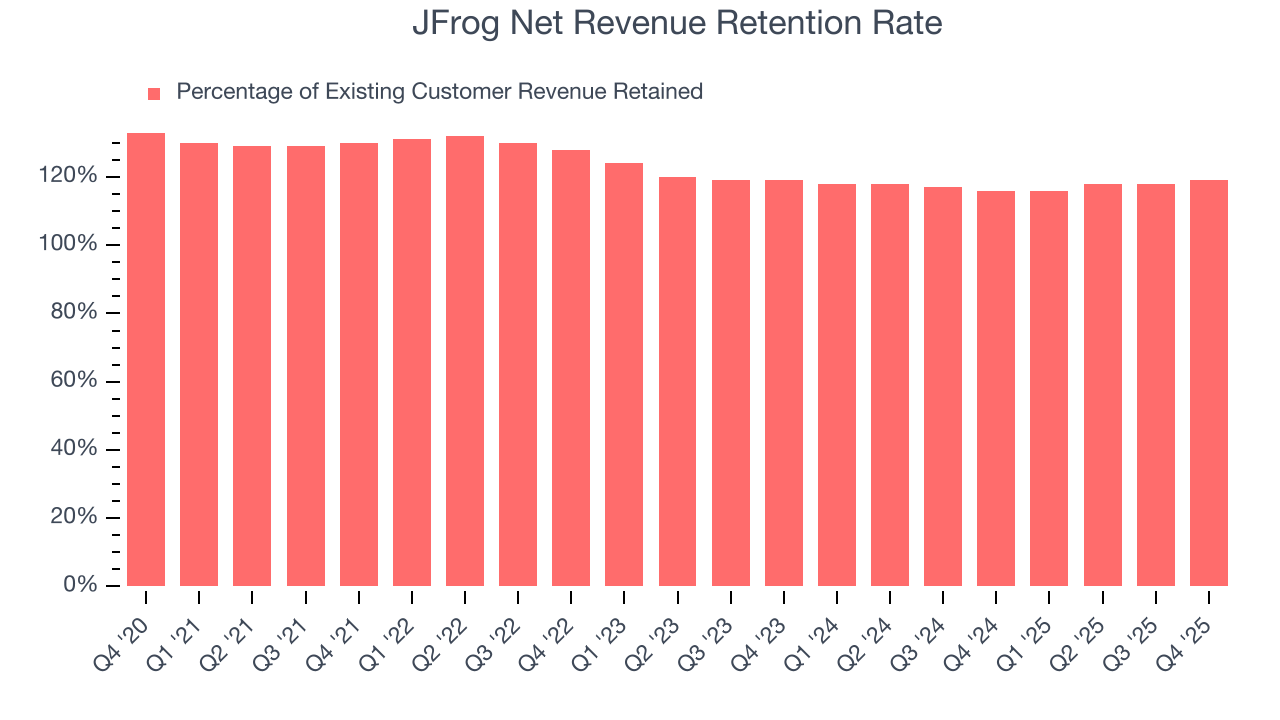
Trending up over the last year, JFrog has a good net retention rate, proving that customers are satisfied with its software and getting more value from it over time, which is always great to see.
10. Gross Margin & Pricing Power
Software is eating the world. It’s one of our favorite business models because once you develop the product, it usually doesn’t cost much to provide it as an ongoing service. These minimal costs can include servers, licenses, and certain personnel.
JFrog’s gross margin is good for a software business and points to its solid unit economics, competitive products and services, and lack of meaningful pricing pressure. As you can see below, it averaged an impressive 76.8% gross margin over the last year. That means for every $100 in revenue, roughly $76.79 was left to spend on selling, marketing, and R&D.
The market not only cares about gross margin levels but also how they change over time because expansion creates firepower for profitability and free cash generation. JFrog has seen gross margins decline by 1.2 percentage points over the last 2 year, which is poor compared to software peers.
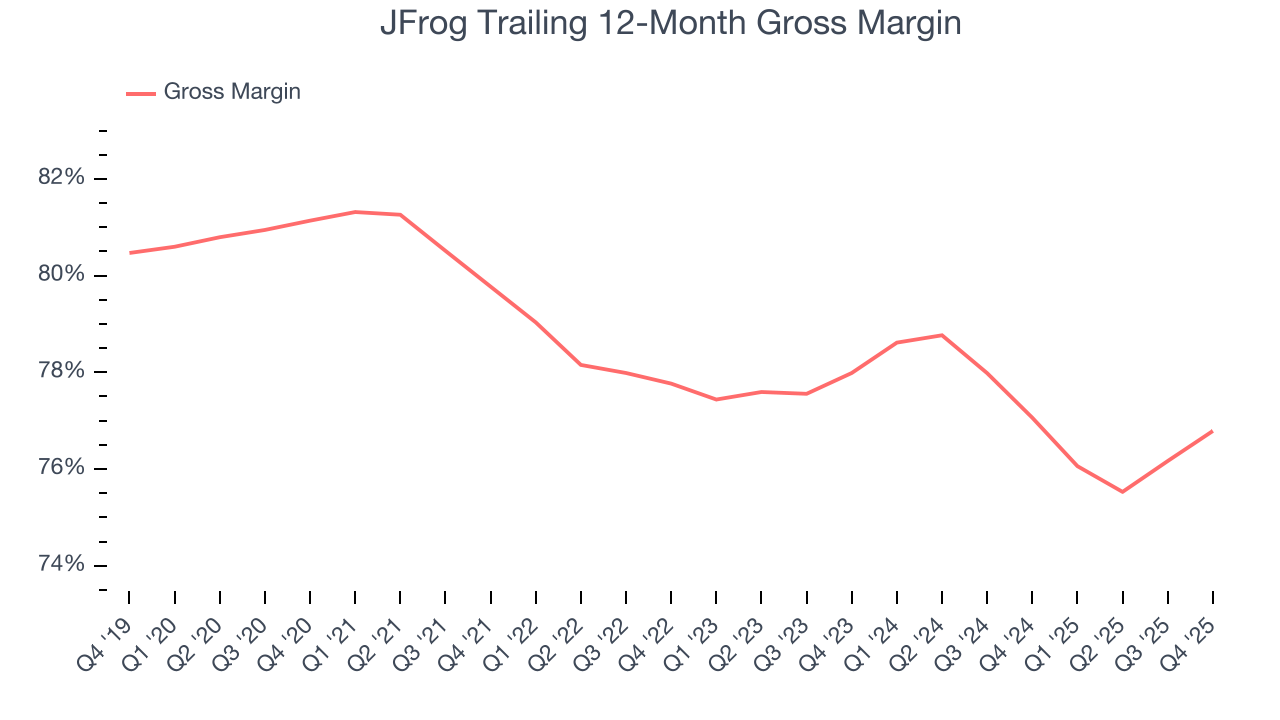
This quarter, JFrog’s gross profit margin was 77.9% , marking a 2.4 percentage point increase from 75.4% in the same quarter last year. On a wider time horizon, the company’s full-year margin has remained steady over the past four quarters, suggesting its input costs have been stable and it isn’t under pressure to lower prices.
11. Operating Margin
While many software businesses point investors to their adjusted profits, which exclude stock-based compensation (SBC), we prefer GAAP operating margin because SBC is a legitimate expense used to attract and retain talent. This metric shows how much revenue remains after accounting for all core expenses – everything from the cost of goods sold to sales and R&D.
JFrog’s expensive cost structure has contributed to an average operating margin of negative 17.3% over the last year. This happened because the company spent loads of money to capture market share. As seen in its fast revenue growth, the aggressive strategy has paid off so far, and Wall Street’s estimates suggest the party will continue. We tend to agree and believe the business has a good chance of reaching profitability upon scale.
Over the last two years, JFrog’s expanding sales gave it operating leverage as its margin rose by 4 percentage points. Still, it will take much more for the company to reach long-term profitability.
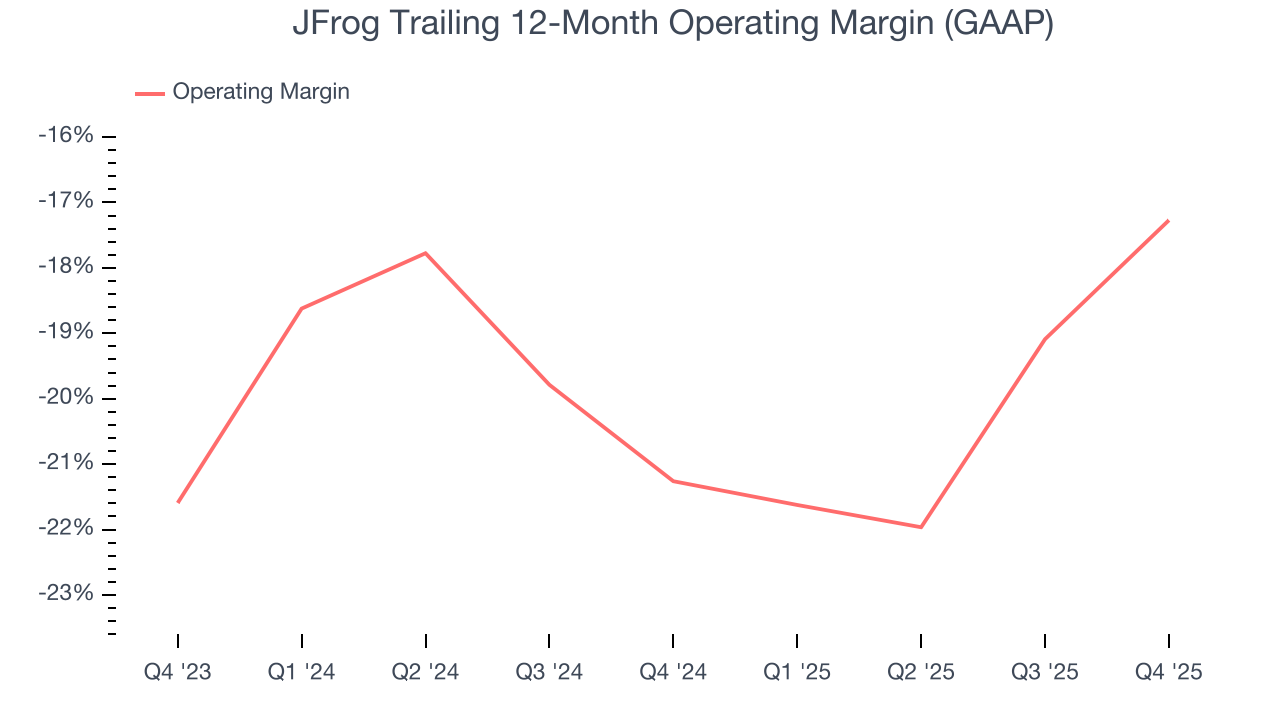
In Q4, JFrog generated a negative 14.7% operating margin.
12. Cash Is King
If you’ve followed StockStory for a while, you know we emphasize free cash flow. Why, you ask? We believe that in the end, cash is king, and you can’t use accounting profits to pay the bills.
JFrog has shown robust cash profitability, driven by its attractive business model and cost-effective customer acquisition strategy that enable it to invest in new products and services rather than sales and marketing. The company’s free cash flow margin averaged 26.8% over the last year, quite impressive for a software business. The divergence from its underwhelming operating margin stems from the add-back of non-cash charges like depreciation and stock-based compensation. GAAP operating profit expenses these line items, but free cash flow does not.
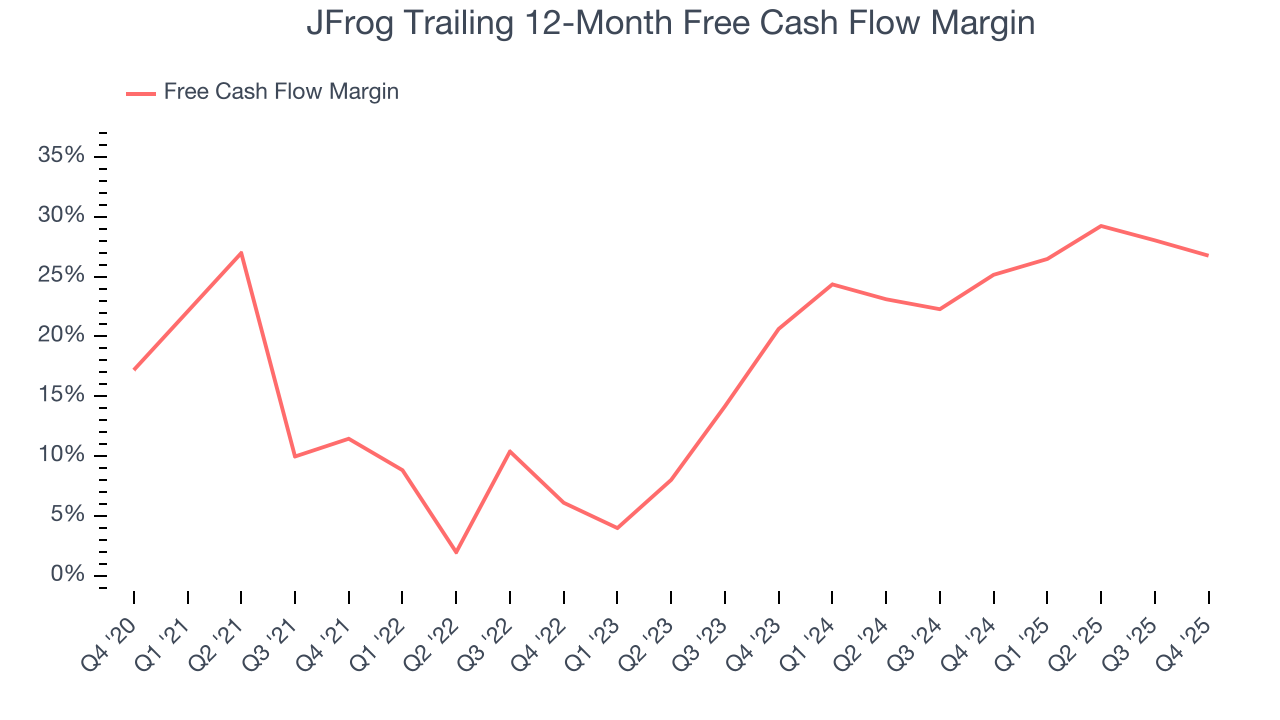
JFrog’s free cash flow clocked in at $49.86 million in Q4, equivalent to a 34.3% margin. The company’s cash profitability regressed as it was 7.5 percentage points lower than in the same quarter last year, but it’s still above its one-year average. We wouldn’t put too much weight on this quarter’s decline because investment needs can be seasonal, causing short-term swings. Long-term trends carry greater meaning.
Over the next year, analysts predict JFrog’s cash conversion will slightly fall. Their consensus estimates imply its free cash flow margin of 26.8% for the last 12 months will decrease to 23.9%.
13. Balance Sheet Assessment
One of the best ways to mitigate bankruptcy risk is to hold more cash than debt.
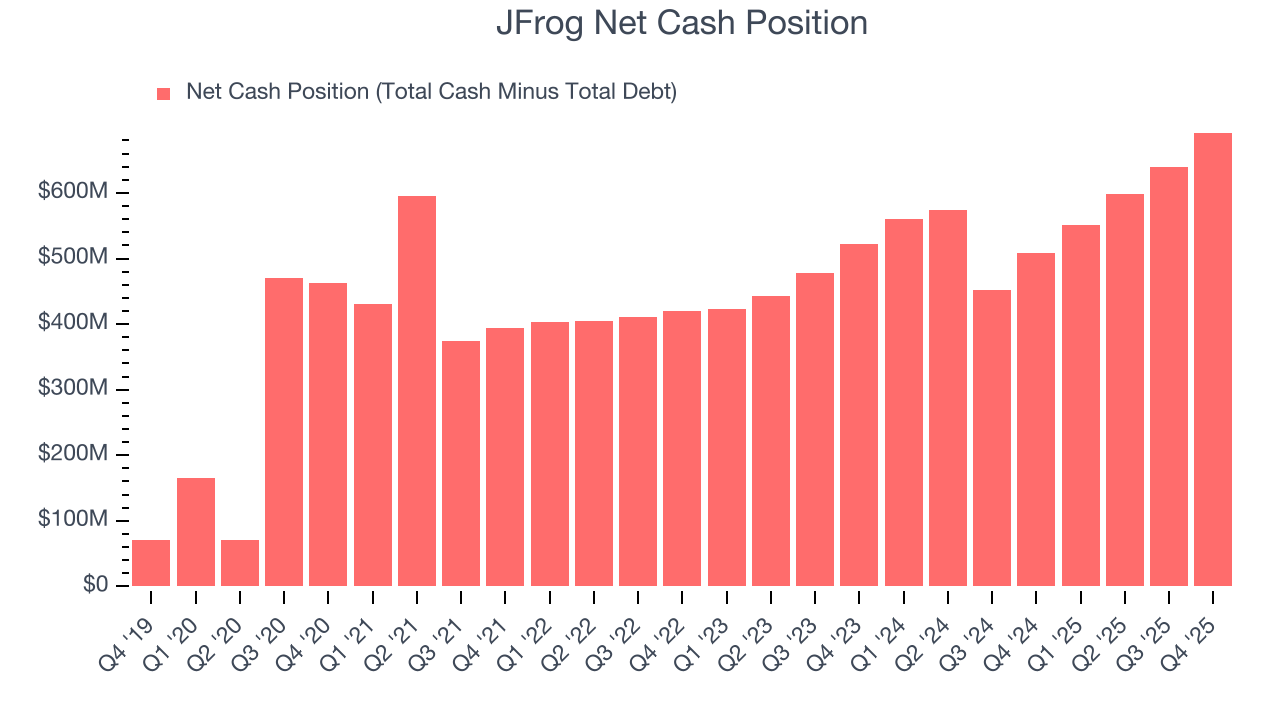
JFrog is a well-capitalized company with $704.4 million of cash and $12.46 million of debt on its balance sheet. This $692 million net cash position is 11% of its market cap and gives it the freedom to borrow money, return capital to shareholders, or invest in growth initiatives. Leverage is not an issue here.
14. Key Takeaways from JFrog’s Q4 Results
We were impressed that JFrog beat analysts’ billings expectations this quarter. This led to beats on the revenue and adjusted operating profit lines. We were also glad its revenue and EPS guidance for next quarter exceeded Wall Street’s estimates. On the other hand, there was some topline deceleration in the quarter, and the company's revenue guidance for next year suggests further deceleration in growth. Overall, we still think this was a solid quarter with some key metrics above expectations. With fears that AI is a net negative to enterprise software companies, investors were likely hoping for more, and shares traded down 10.2% to $48.67 immediately after reporting.
15. Is Now The Time To Buy JFrog?
Updated: March 17, 2026 at 10:11 PM EDT
We think that the latest earnings result is only one piece of the bigger puzzle. If you’re deciding whether to own JFrog, you should also grasp the company’s longer-term business quality and valuation.
There are multiple reasons why we think JFrog is an amazing business. First of all, the company’s revenue growth was strong over the last five years. And while its operating margins reveal poor profitability compared to other software companies, its surging ARR shows its fundamentals and revenue predictability are improving. Additionally, JFrog’s bountiful generation of free cash flow empowers it to invest in growth initiatives.
JFrog’s price-to-sales ratio based on the next 12 months is 8.2x. Scanning the software space today, JFrog’s fundamentals really stand out, and we like it at this price.
Wall Street analysts have a consensus one-year price target of $69.65 on the company (compared to the current share price of $43.66), implying they see 59.5% upside in buying JFrog in the short term.