
Himax (HIMX)
We wouldn’t recommend Himax. Its shrinking sales suggest demand is waning and its lousy free cash flow generation doesn’t do it any favors.― StockStory Analyst Team
1. News


2. Summary
Why We Think Himax Will Underperform
Taiwan-based Himax Technologies (NASDAQ:HIMX) is a leading manufacturer of display driver chips and timing controllers used in TVs, laptops, and mobile phones.
- Competitive supply chain dynamics and steep production costs are reflected in its low gross margin of 30.5%
- Customers postponed purchases of its products and services this cycle as its revenue declined by 1.3% annually over the last five years
- Projected sales growth of 6.6% for the next 12 months suggests sluggish demand


Himax doesn’t fulfill our quality requirements. We see more favorable opportunities in the market.
Why There Are Better Opportunities Than Himax


Himax’s stock price of $8.93 implies a valuation ratio of 37.8x forward P/E. This multiple is higher than most semiconductor companies, and we think it’s quite expensive for the weaker revenue growth you get.
There are stocks out there featuring similar valuation multiples with better fundamentals. We prefer to invest in those.
3. Himax (HIMX) Research Report: Q4 CY2025 Update
Semiconductor maker Himax Technologies (NASDAQ:HIMX) reported Q4 CY2025 results beating Wall Street’s revenue expectations, but sales fell by 14.4% year on year to $203.1 million. Its GAAP profit of $0.04 per share was in line with analysts’ consensus estimates.
Himax (HIMX) Q4 CY2025 Highlights:
- Revenue: $203.1 million vs analyst estimates of $199.2 million (14.4% year-on-year decline, 2% beat)
- EPS (GAAP): $0.04 vs analyst estimates of $0.04 (in line)
- Adjusted EBITDA: $13.69 million (6.7% margin, 1% year-on-year decline)
- Operating Margin: 3.4%, down from 9.7% in the same quarter last year
- Free Cash Flow Margin: 6.3%, down from 13.6% in the same quarter last year
- Inventory Days Outstanding: 98, up from 90 in the previous quarter
- Market Capitalization: $1.44 billion
Company Overview
Taiwan-based Himax Technologies (NASDAQ:HIMX) is a leading manufacturer of display driver chips and timing controllers used in TVs, laptops, and mobile phones.
Himax was founded in 2001 by B.S. Wu, who pioneered flat panel technologies at Chimei Electronics as CTO. In March of 2006, Himax went public with a listing on the NASDAQ exchange.
Himax products primarily address the flat panel display industry. These products are critical components of displays ranging from TVs to driver displays to mobile phones and tablets. Himax’s emerging technologies include products such as WiseEye AI Image Sensing, which brings computer vision AI to endpoint devices such as smart doors and locks with extremely low power requirements.
The company’s customers are primarily panel manufacturers and mobile device module manufacturers, who in turn design their products for consumer end-use products such as notebook computers, desktop monitors, and TVs. Because Himax operates primarily in a fabless model that utilizes third-party foundries, the company relies on semiconductor manufacturing service providers for wafer fabrication, assembly, testing, and packaging.
Competitors in fabless display imaging semiconductors include Fitipower Integrated Technology (TPE:4961), FocalTech Systems (TPE:3545), Novatek Microelectronics (TPE:3034), and Raydium Semiconductor Corporation (TPE:3592).
4. Revenue Growth
A company’s long-term performance is an indicator of its overall quality. Any business can put up a good quarter or two, but many enduring ones grow for years. Himax’s demand was weak over the last five years as its sales fell at a 1.3% annual rate. This was below our standards and suggests it’s a low quality business. Semiconductors are a cyclical industry, and long-term investors should be prepared for periods of high growth followed by periods of revenue contractions.
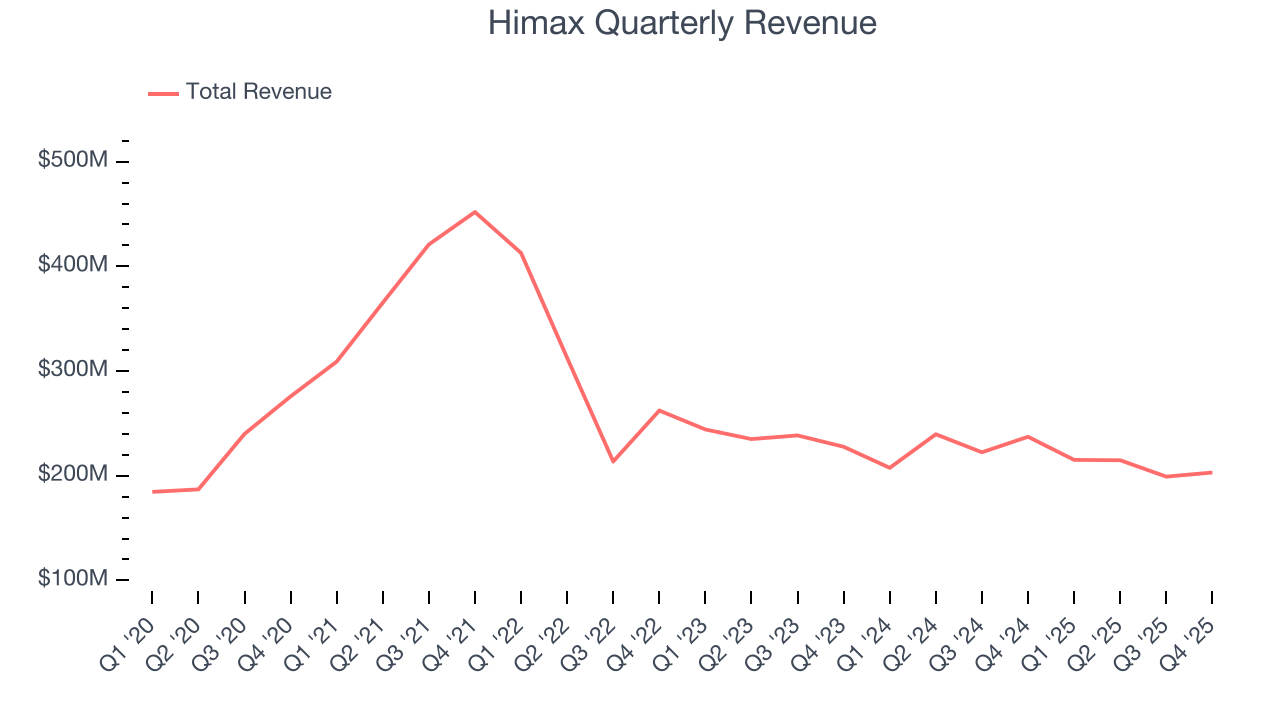
Long-term growth is the most important, but short-term results matter for semiconductors because the rapid pace of technological innovation (Moore's Law) could make yesterday's hit product obsolete today. Himax’s recent performance shows its demand remained suppressed as its revenue has declined by 6.2% annually over the last two years. 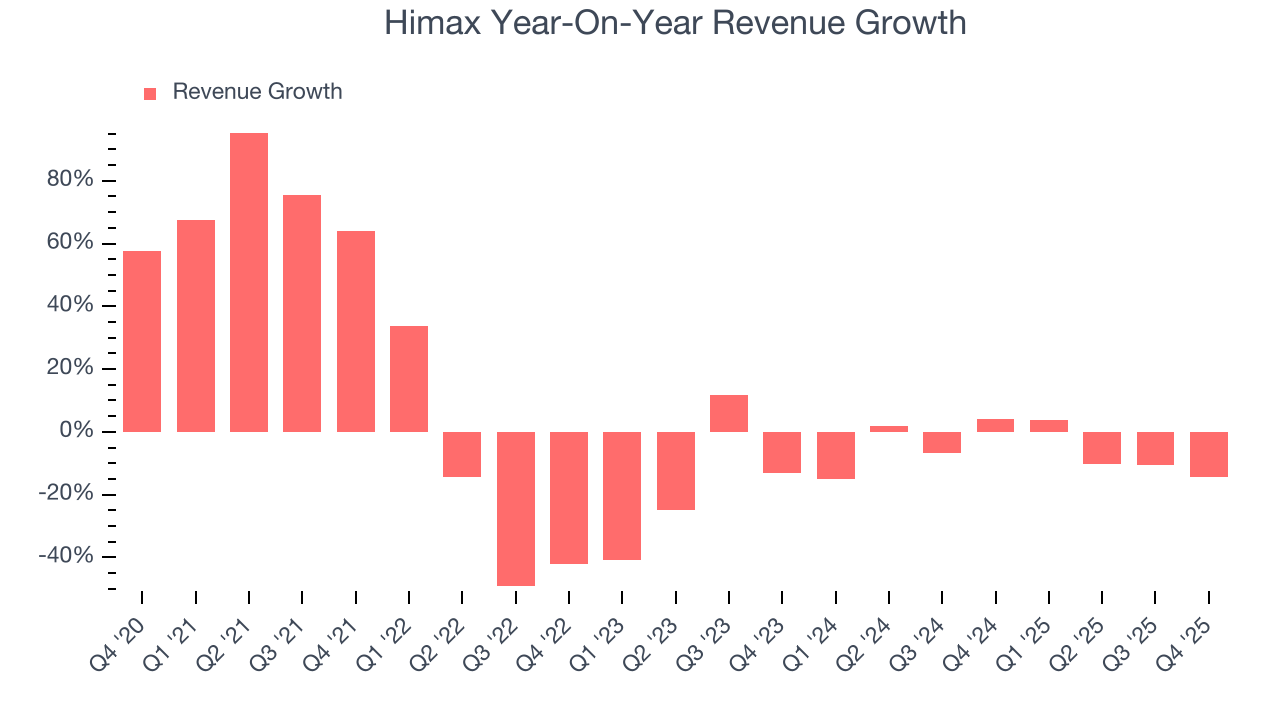
This quarter, Himax’s revenue fell by 14.4% year on year to $203.1 million but beat Wall Street’s estimates by 2%. Despite the beat, the drop in sales could mean that the current downcycle is deepening.
Looking ahead, sell-side analysts expect revenue to grow 3.5% over the next 12 months. Although this projection implies its newer products and services will fuel better top-line performance, it is still below the sector average.
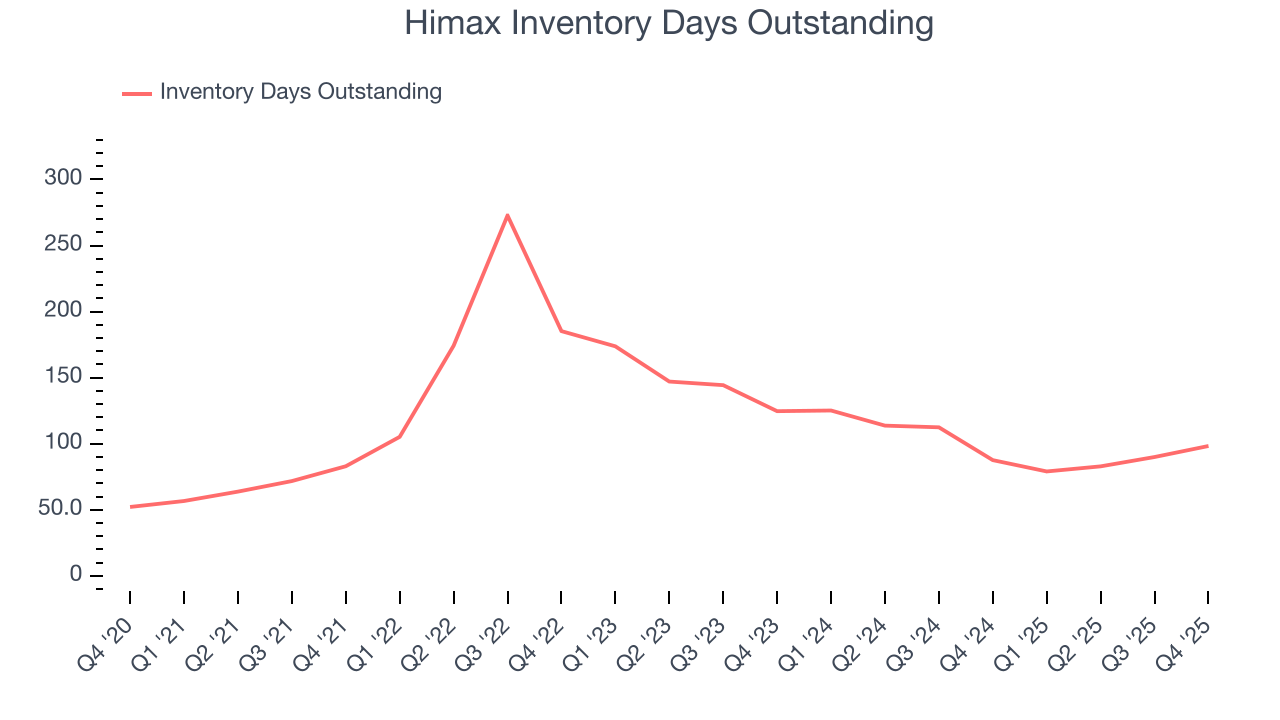
5. Product Demand & Outstanding Inventory
Days Inventory Outstanding (DIO) is an important metric for chipmakers, as it reflects a business’ capital intensity and the cyclical nature of semiconductor supply and demand. In a tight supply environment, inventories tend to be stable, allowing chipmakers to exert pricing power. Steadily increasing DIO can be a warning sign that demand is weak, and if inventories continue to rise, the company may have to downsize production.
This quarter, Himax’s DIO came in at 98, which is 21 days below its five-year average. These numbers show that despite the recent increase, there’s no indication of an excessive inventory buildup.
6. Gross Margin & Pricing Power
Gross profit margin is a key metric to track because it shows how much money a semiconductor company gets to keep after paying for its raw materials, manufacturing, and other input costs.
Himax’s gross margin is one of the worst in the semiconductor industry, signaling it operates in a competitive market and lacks pricing power. As you can see below, it averaged a 30.5% gross margin over the last two years. Said differently, Himax had to pay a chunky $69.49 to its suppliers for every $100 in revenue. 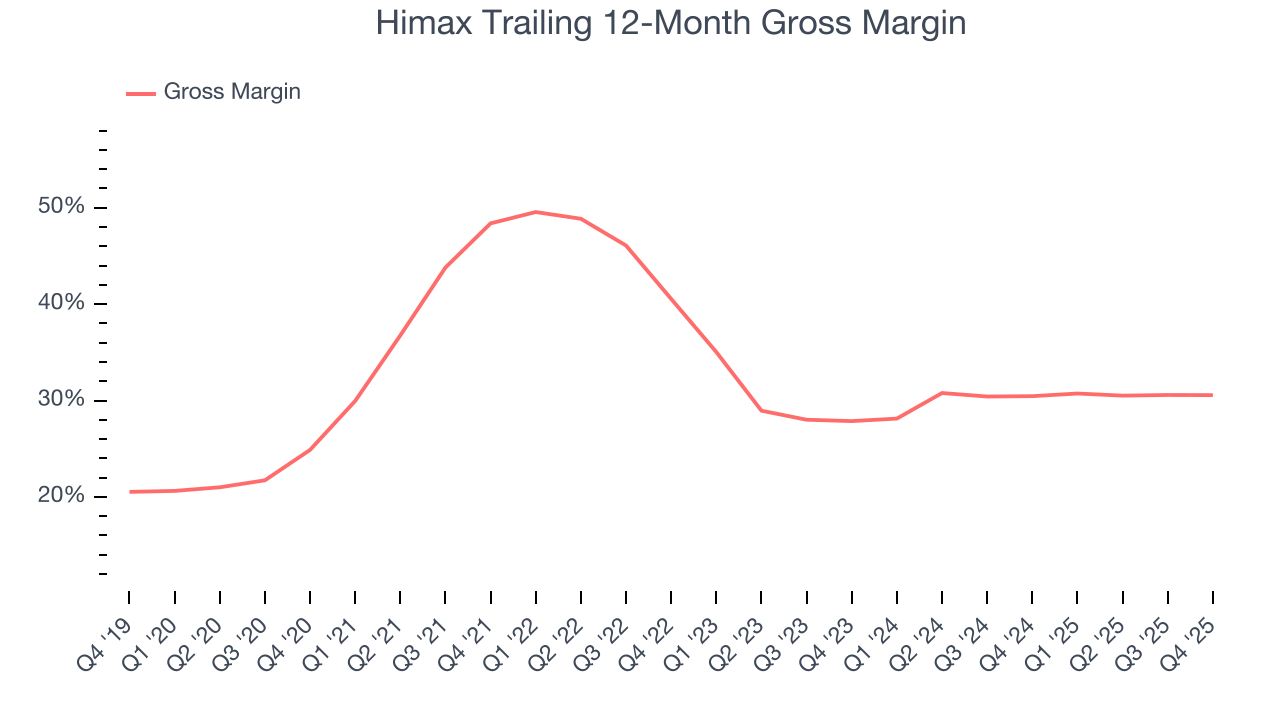
In Q4, Himax produced a 30.4% gross profit margin, in line with the same quarter last year. On a wider time horizon, the company’s full-year margin has remained steady over the past four quarters, suggesting its input costs (such as raw materials and manufacturing expenses) have been stable and it isn’t under pressure to lower prices.
7. Operating Margin
Himax was profitable over the last two years but held back by its large cost base. Its average operating margin of 6.5% was weak for a semiconductor business. This result isn’t too surprising given its low gross margin as a starting point.
Looking at the trend in its profitability, Himax’s operating margin decreased by 29.9 percentage points over the last five years. Himax’s performance was poor no matter how you look at it - it shows that costs were rising and it couldn’t pass them onto its customers.
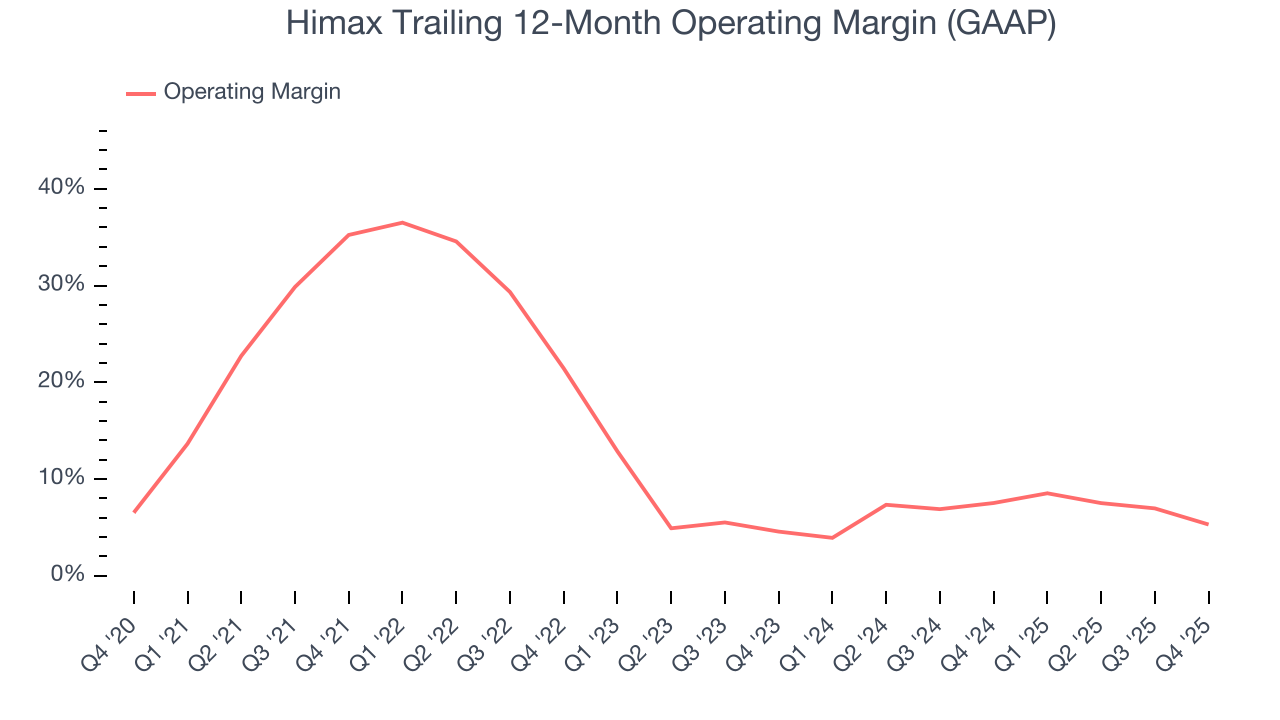
In Q4, Himax generated an operating margin profit margin of 3.4%, down 6.4 percentage points year on year. Since Himax’s operating margin decreased more than its gross margin, we can assume it was less efficient because expenses such as marketing, R&D, and administrative overhead increased.
8. Earnings Per Share
Revenue trends explain a company’s historical growth, but the long-term change in earnings per share (EPS) points to the profitability of that growth – for example, a company could inflate its sales through excessive spending on advertising and promotions.
Sadly for Himax, its EPS and revenue declined by 1.5% and 1.3% annually over the last five years. We tend to steer our readers away from companies with falling revenue and EPS, where diminishing earnings could imply changing secular trends and preferences. If the tide turns unexpectedly, Himax’s low margin of safety could leave its stock price susceptible to large downswings.
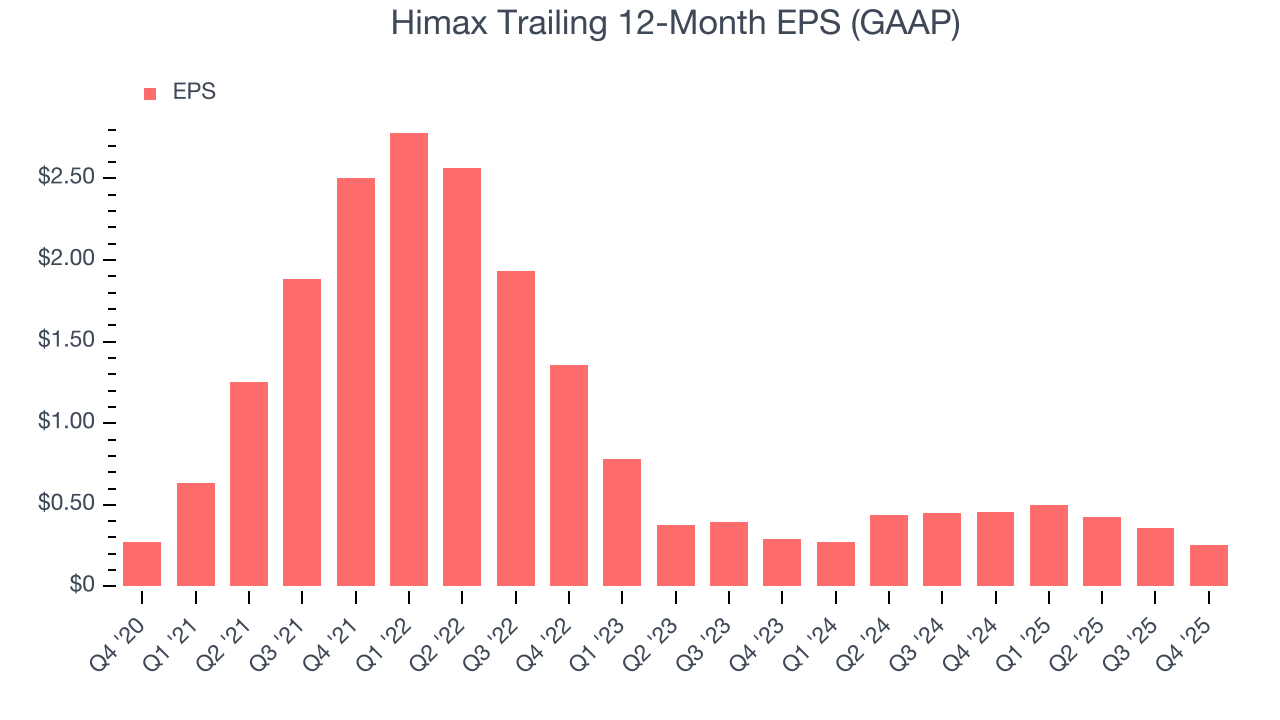
In Q4, Himax reported EPS of $0.04, down from $0.14 in the same quarter last year. Despite falling year on year, this print beat analysts’ estimates by 2.9%. Over the next 12 months, Wall Street expects Himax’s full-year EPS of $0.25 to grow 18.2%.
9. Cash Is King
Although earnings are undoubtedly valuable for assessing company performance, we believe cash is king because you can’t use accounting profits to pay the bills.
Himax has shown mediocre cash profitability over the last two years, giving the company limited opportunities to return capital to shareholders. Its free cash flow margin averaged 12.8%, subpar for a semiconductor business.
Taking a step back, we can see that Himax’s margin dropped by 10.2 percentage points over the last five years. It may have ticked higher more recently, but shareholders are likely hoping for its margin to at least revert to its historical level. Almost any movement in the wrong direction is undesirable because of its relatively low cash conversion. If the longer-term trend returns, it could signal it’s in the middle of a big investment cycle.
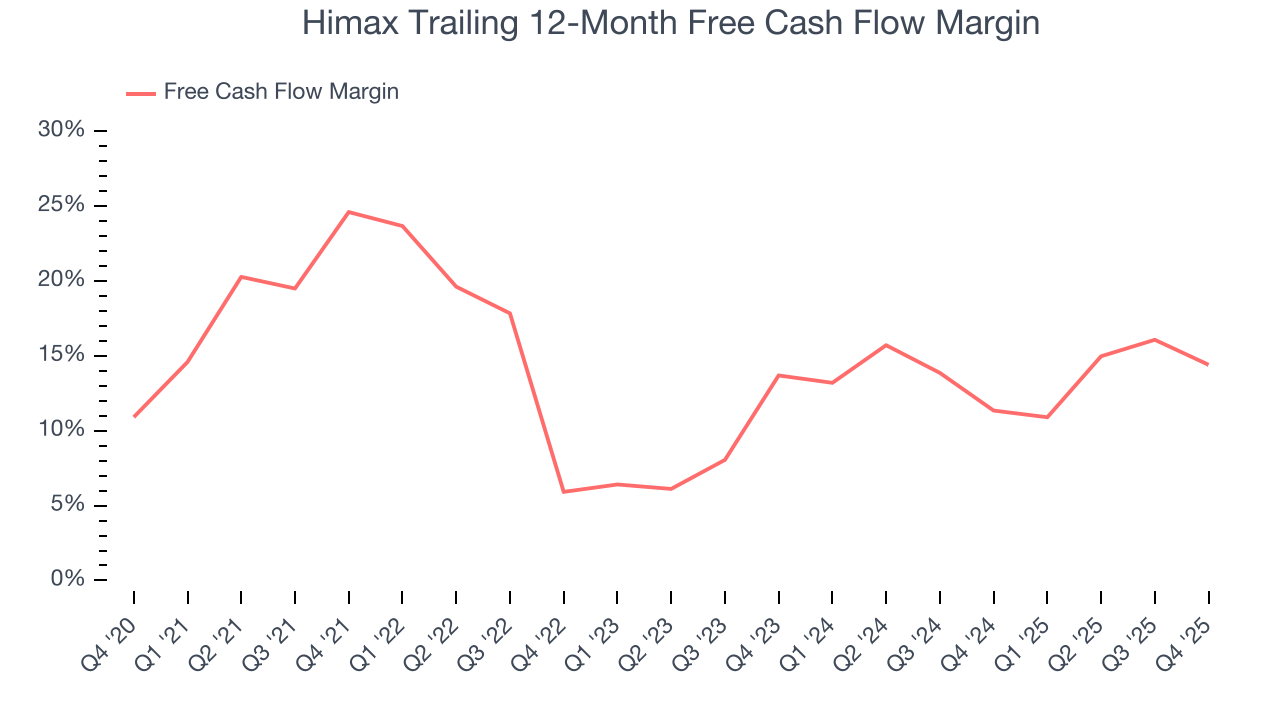
Himax’s free cash flow clocked in at $12.82 million in Q4, equivalent to a 6.3% margin. The company’s cash profitability regressed as it was 7.3 percentage points lower than in the same quarter last year, suggesting its historical struggles have dragged on.
10. Return on Invested Capital (ROIC)
EPS and free cash flow tell us whether a company was profitable while growing its revenue. But was it capital-efficient? Enter ROIC, a metric showing how much operating profit a company generates relative to the money it has raised (debt and equity).
Although Himax hasn’t been the highest-quality company lately because of its poor top-line performance, it historically found a few growth initiatives that worked. Its five-year average ROIC was 26.4%, higher than most semiconductor businesses.
11. Balance Sheet Risk
As long-term investors, the risk we care about most is the permanent loss of capital, which can happen when a company goes bankrupt or raises money from a disadvantaged position. This is separate from short-term stock price volatility, something we are much less bothered by.
Himax’s $596.8 million of debt exceeds the $257.5 million of cash on its balance sheet. Furthermore, its 5× net-debt-to-EBITDA ratio (based on its EBITDA of $67.41 million over the last 12 months) shows the company is overleveraged.
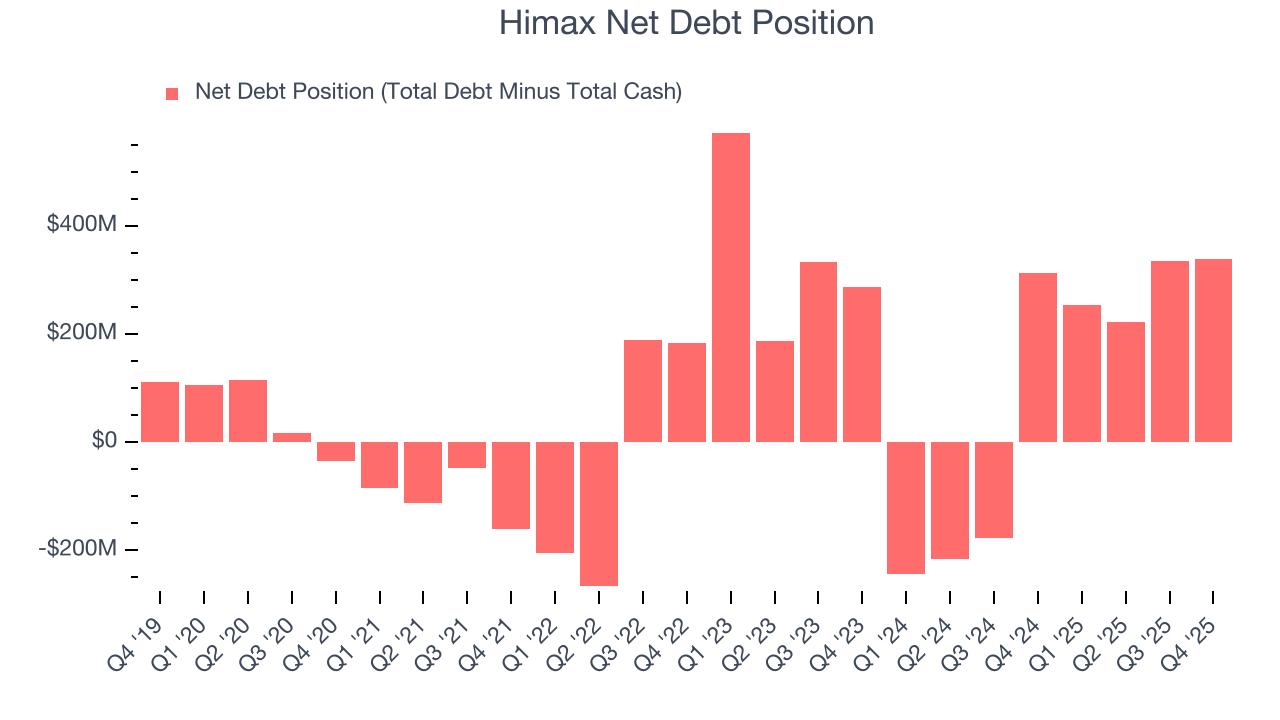
At this level of debt, incremental borrowing becomes increasingly expensive and credit agencies could downgrade the company’s rating if profitability falls. Himax could also be backed into a corner if the market turns unexpectedly – a situation we seek to avoid as investors in high-quality companies.
We hope Himax can improve its balance sheet and remain cautious until it increases its profitability or pays down its debt.
12. Key Takeaways from Himax’s Q4 Results
It was encouraging to see Himax meet analysts’ EPS expectations this quarter. We were also happy its revenue outperformed Wall Street’s estimates. On the other hand, its inventory levels materially increased. Zooming out, we think this was a mixed quarter. The stock remained flat at $8.24 immediately following the results.
13. Is Now The Time To Buy Himax?
Updated: March 18, 2026 at 10:39 PM EDT
We think that the latest earnings result is only one piece of the bigger puzzle. If you’re deciding whether to own Himax, you should also grasp the company’s longer-term business quality and valuation.
Himax doesn’t pass our quality test. To kick things off, its revenue has declined over the last five years. While its solid ROIC suggests it has grown profitably in the past, the downside is its declining operating margin shows the business has become less efficient. On top of that, its low gross margins indicate some combination of pricing pressures or rising production costs.
Himax’s P/E ratio based on the next 12 months is 37.8x. This multiple tells us a lot of good news is priced in - we think there are better opportunities elsewhere.
Wall Street analysts have a consensus one-year price target of $9.05 on the company (compared to the current share price of $8.93).