
Hillman (HLMN)
We’re cautious of Hillman. Its weak sales growth and low returns on capital show it struggled to generate demand and profits.― StockStory Analyst Team
1. News


2. Summary
Why Hillman Is Not Exciting
Established when Max Hillman purchased a franchise operation, Hillman (NASDAQ:HLMN) designs, manufactures, and sells industrial equipment and systems for various sectors.
- ROIC of 2.5% reflects management’s challenges in identifying attractive investment opportunities
- Muted 2.6% annual revenue growth over the last five years shows its demand lagged behind its industrials peers
- On the bright side, its offerings are difficult to replicate at scale and result in a best-in-class gross margin of 45.2%


Hillman’s quality isn’t up to par. We believe there are better opportunities elsewhere.
Why There Are Better Opportunities Than Hillman


Hillman’s stock price of $8.18 implies a valuation ratio of 14.4x forward P/E. This multiple is cheaper than most industrials peers, but we think this is justified.
We’d rather pay up for companies with elite fundamentals than get a bargain on weak ones. Cheap stocks can be value traps, and as their performance deteriorates, they will stay cheap or get even cheaper.
3. Hillman (HLMN) Research Report: Q4 CY2025 Update
Hardware products and merchandising solutions provider Hillman (NASDAQ:HLMN) missed Wall Street’s revenue expectations in Q4 CY2025 as sales rose 4.5% year on year to $365.1 million. The company’s full-year revenue guidance of $1.65 billion at the midpoint came in 1.9% below analysts’ estimates. Its non-GAAP profit of $0.10 per share was in line with analysts’ consensus estimates.
Hillman (HLMN) Q4 CY2025 Highlights:
- Revenue: $365.1 million vs analyst estimates of $372.4 million (4.5% year-on-year growth, 2% miss)
- Adjusted EPS: $0.10 vs analyst estimates of $0.10 (in line)
- Adjusted EBITDA: $57.54 million vs analyst estimates of $56.57 million (15.8% margin, 1.7% beat)
- EBITDA guidance for the upcoming financial year 2026 is $280 million at the midpoint, below analyst estimates of $283.2 million
- Operating Margin: 4.6%, in line with the same quarter last year
- Free Cash Flow Margin: 4.4%, down from 6.3% in the same quarter last year
- Market Capitalization: $1.98 billion
Company Overview
Established when Max Hillman purchased a franchise operation, Hillman (NASDAQ:HLMN) designs, manufactures, and sells industrial equipment and systems for various sectors.
The company's history dates back to 1964 when Max Hillman established Hillman Bolt & Screw Corporation in Cincinnati, Ohio. Over the decades, Hillman has grown from a local distributor to a major player in the hardware industry, serving hardware stores, home centers, mass merchants, pet supply stores, and other retail outlets across the United States, Canada, Mexico, Latin America, and the Caribbean.
Hillman operates through three distinct business segments: Hardware and Protective Solutions, Robotics and Digital Solutions, and Canada. The Hardware and Protective Solutions segment forms the core of Hillman's business, offering an extensive array of products including fasteners, builders' hardware, wall hanging items, threaded rod and metal shapes, letters, numbers, and signs, as well as personal protective equipment. This segment caters to both professional contractors and DIY enthusiasts, providing essential items for construction, home improvement, and safety applications.
The Robotics and Digital Solutions segment represents Hillman's foray into technology-driven services. This division primarily focuses on software-enabled robotic key duplication and engraving solutions. Hillman's self-service kiosks and store associate-assisted systems for key duplication and engraving are deployed in high-traffic retail environments, offering consumers convenient, on-the-spot customization options. The Canada segment essentially mirrors the product offerings of the other two segments but is specifically focused on serving the Canadian market. This division also includes a unique capability to produce made-to-order screws and self-locking fasteners for automotive suppliers, OEMs, and industrial distributors.
The company generates income through the sale of hardware products, the provision of merchandising services, and the operation of its key duplication and engraving kiosks. A significant portion of Hillman's revenue comes from its relationships with major retailers. The company's top two customers, Home Depot and Lowe's, account for a substantial percentage of its total sales.
4. Professional Tools and Equipment
Automation that increases efficiency and connected equipment that collects analyzable data have been trending, creating new demand. Some professional tools and equipment companies also provide software to accompany measurement or automated machinery, adding a stream of recurring revenues to their businesses. On the other hand, professional tools and equipment companies are at the whim of economic cycles. Consumer spending and interest rates, for example, can greatly impact the industrial production that drives demand for these companies’ offerings.
Competitors offering similar products include Fortune Brands Home & Security (NYSE:FBHS), Stanley Black & Decker (NYSE:SWK), and Spectrum Brands (NYSE:SPB).
5. Revenue Growth
Examining a company’s long-term performance can provide clues about its quality. Any business can put up a good quarter or two, but the best consistently grow over the long haul. Over the last five years, Hillman grew its sales at a sluggish 2.6% compounded annual growth rate. This fell short of our benchmarks and is a tough starting point for our analysis.
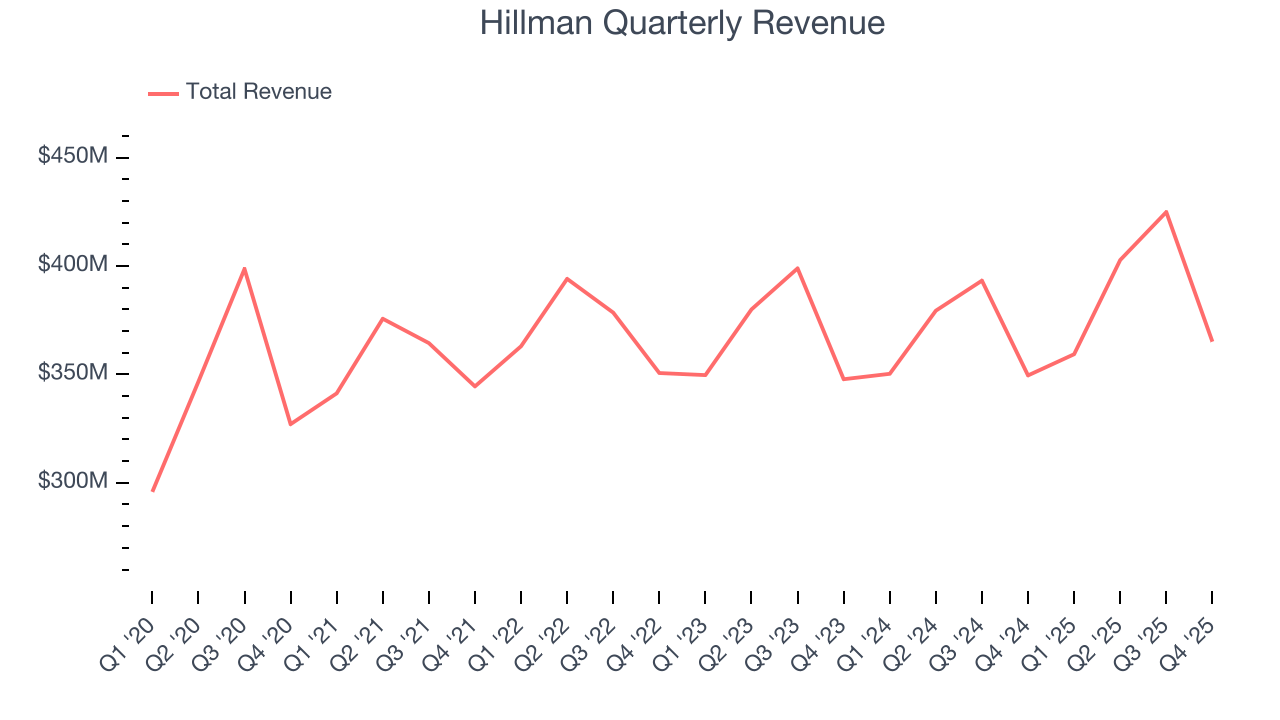
Long-term growth is the most important, but within industrials, a half-decade historical view may miss new industry trends or demand cycles. Hillman’s annualized revenue growth of 2.5% over the last two years aligns with its five-year trend, suggesting its demand was consistently weak. 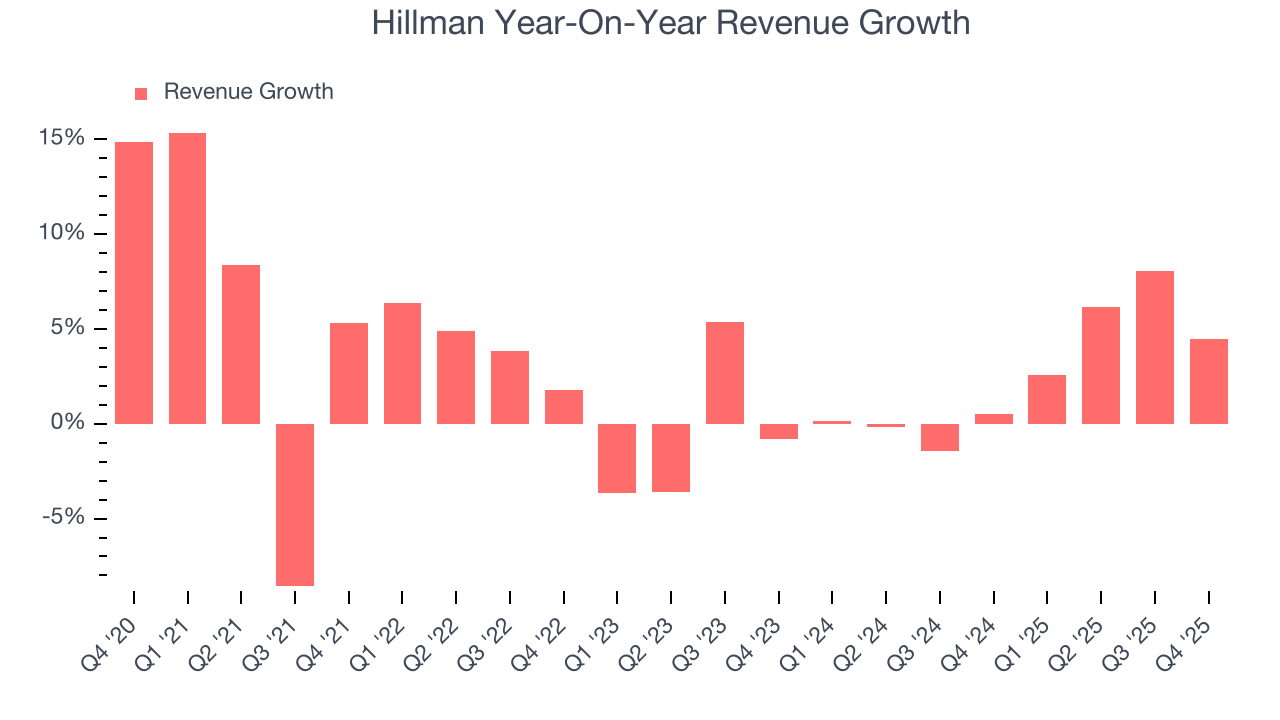
This quarter, Hillman’s revenue grew by 4.5% year on year to $365.1 million, falling short of Wall Street’s estimates.
Looking ahead, sell-side analysts expect revenue to grow 8.2% over the next 12 months, an improvement versus the last two years. This projection is above average for the sector and indicates its newer products and services will fuel better top-line performance.
6. Gross Margin & Pricing Power
Hillman has best-in-class unit economics for an industrials company, enabling it to invest in areas such as research and development. Its margin also signals it sells differentiated products, not commodities. As you can see below, it averaged an elite 45.2% gross margin over the last five years. That means Hillman only paid its suppliers $54.81 for every $100 in revenue. 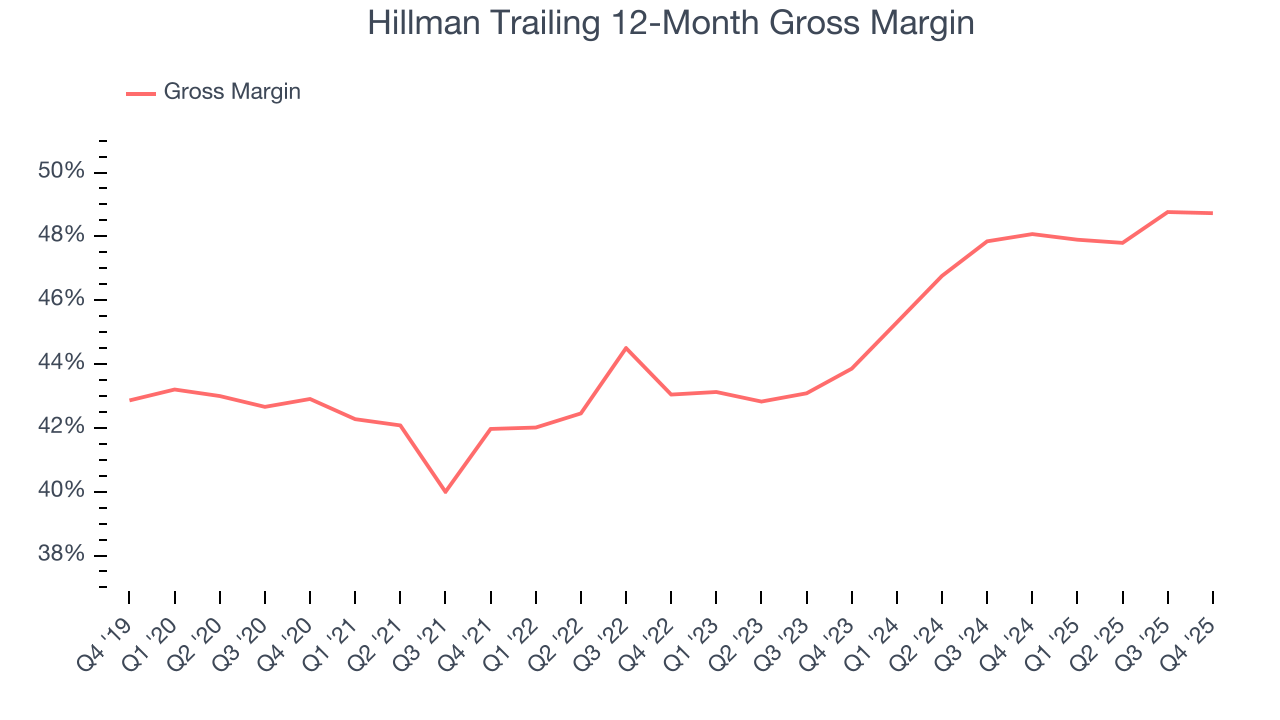
This quarter, Hillman’s gross profit margin was 47.6%, in line with the same quarter last year. On a wider time horizon, the company’s full-year margin has remained steady over the past four quarters, suggesting its input costs (such as raw materials and manufacturing expenses) have been stable and it isn’t under pressure to lower prices.
7. Operating Margin
Hillman was profitable over the last five years but held back by its large cost base. Its average operating margin of 4.2% was weak for an industrials business. This result is surprising given its high gross margin as a starting point.
On the plus side, Hillman’s operating margin rose by 6.6 percentage points over the last five years, as its sales growth gave it operating leverage.
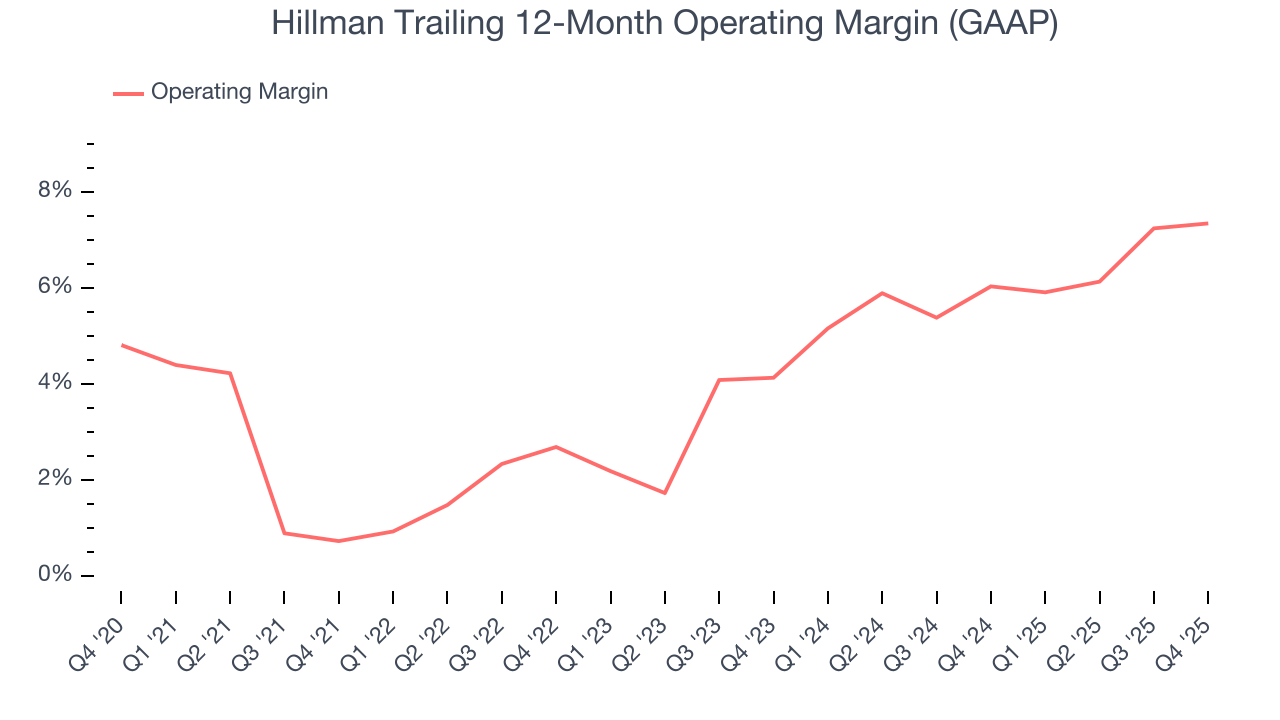
In Q4, Hillman generated an operating margin profit margin of 4.6%, in line with the same quarter last year. This indicates the company’s cost structure has recently been stable.
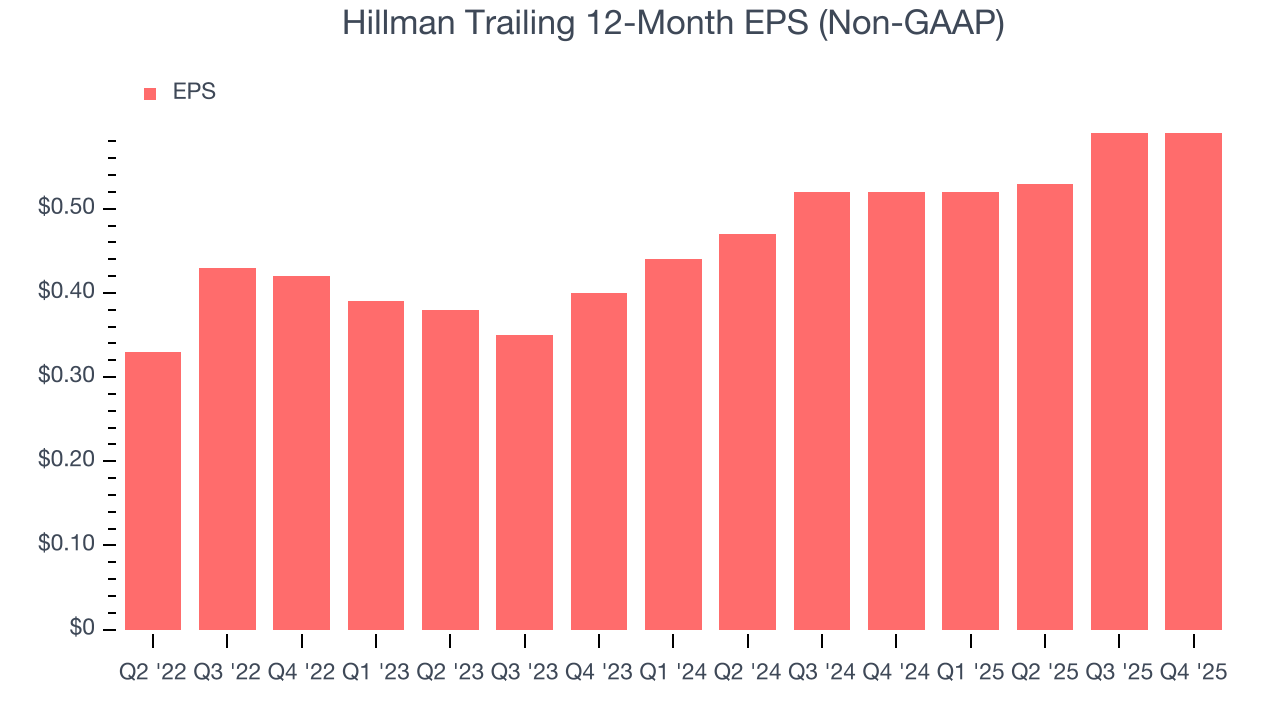
8. Earnings Per Share
Revenue trends explain a company’s historical growth, but the long-term change in earnings per share (EPS) points to the profitability of that growth – for example, a company could inflate its sales through excessive spending on advertising and promotions.
Hillman’s full-year EPS grew at an astounding 33.7% compounded annual growth rate over the last four years, better than the broader industrials sector.
Like with revenue, we analyze EPS over a more recent period because it can provide insight into an emerging theme or development for the business.
Hillman’s EPS grew at an astounding 21.4% compounded annual growth rate over the last two years, higher than its 2.5% annualized revenue growth. This tells us the company became more profitable on a per-share basis as it expanded.
Diving into the nuances of Hillman’s earnings can give us a better understanding of its performance. While we mentioned earlier that Hillman’s operating margin was flat this quarter, a two-year view shows its margin has expanded. This was the most relevant factor (aside from the revenue impact) behind its higher earnings; interest expenses and taxes can also affect EPS but don’t tell us as much about a company’s fundamentals.
In Q4, Hillman reported adjusted EPS of $0.10, in line with the same quarter last year. This print beat analysts’ estimates by 4.3%. Over the next 12 months, Wall Street expects Hillman’s full-year EPS of $0.59 to grow 1.2%.
9. Cash Is King
Although earnings are undoubtedly valuable for assessing company performance, we believe cash is king because you can’t use accounting profits to pay the bills.
Hillman has shown poor cash profitability over the last five years, giving the company limited opportunities to return capital to shareholders. Its free cash flow margin averaged 2.6%, lousy for an industrials business.
Taking a step back, an encouraging sign is that Hillman’s margin expanded by 13.6 percentage points during that time. The company’s improvement shows it’s heading in the right direction, and we can see it became a less capital-intensive business because its free cash flow profitability rose more than its operating profitability.
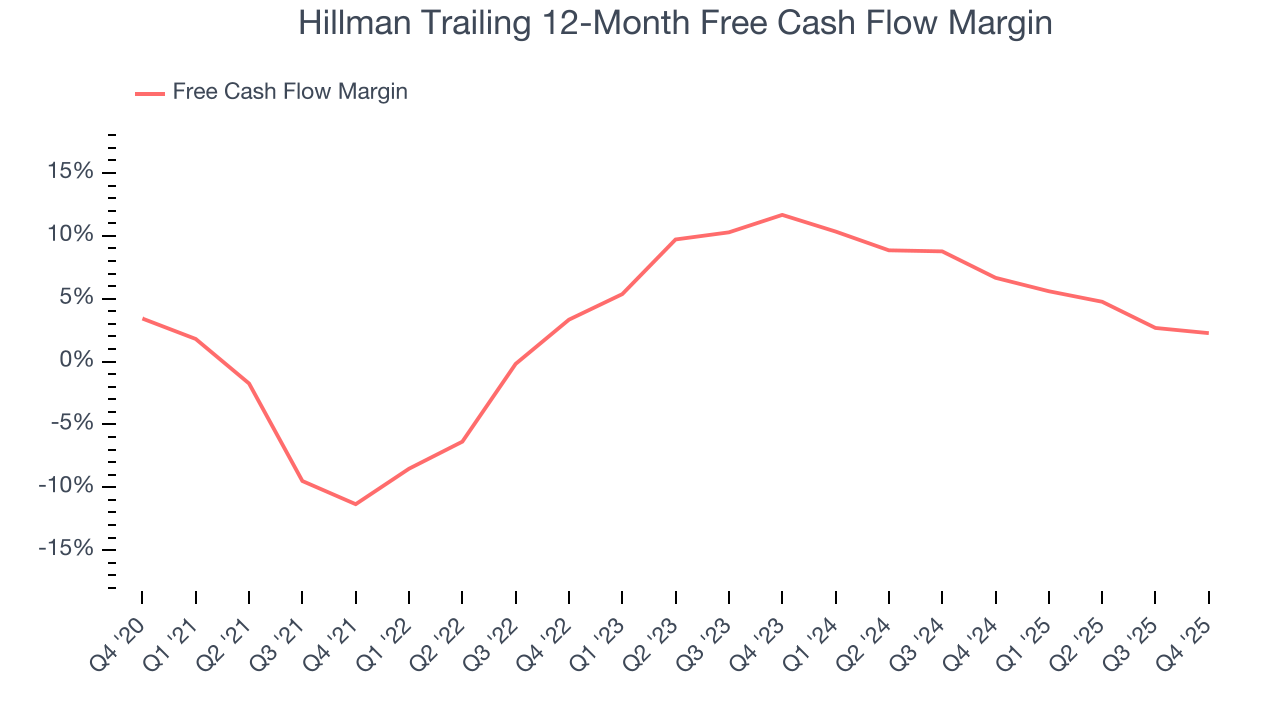
Hillman’s free cash flow clocked in at $16.14 million in Q4, equivalent to a 4.4% margin. The company’s cash profitability regressed as it was 1.9 percentage points lower than in the same quarter last year, but it’s still above its five-year average. We wouldn’t read too much into this quarter’s decline because capital expenditures can be seasonal and companies often stockpile inventory in anticipation of higher demand, leading to short-term swings. Long-term trends trump temporary fluctuations.
10. Return on Invested Capital (ROIC)
EPS and free cash flow tell us whether a company was profitable while growing its revenue. But was it capital-efficient? Enter ROIC, a metric showing how much operating profit a company generates relative to the money it has raised (debt and equity).
Hillman historically did a mediocre job investing in profitable growth initiatives. Its five-year average ROIC was 2.5%, lower than the typical cost of capital (how much it costs to raise money) for industrials companies.
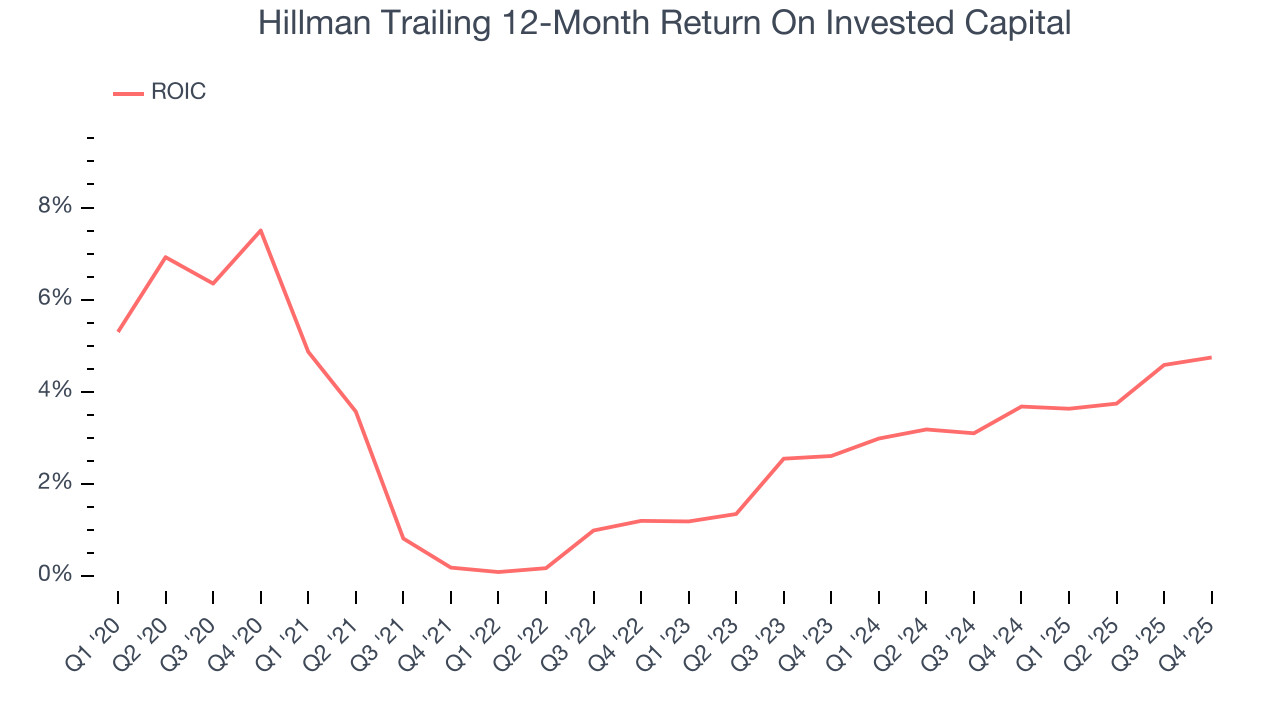
We like to invest in businesses with high returns, but the trend in a company’s ROIC is what often surprises the market and moves the stock price. On average, Hillman’s ROIC increased by 3.5 percentage points annually each year over the last few years. This is a good sign, and if its returns keep rising, there’s a chance it could evolve into an investable business.
11. Balance Sheet Assessment
Hillman reported $27.28 million of cash and $764.6 million of debt on its balance sheet in the most recent quarter. As investors in high-quality companies, we primarily focus on two things: 1) that a company’s debt level isn’t too high and 2) that its interest payments are not excessively burdening the business.
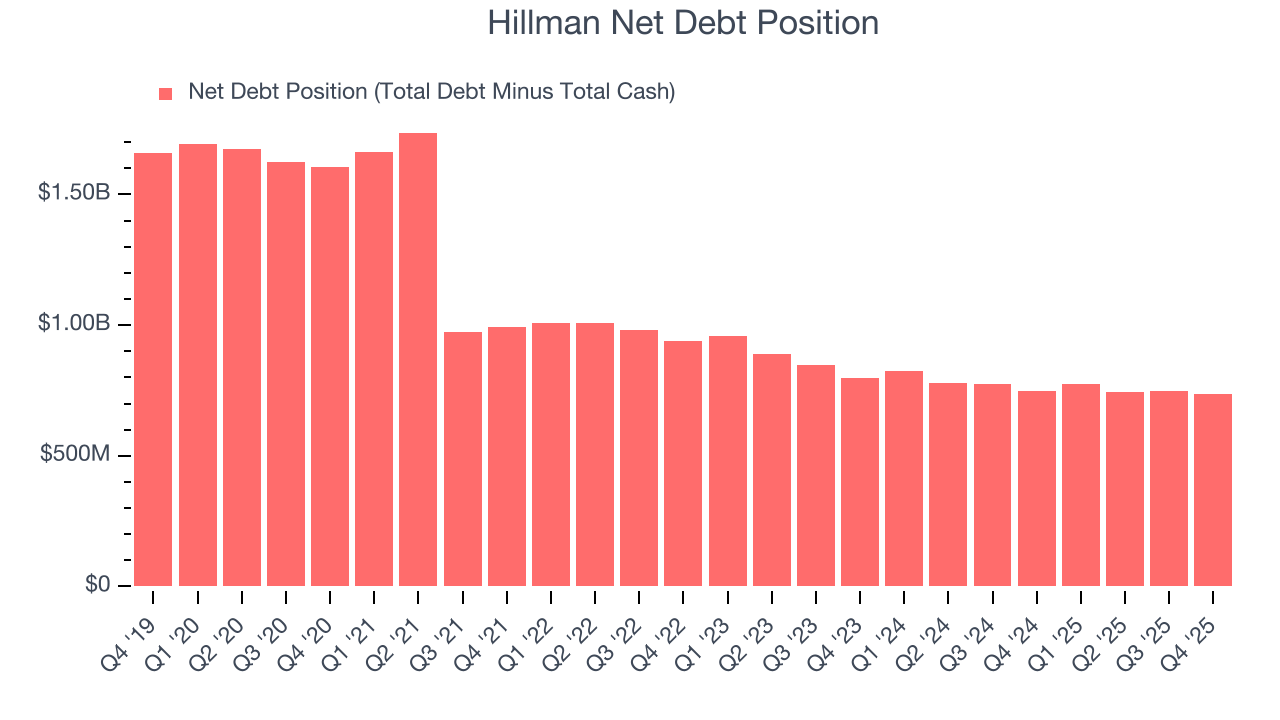
With $275.3 million of EBITDA over the last 12 months, we view Hillman’s 2.7× net-debt-to-EBITDA ratio as safe. We also see its $29.62 million of annual interest expenses as appropriate. The company’s profits give it plenty of breathing room, allowing it to continue investing in growth initiatives.
12. Key Takeaways from Hillman’s Q4 Results
It was encouraging to see Hillman beat analysts’ EBITDA expectations this quarter. We were also glad its EPS was in line with Wall Street’s estimates. On the other hand, its revenue missed and its full-year revenue guidance fell short of Wall Street’s estimates. Overall, this was a weaker quarter. The stock traded down 4.6% to $9.59 immediately after reporting.
13. Is Now The Time To Buy Hillman?
Updated: March 28, 2026 at 11:50 PM EDT
Before deciding whether to buy Hillman or pass, we urge investors to consider business quality, valuation, and the latest quarterly results.
Hillman isn’t a terrible business, but it doesn’t pass our bar. First off, its revenue growth was weak over the last five years. While its admirable gross margins indicate the mission-critical nature of its offerings, the downside is its relatively low ROIC suggests management has struggled to find compelling investment opportunities. On top of that, its projected EPS for the next year is lacking.
Hillman’s P/E ratio based on the next 12 months is 14.4x. While this valuation is reasonable, we don’t really see a big opportunity at the moment. We're fairly confident there are better investments elsewhere.
Wall Street analysts have a consensus one-year price target of $12.13 on the company (compared to the current share price of $8.18).
Although the price target is bullish, readers should exercise caution because analysts tend to be overly optimistic. The firms they work for, often big banks, have relationships with companies that extend into fundraising, M&A advisory, and other rewarding business lines. As a result, they typically hesitate to say bad things for fear they will lose out. We at StockStory do not suffer from such conflicts of interest, so we’ll always tell it like it is.