
Lindblad Expeditions (LIND)
Lindblad Expeditions is up against the odds. Its negative returns on capital show it destroyed shareholder value by losing money.― StockStory Analyst Team
1. News


2. Summary
Why We Think Lindblad Expeditions Will Underperform
Founded by explorer Sven-Olof Lindblad in 1979, Lindblad Expeditions (NASDAQ:LIND) offers cruising experiences to remote destinations in partnership with National Geographic.
- Lackluster 16.4% annual revenue growth over the last two years indicates the company is losing ground to competitors
- Operating margin falls short of the industry average, and the smaller profit dollars make it harder to react to unexpected market developments
- Ability to fund investments or reward shareholders with increased buybacks or dividends is restricted by its weak free cash flow margin of 8.7% for the last two years


Lindblad Expeditions doesn’t fulfill our quality requirements. We believe there are better opportunities elsewhere.
Why There Are Better Opportunities Than Lindblad Expeditions


Lindblad Expeditions’s stock price of $17.19 implies a valuation ratio of 125.9x forward P/E. The current multiple is quite expensive, especially for the fundamentals of the business.
We prefer to invest in similarly-priced but higher-quality companies with superior earnings growth.
3. Lindblad Expeditions (LIND) Research Report: Q4 CY2025 Update
Cruise and exploration company Lindblad Expeditions (NASDAQ:LIND) reported Q4 CY2025 results topping the market’s revenue expectations, with sales up 23.3% year on year to $183.2 million. The company expects the full year’s revenue to be around $825 million, close to analysts’ estimates. Its GAAP loss of $0.45 per share was 38% below analysts’ consensus estimates.
Lindblad Expeditions (LIND) Q4 CY2025 Highlights:
- Revenue: $183.2 million vs analyst estimates of $167.7 million (23.3% year-on-year growth, 9.3% beat)
- EPS (GAAP): -$0.45 vs analyst expectations of -$0.33 (38% miss)
- Adjusted EBITDA: $14.15 million vs analyst estimates of $9.93 million (7.7% margin, 42.5% beat)
- EBITDA guidance for the upcoming financial year 2026 is $135 million at the midpoint, below analyst estimates of $136.8 million
- Operating Margin: -3%, down from -1.3% in the same quarter last year
- Free Cash Flow was $3.48 million, up from -$8.19 million in the same quarter last year
- Market Capitalization: $1.15 billion
Company Overview
Founded by explorer Sven-Olof Lindblad in 1979, Lindblad Expeditions (NASDAQ:LIND) offers cruising experiences to remote destinations in partnership with National Geographic.
The company operates a fleet of small, nimble ships, uniquely equipped to navigate in remote and environmentally sensitive locations such as Antarctica. These vessels, often developed in partnership with the National Geographic Society, are designed to bring guests closer to the world's most pristine and hard-to-reach places, like the polar regions, the Galapagos Islands, and other unique global destinations.
The company's collaboration with National Geographic brings an educational dimension to the expeditions, featuring expert naturalists, scientists, and photographers who provide guests with in-depth, hands-on exploration and knowledge-sharing opportunities.
4. Consumer Discretionary - Travel and Vacation Providers
The Consumer Discretionary sector, by definition, is made up of companies selling non-essential goods and services. When economic conditions deteriorate or tastes shift, consumers can easily cut back or eliminate these purchases. For long-term investors with five-year holding periods, this creates a structural challenge: the sector is inherently hit-driven, with low switching costs and fickle customers. As a result, only a handful of companies can reliably grow demand and compound earnings over long periods, which is why our bar is high and High Quality ratings are rare.
Travel and vacation providers operate tour packages, cruise lines, online travel agencies, and vacation rental platforms, connecting consumers with leisure and business travel experiences. Tailwinds include robust post-pandemic travel demand, a consumer preference shift toward experiences over goods, and technology-enabled personalization improving conversion and loyalty. However, headwinds are significant: the industry is acutely sensitive to macroeconomic cycles, geopolitical instability, and fuel price volatility. Low switching costs mean fierce price competition, while capacity additions in segments like cruises can lead to oversupply. Regulatory burdens, weather disruptions, and public health risks further create episodic but potentially severe demand shocks.
The company's primary competitors include Hurtigruten Group (OTCMKTS:HRGUF), Hapag-Lloyd Cruises (owned by TUI Group XETRA:TUI1), Silversea Cruises (owned by Royal Caribbean Group NYSE:RCL), and private companies Ponant and Quark Expeditions (owned by Travelopia).
5. Revenue Growth
Reviewing a company’s long-term sales performance reveals insights into its quality. Even a bad business can shine for one or two quarters, but a top-tier one grows for years. Over the last five years, Lindblad Expeditions grew its sales at an impressive 56.4% compounded annual growth rate. Its growth beat the average consumer discretionary company and shows its offerings resonate with customers.
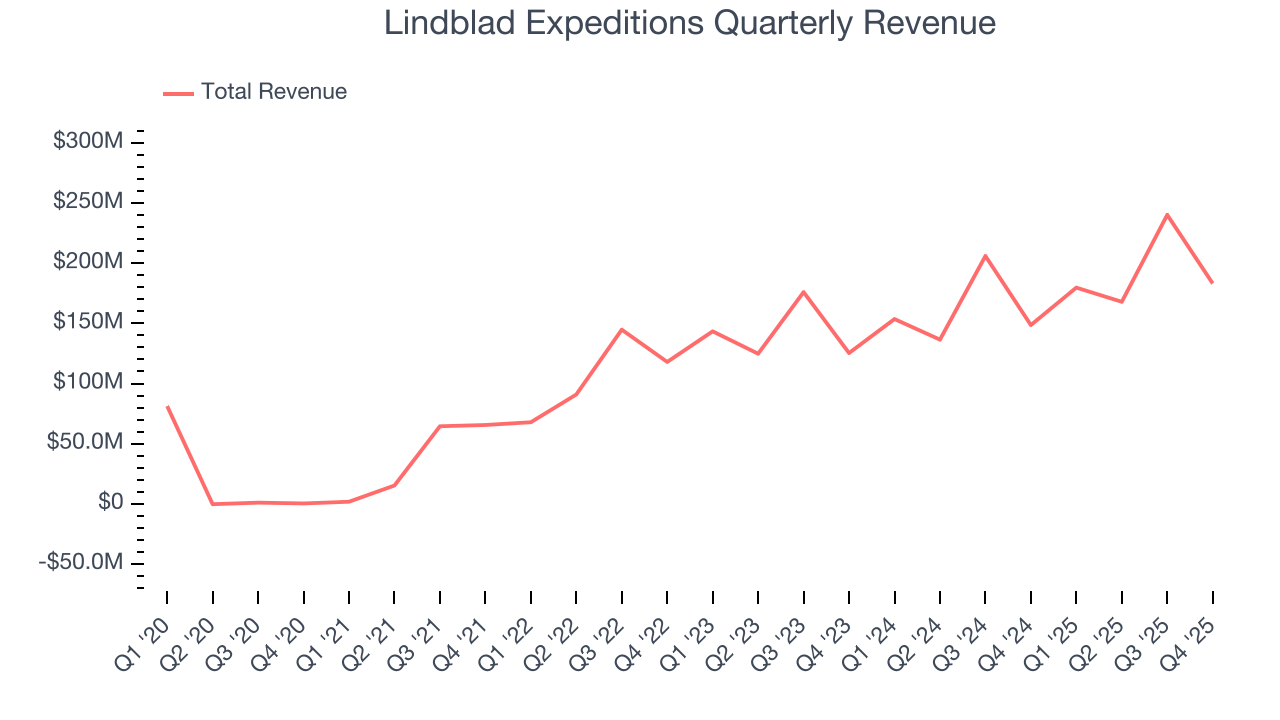
We at StockStory place the most emphasis on long-term growth, but within consumer discretionary, a stretched historical view may miss a company riding a successful new property or trend. Lindblad Expeditions’s recent performance shows its demand has slowed significantly as its annualized revenue growth of 16.4% over the last two years was well below its five-year trend. 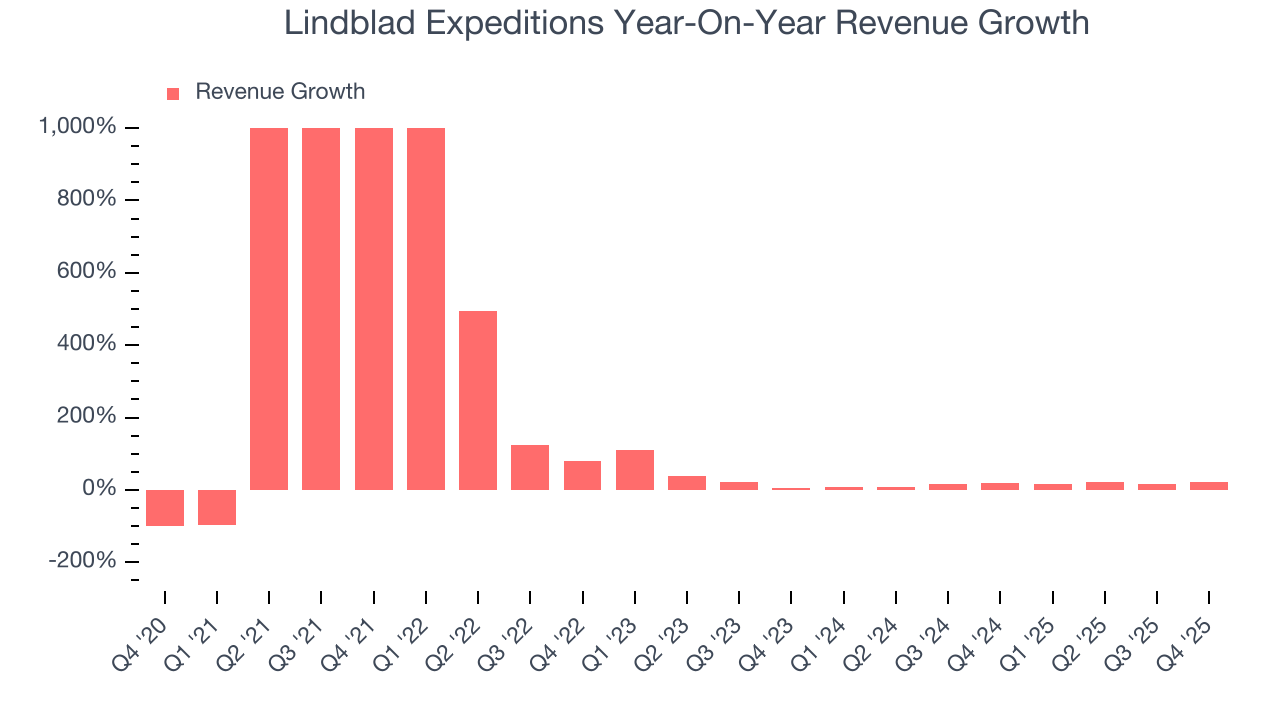
This quarter, Lindblad Expeditions reported robust year-on-year revenue growth of 23.3%, and its $183.2 million of revenue topped Wall Street estimates by 9.3%.
Looking ahead, sell-side analysts expect revenue to grow 6.8% over the next 12 months, a deceleration versus the last two years. This projection is underwhelming and indicates its products and services will face some demand challenges.
6. Operating Margin
Operating margin is an important measure of profitability as it shows the portion of revenue left after accounting for all core expenses – everything from the cost of goods sold to advertising and wages. It’s also useful for comparing profitability across companies with different levels of debt and tax rates because it excludes interest and taxes.
Lindblad Expeditions’s operating margin has risen over the last 12 months and averaged 5.2% over the last two years. The company’s higher efficiency is a breath of fresh air, but its suboptimal cost structure means it still sports inadequate profitability for a consumer discretionary business.
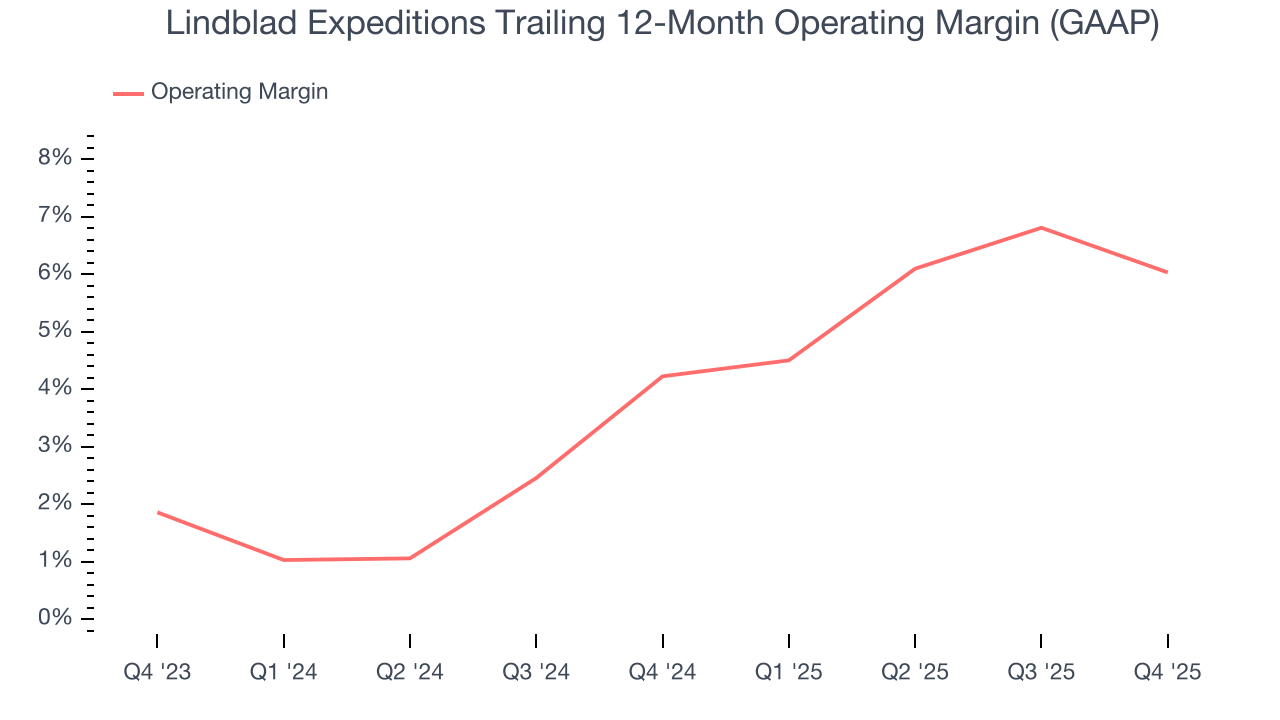
In Q4, Lindblad Expeditions generated an operating margin profit margin of negative 3%, down 1.7 percentage points year on year. This reduction is quite minuscule and indicates the company’s overall cost structure has been relatively stable.
7. Earnings Per Share
We track the long-term change in earnings per share (EPS) for the same reason as long-term revenue growth. Compared to revenue, however, EPS highlights whether a company’s growth is profitable.
Although Lindblad Expeditions’s full-year earnings are still negative, it reduced its losses and improved its EPS by 20.5% annually over the last five years. The next few quarters will be critical for assessing its long-term profitability.
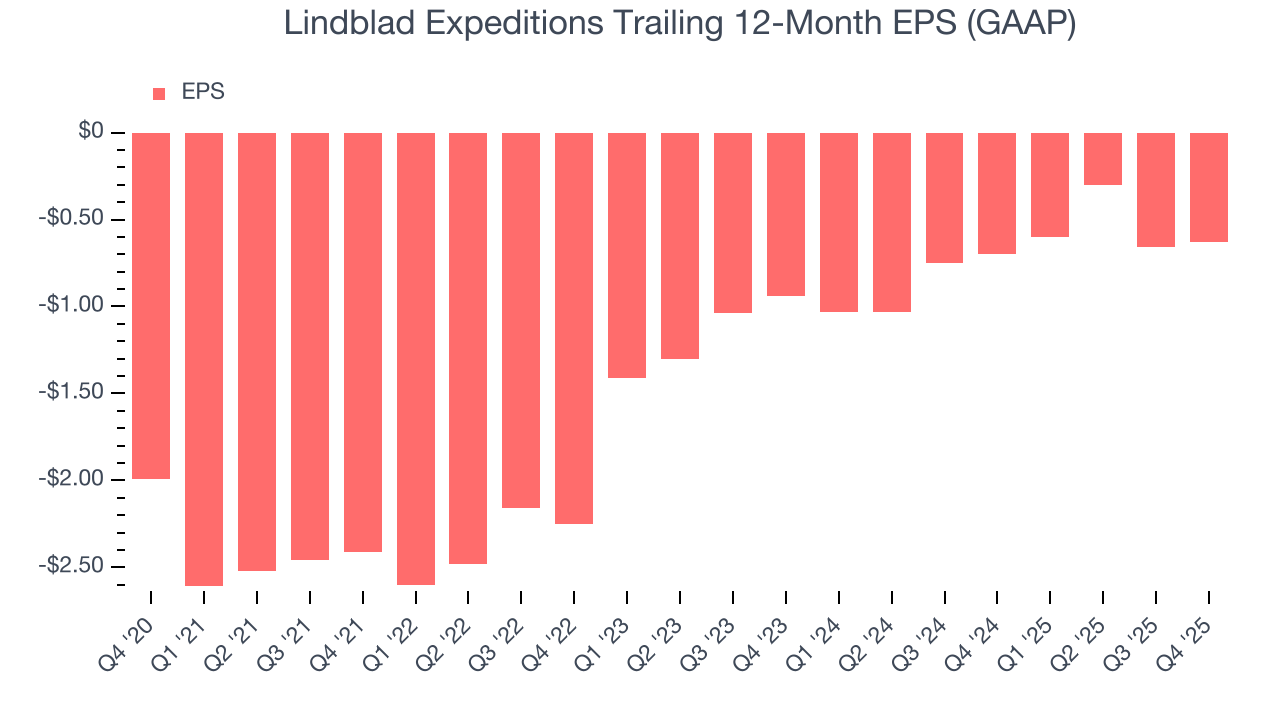
In Q4, Lindblad Expeditions reported EPS of negative $0.45, up from negative $0.48 in the same quarter last year. Despite growing year on year, this print missed analysts’ estimates. Over the next 12 months, Wall Street is optimistic. Analysts forecast Lindblad Expeditions’s full-year EPS of negative $0.63 will flip to positive $0.05.
8. Cash Is King
If you’ve followed StockStory for a while, you know we emphasize free cash flow. Why, you ask? We believe that in the end, cash is king, and you can’t use accounting profits to pay the bills.
Lindblad Expeditions has shown poor cash profitability over the last two years, giving the company limited opportunities to return capital to shareholders. Its free cash flow margin averaged 8.7%, lousy for a consumer discretionary business.
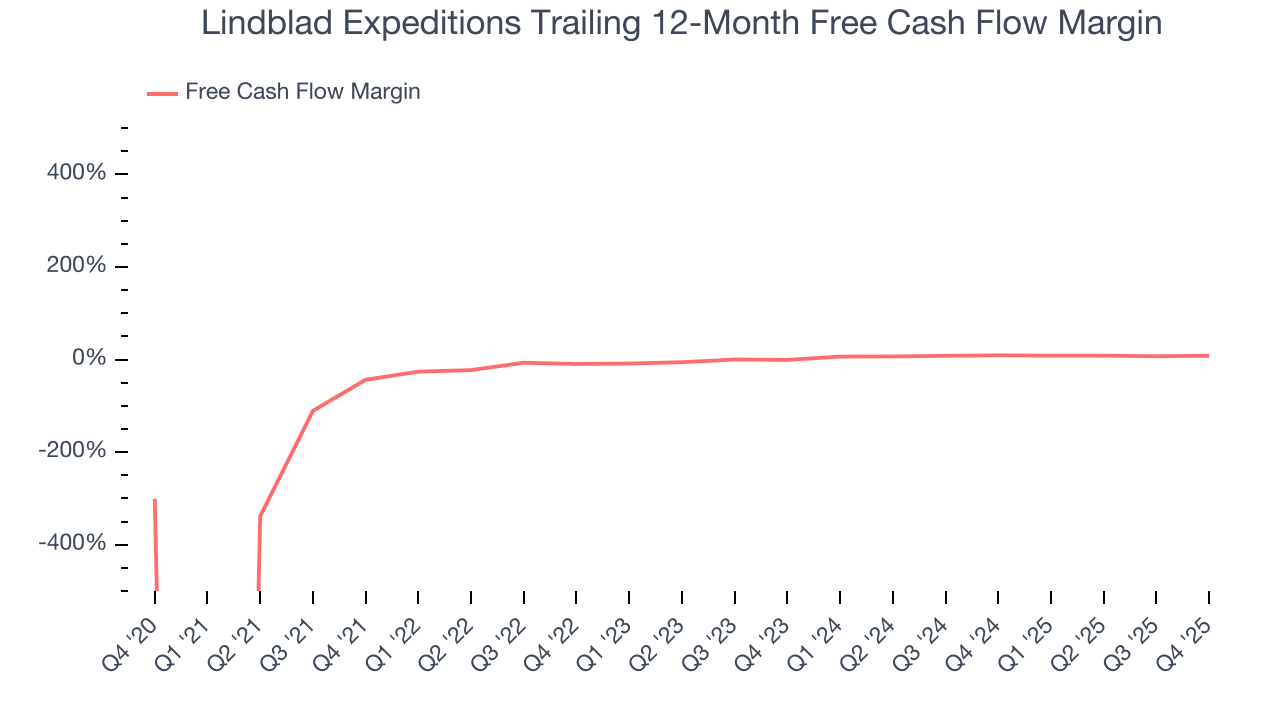
Lindblad Expeditions’s free cash flow clocked in at $3.48 million in Q4, equivalent to a 1.9% margin. Its cash flow turned positive after being negative in the same quarter last year, but we wouldn’t read too much into the short term because investment needs can be seasonal, leading to temporary swings. Long-term trends carry greater meaning.
Over the next year, analysts’ consensus estimates show they’re expecting Lindblad Expeditions’s free cash flow margin of 8.3% for the last 12 months to remain the same.
9. Return on Invested Capital (ROIC)
EPS and free cash flow tell us whether a company was profitable while growing its revenue. But was it capital-efficient? A company’s ROIC explains this by showing how much operating profit it makes compared to the money it has raised (debt and equity).
Lindblad Expeditions’s five-year average ROIC was negative 3.7%, meaning management lost money while trying to expand the business. Its returns were among the worst in the consumer discretionary sector.
We like to invest in businesses with high returns, but the trend in a company’s ROIC is what often surprises the market and moves the stock price. Over the last few years, Lindblad Expeditions’s ROIC has increased. This is a good sign, but we recognize its lack of profitable growth during the COVID era was the primary reason for the change.
10. Balance Sheet Assessment
Lindblad Expeditions reported $289.7 million of cash and $663.8 million of debt on its balance sheet in the most recent quarter. As investors in high-quality companies, we primarily focus on two things: 1) that a company’s debt level isn’t too high and 2) that its interest payments are not excessively burdening the business.
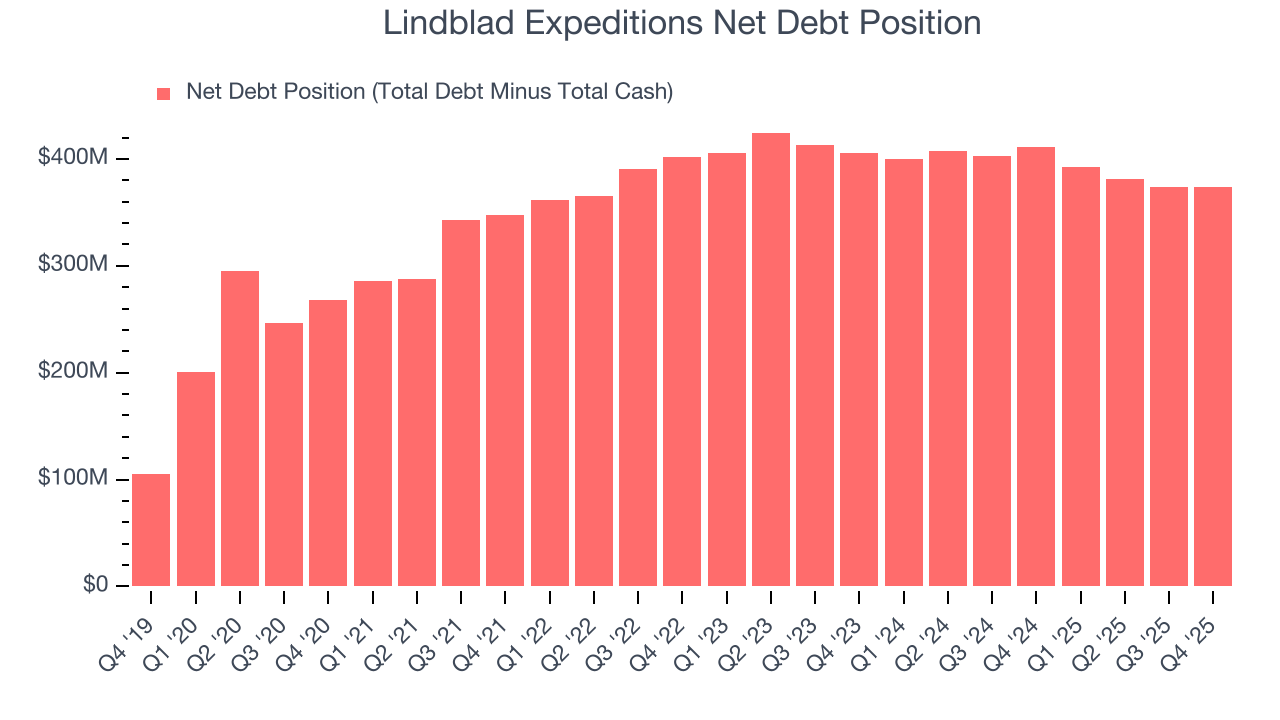
With $126.2 million of EBITDA over the last 12 months, we view Lindblad Expeditions’s 3.0× net-debt-to-EBITDA ratio as safe. We also see its $45.23 million of annual interest expenses as appropriate. The company’s profits give it plenty of breathing room, allowing it to continue investing in growth initiatives.
11. Key Takeaways from Lindblad Expeditions’s Q4 Results
We were impressed by how significantly Lindblad Expeditions blew past analysts’ EBITDA expectations this quarter. We were also excited its revenue outperformed Wall Street’s estimates by a wide margin. On the other hand, its EPS missed and its full-year EBITDA guidance fell slightly short of Wall Street’s estimates. Overall, this print was mixed but still had some key positives. The stock traded up 2% to $21.16 immediately after reporting.
12. Is Now The Time To Buy Lindblad Expeditions?
Updated: March 21, 2026 at 10:04 PM EDT
Before making an investment decision, investors should account for Lindblad Expeditions’s business fundamentals and valuation in addition to what happened in the latest quarter.
Lindblad Expeditions doesn’t pass our quality test. Although its revenue growth was impressive over the last five years, it’s expected to deteriorate over the next 12 months and its Forecasted free cash flow margin for next year suggests the company will fail to improve its cash conversion. And while the company’s projected EPS for the next year implies the company’s fundamentals will improve, the downside is its relatively low ROIC suggests management has struggled to find compelling investment opportunities.
Lindblad Expeditions’s P/E ratio based on the next 12 months is 125.9x. This valuation tells us it’s a bit of a market darling with a lot of good news priced in - we think there are better opportunities elsewhere.
Wall Street analysts have a consensus one-year price target of $23 on the company (compared to the current share price of $17.19).
Although the price target is bullish, readers should exercise caution because analysts tend to be overly optimistic. The firms they work for, often big banks, have relationships with companies that extend into fundraising, M&A advisory, and other rewarding business lines. As a result, they typically hesitate to say bad things for fear they will lose out. We at StockStory do not suffer from such conflicts of interest, so we’ll always tell it like it is.