
NetApp (NTAP)
We see potential in NetApp. Despite its slow growth, its highly profitable model gives it a margin of safety during times of stress.― StockStory Analyst Team
1. News


2. Summary
Why NetApp Is Interesting
Founded in 1992 as a pioneer in networked storage technology, NetApp (NASDAQ:NTAP) provides data storage and management solutions that help organizations store, protect, and optimize their data across on-premises data centers and public clouds.
- Excellent adjusted operating margin highlights the strength of its business model
- Impressive free cash flow profitability enables the company to fund new investments or reward investors with share buybacks/dividends, and its improved cash conversion implies it’s becoming a less capital-intensive business
- A downside is its sales trends were unexciting over the last five years as its 3.7% annual growth was below the typical business services company


NetApp shows some potential. If you’ve been itching to buy the stock, the valuation looks reasonable.
Why Is Now The Time To Buy NetApp?


NetApp is trading at $102.39 per share, or 11.8x forward P/E. NetApp’s current multiple might be below that of most business services peers, but we think this valuation is warranted after considering its business quality.
If you think the market is undervaluing the company, now could be a good time to build a position.
3. NetApp (NTAP) Research Report: Q4 CY2025 Update
Data storage company NetApp (NASDAQ:NTAP) beat Wall Street’s revenue expectations in Q4 CY2025, with sales up 4.4% year on year to $1.71 billion. On top of that, next quarter’s revenue guidance ($1.87 billion at the midpoint) was surprisingly good and 4% above what analysts were expecting. Its non-GAAP profit of $2.12 per share was 2.8% above analysts’ consensus estimates.
NetApp (NTAP) Q4 CY2025 Highlights:
- Revenue: $1.71 billion vs analyst estimates of $1.69 billion (4.4% year-on-year growth, 1.2% beat)
- Adjusted EPS: $2.12 vs analyst estimates of $2.06 (2.8% beat)
- Adjusted EBITDA: $579 million vs analyst estimates of $582.7 million (33.8% margin, 0.6% miss)
- Revenue Guidance for Q1 CY2026 is $1.87 billion at the midpoint, above analyst estimates of $1.8 billion
- Management slightly raised its full-year Adjusted EPS guidance to $7.97 at the midpoint
- Operating Margin: 25.3%, up from 22.1% in the same quarter last year
- Free Cash Flow Margin: 15.8%, down from 20.6% in the same quarter last year
- Market Capitalization: $20.18 billion
Company Overview
Founded in 1992 as a pioneer in networked storage technology, NetApp (NASDAQ:NTAP) provides data storage and management solutions that help organizations store, protect, and optimize their data across on-premises data centers and public clouds.
NetApp's business is organized into two main segments: Hybrid Cloud and Public Cloud. The Hybrid Cloud segment offers unified data storage solutions that help customers modernize their data centers with hardware and software that supports file, block, and object storage. Its flagship product is the ONTAP operating system, which powers NetApp's storage arrays and includes features like ransomware protection, data transport, and storage efficiency capabilities.
The company's hardware portfolio includes All-Flash FAS (AFF) systems for high-performance workloads, Fabric Attached Storage (FAS) for balanced performance and capacity, and StorageGRID for object storage. These systems serve various customer needs from high-speed transaction processing to large-scale data archives.
In the Public Cloud segment, NetApp offers cloud storage services natively integrated with major cloud providers. These include Azure NetApp Files on Microsoft Azure, Amazon FSx for NetApp ONTAP on AWS, and Google Cloud NetApp Volumes. The company also provides CloudOps solutions like Cloud Insights for infrastructure monitoring and Spot by NetApp for cloud cost optimization.
NetApp generates revenue through hardware sales, software licenses, subscription services, and professional services. A healthcare provider might use NetApp's all-flash storage arrays to host patient records and medical imaging data, with automatic backup to the cloud for disaster recovery. A financial services firm might leverage NetApp's cloud storage to analyze market data while maintaining compliance with data sovereignty regulations.
The company sells through both direct sales channels and an ecosystem of partners, including value-added resellers, system integrators, and cloud providers. This partner network is crucial to NetApp's go-to-market strategy, with indirect channels accounting for approximately three-quarters of its revenue.
4. Hardware & Infrastructure
The Hardware & Infrastructure sector will be buoyed by demand related to AI adoption, cloud computing expansion, and the need for more efficient data storage and processing solutions. Companies with tech offerings such as servers, switches, and storage solutions are well-positioned in our new hybrid working and IT world. On the other hand, headwinds include ongoing supply chain disruptions, rising component costs, and intensifying competition from cloud-native and hyperscale providers reducing reliance on traditional hardware. Additionally, regulatory scrutiny over data sovereignty, cybersecurity standards, and environmental sustainability in hardware manufacturing could increase compliance costs.
NetApp competes with Dell Technologies (NYSE:DELL) through its storage division Dell EMC, Pure Storage (NYSE:PSTG) in the all-flash storage market, and Hewlett Packard Enterprise (NYSE:HPE). In cloud storage, it faces competition from cloud providers' native storage offerings from Amazon (NASDAQ:AMZN), Microsoft (NASDAQ:MSFT), and Google (NASDAQ:GOOGL).
5. Revenue Growth
Examining a company’s long-term performance can provide clues about its quality. Any business can experience short-term success, but top-performing ones enjoy sustained growth for years.
With $6.71 billion in revenue over the past 12 months, NetApp is one of the larger companies in the business services industry and benefits from a well-known brand that influences purchasing decisions. However, its scale is a double-edged sword because it’s harder to find incremental growth when you’ve penetrated most of the market. For NetApp to boost its sales, it likely needs to adjust its prices, launch new offerings, or lean into foreign markets.
As you can see below, NetApp’s sales grew at a tepid 3.7% compounded annual growth rate over the last five years. This shows it failed to generate demand in any major way and is a rough (but perhaps misleading) starting point for our analysis.
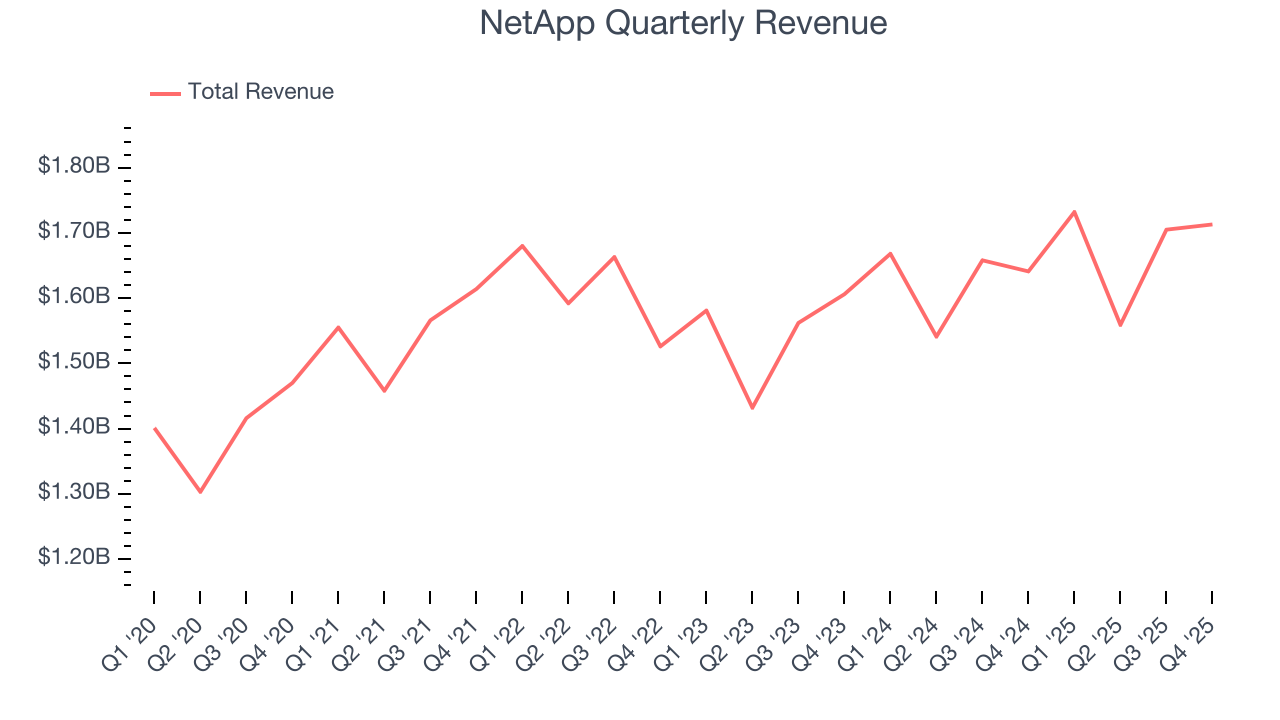
We at StockStory place the most emphasis on long-term growth, but within business services, a half-decade historical view may miss recent innovations or disruptive industry trends. NetApp’s annualized revenue growth of 4.2% over the last two years aligns with its five-year trend, suggesting its demand was consistently weak. 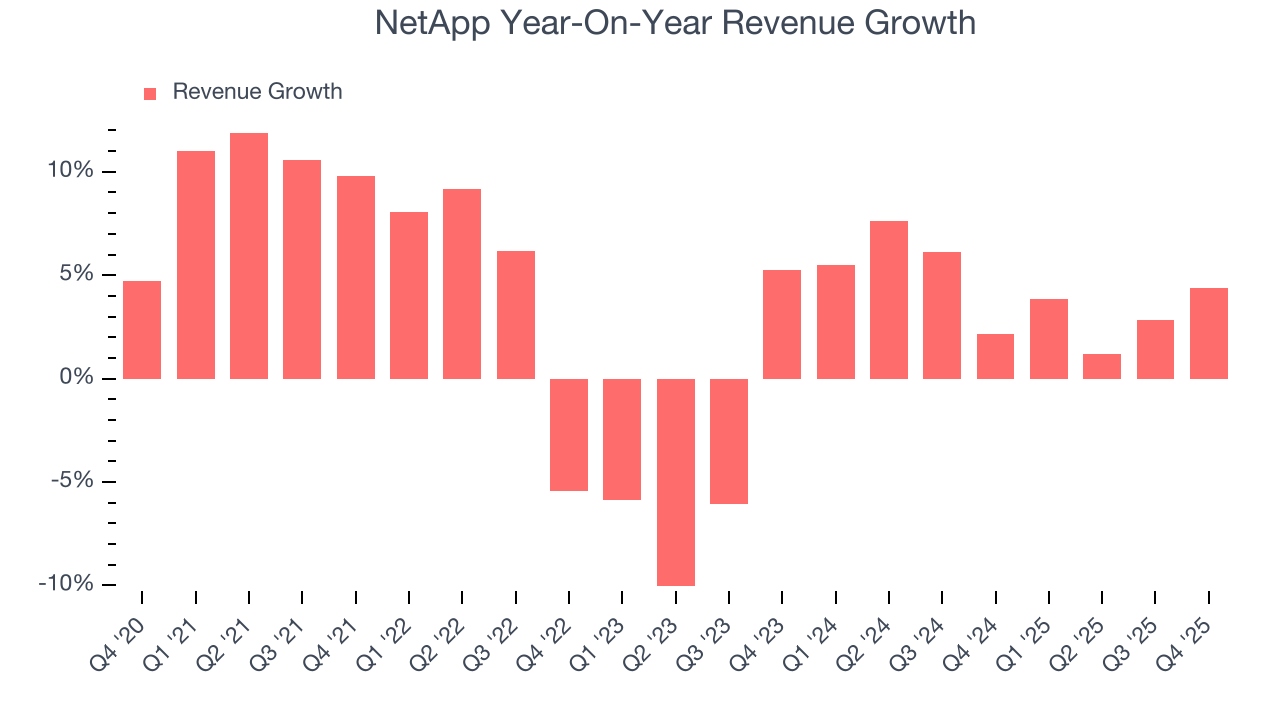
This quarter, NetApp reported modest year-on-year revenue growth of 4.4% but beat Wall Street’s estimates by 1.2%. Company management is currently guiding for a 8% year-on-year increase in sales next quarter.
Looking further ahead, sell-side analysts expect revenue to grow 4.5% over the next 12 months, similar to its two-year rate. This projection is underwhelming and indicates its newer products and services will not lead to better top-line performance yet. At least the company is tracking well in other measures of financial health.
6. Operating Margin
Operating margin is an important measure of profitability as it shows the portion of revenue left after accounting for all core expenses – everything from the cost of goods sold to advertising and wages. It’s also useful for comparing profitability across companies with different levels of debt and tax rates because it excludes interest and taxes.
NetApp’s operating margin has been trending up over the last 12 months and averaged 19.7% over the last five years. On top of that, its profitability was elite for a business services business thanks to its efficient cost structure and economies of scale.
Analyzing the trend in its profitability, NetApp’s operating margin might fluctuated slightly but has generally stayed the same over the last five years. This raises questions about the company’s expense base because its revenue growth should have given it leverage on its fixed costs, resulting in better economies of scale and profitability.
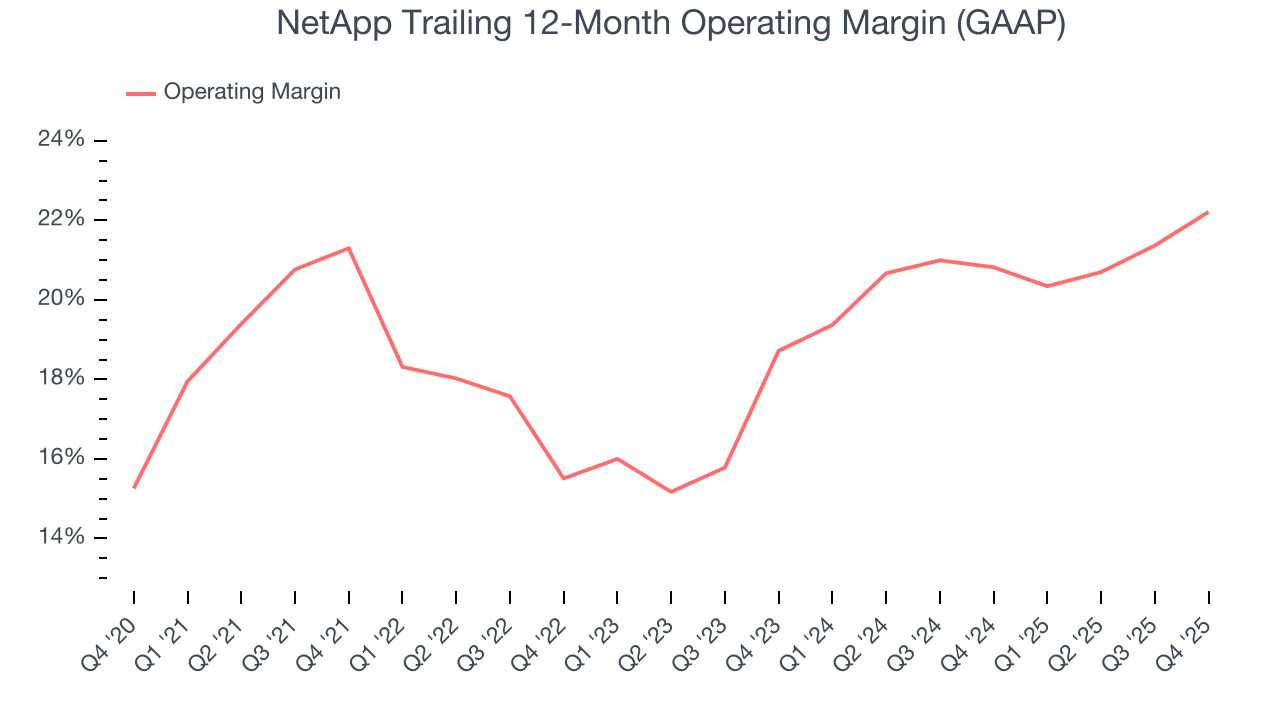
In Q4, NetApp generated an operating margin profit margin of 25.3%, up 3.3 percentage points year on year. This increase was a welcome development and shows it was more efficient.
7. Earnings Per Share
Revenue trends explain a company’s historical growth, but the long-term change in earnings per share (EPS) points to the profitability of that growth – for example, a company could inflate its sales through excessive spending on advertising and promotions.
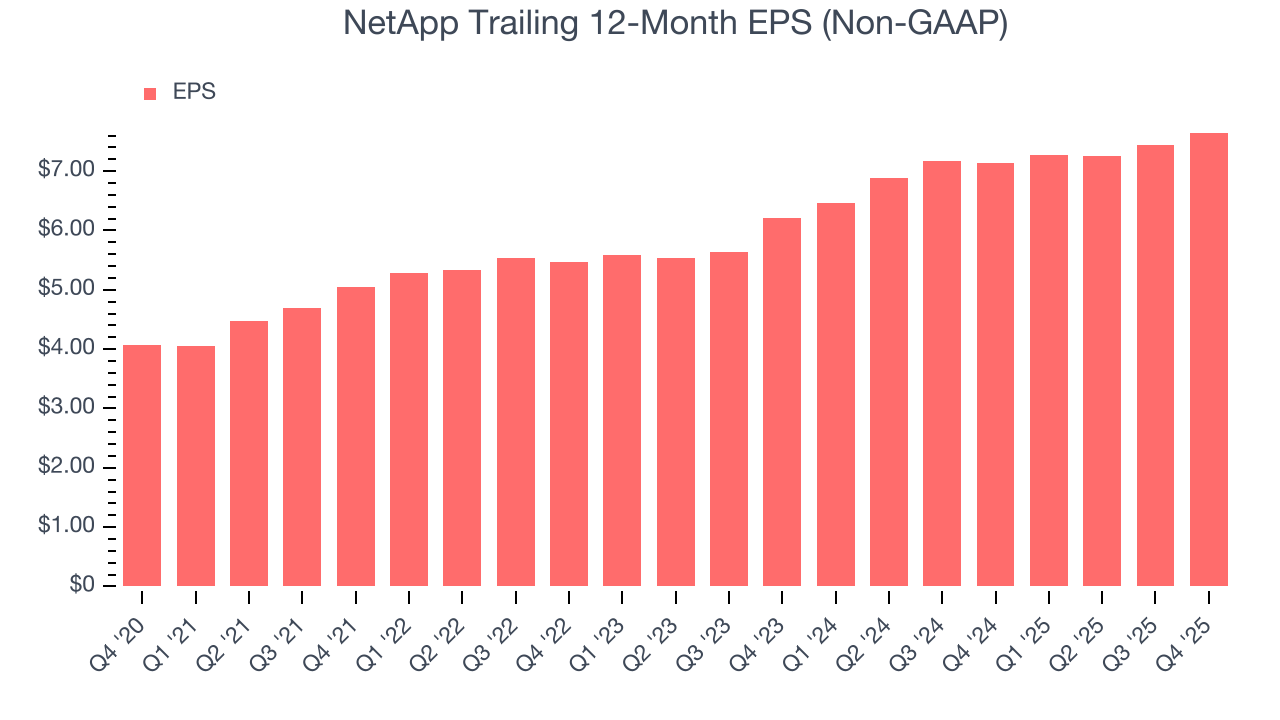
NetApp’s EPS grew at a spectacular 13.5% compounded annual growth rate over the last five years, higher than its 3.7% annualized revenue growth. This tells us the company became more profitable on a per-share basis as it expanded.
Like with revenue, we analyze EPS over a shorter period to see if we are missing a change in the business.
For NetApp, its two-year annual EPS growth of 11% was lower than its five-year trend. This wasn’t great, but at least the company was successful in other measures of financial health.
In Q4, NetApp reported adjusted EPS of $2.12, up from $1.91 in the same quarter last year. This print beat analysts’ estimates by 2.8%. Over the next 12 months, Wall Street expects NetApp’s full-year EPS of $7.65 to grow 9.6%.
8. Cash Is King
Although earnings are undoubtedly valuable for assessing company performance, we believe cash is king because you can’t use accounting profits to pay the bills.
NetApp has shown terrific cash profitability, enabling it to reinvest, return capital to investors, and stay ahead of the competition while maintaining an ample cushion. The company’s free cash flow margin was among the best in the business services sector, averaging 19.4% over the last five years.
Taking a step back, we can see that NetApp’s margin expanded by 5.2 percentage points during that time. This is encouraging, and we can see it became a less capital-intensive business because its free cash flow profitability rose while its operating profitability was flat.
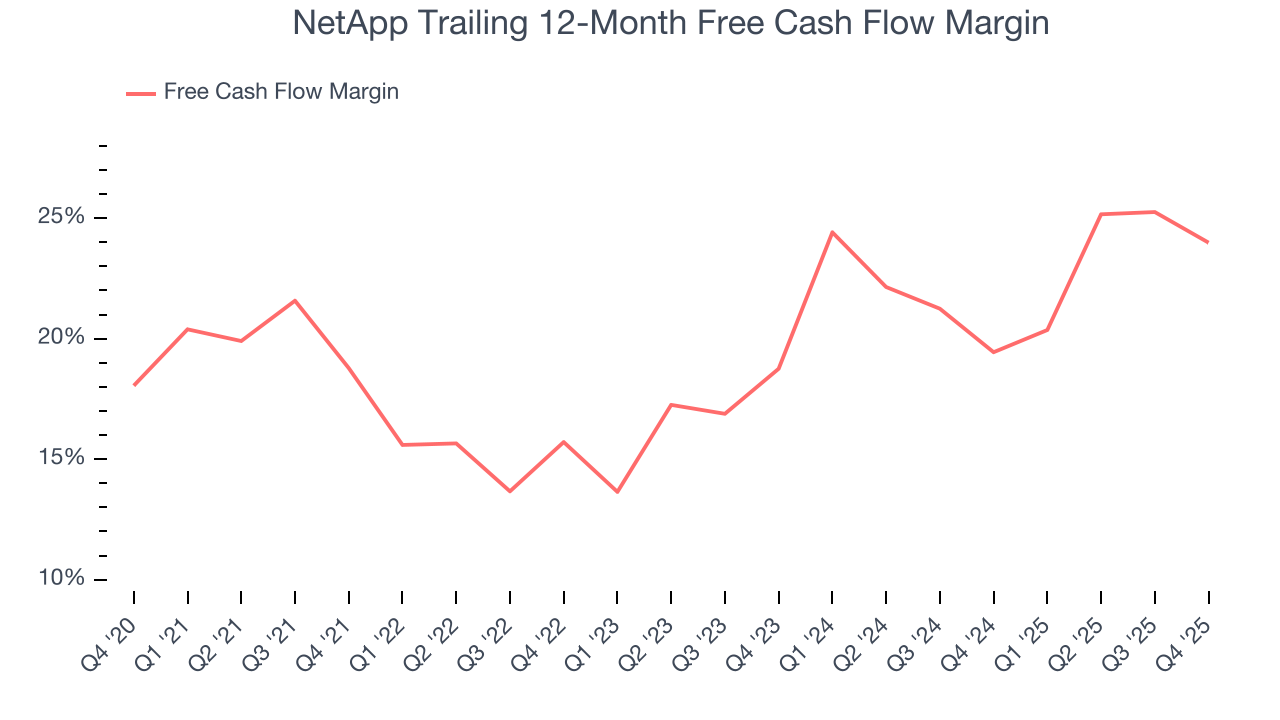
NetApp’s free cash flow clocked in at $271 million in Q4, equivalent to a 15.8% margin. The company’s cash profitability regressed as it was 4.8 percentage points lower than in the same quarter last year, prompting us to pay closer attention. Short-term fluctuations typically aren’t a big deal because investment needs can be seasonal, but we’ll be watching to see if the trend extrapolates into future quarters.
9. Balance Sheet Assessment
One of the best ways to mitigate bankruptcy risk is to hold more cash than debt.
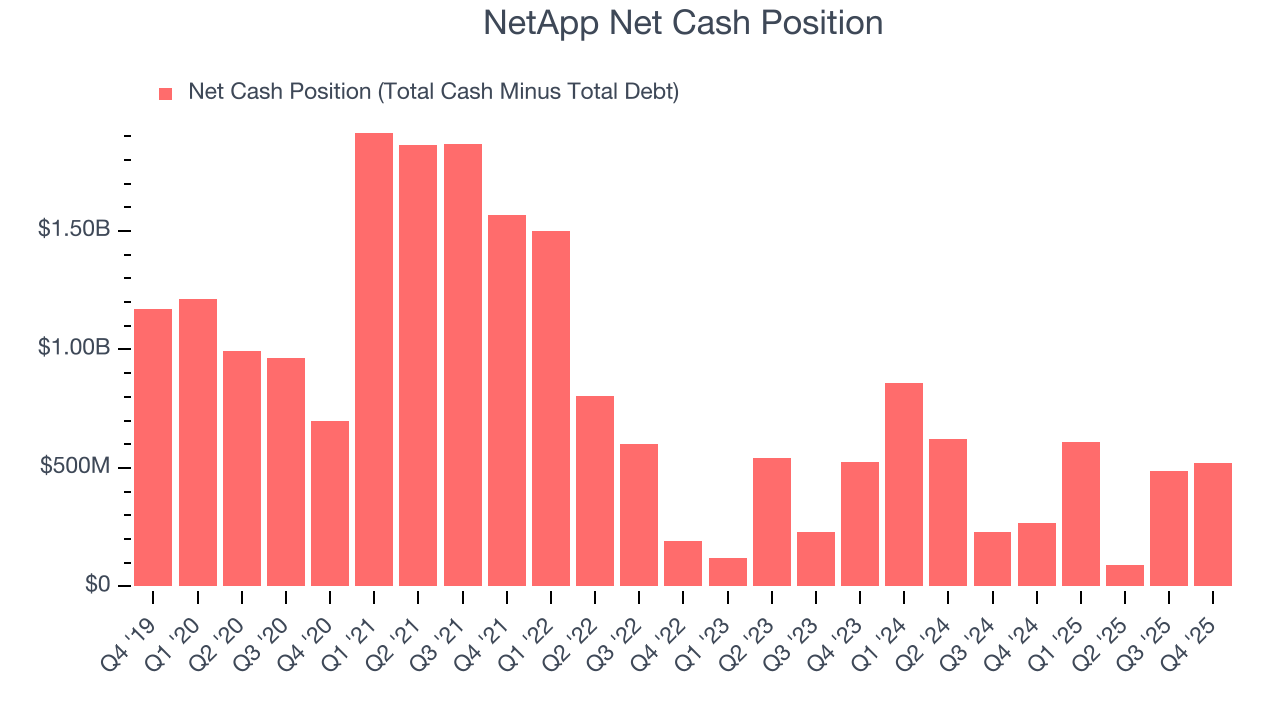
NetApp is a profitable, well-capitalized company with $3.01 billion of cash and $2.49 billion of debt on its balance sheet. This $522 million net cash position is 2.6% of its market cap and gives it the freedom to borrow money, return capital to shareholders, or invest in growth initiatives. Leverage is not an issue here.
10. Key Takeaways from NetApp’s Q4 Results
We were impressed by NetApp’s optimistic revenue guidance for next quarter, which blew past analysts’ expectations. We were also glad its full-year revenue guidance slightly exceeded Wall Street’s estimates. Overall, we think this was a decent quarter with some key metrics above expectations. The stock traded up 1.7% to $100.88 immediately following the results.
11. Is Now The Time To Buy NetApp?
Updated: March 17, 2026 at 12:57 AM EDT
When considering an investment in NetApp, investors should account for its valuation and business qualities as well as what’s happened in the latest quarter.
We think NetApp is a solid business. Although its revenue growth was uninspiring over the last five years, its growth over the next 12 months is expected to be higher. On top of that, NetApp’s powerful free cash flow generation enables it to stay ahead of the competition through consistent reinvestment of profits, and the company’s impressive operating margins show it has a highly efficient business model.
NetApp’s P/E ratio based on the next 12 months is 11.8x. Looking at the business services space right now, NetApp trades at a compelling valuation. If you’re a fan of the business and management team, now is a good time to scoop up some shares.
Wall Street analysts have a consensus one-year price target of $117.93 on the company (compared to the current share price of $102.39), implying they see 15.2% upside in buying NetApp in the short term.