Super Micro (SMCI)
Super Micro is a world-class company. Its exceptional revenue growth and returns on capital show it can expand quickly and profitably.― StockStory Analyst Team
1. News


2. Summary
Why We Like Super Micro
Founded in Silicon Valley in 1993 and known for its modular "building block" approach to server design, Super Micro Computer (NASDAQ:SMCI) designs and manufactures high-performance, energy-efficient server and storage systems for data centers, cloud computing, AI, and edge computing applications.
- Annual revenue growth of 53.8% over the last five years was superb and indicates its market share increased during this cycle
- Earnings per share grew by 45.5% annually over the last five years and trumped its peers
- Dominant market position is represented by its $28.06 billion in revenue and gives it fixed cost leverage when sales grow


Super Micro is a market leader. The price seems fair based on its quality, and we believe now is a good time to buy the stock.
Why Is Now The Time To Buy Super Micro?


At $30.69 per share, Super Micro trades at 12.7x forward P/E. This multiple is lower than most business services companies, and we think the stock is a deal when considering its quality characteristics.
Entry price matters much less than business quality when investing for the long term, but hey, it certainly doesn’t hurt to get in at an attractive price.
3. Super Micro (SMCI) Research Report: Q4 CY2025 Update
Server solutions provider Super Micro (NASDAQ:SMCI) beat Wall Street’s revenue expectations in Q4 CY2025, with sales up 123% year on year to $12.68 billion. On top of that, next quarter’s revenue guidance ($12.3 billion at the midpoint) was surprisingly good and 20.5% above what analysts were expecting. Its non-GAAP profit of $0.69 per share was 41.4% above analysts’ consensus estimates.
Super Micro (SMCI) Q4 CY2025 Highlights:
- Revenue: $12.68 billion vs analyst estimates of $10.44 billion (123% year-on-year growth, 21.5% beat)
- Adjusted EPS: $0.69 vs analyst estimates of $0.49 (41.4% beat)
- Adjusted EBITDA: $628.6 million vs analyst estimates of $440.9 million (5% margin, 42.6% beat)
- The company lifted its revenue guidance for the full year to $40 billion at the midpoint from $36 billion, a 11.1% increase
- Adjusted EPS guidance for Q1 CY2026 is $0.60 at the midpoint, above analyst estimates of $0.52
- Operating Margin: 3.7%, down from 6.5% in the same quarter last year
- Free Cash Flow was -$45.12 million compared to -$267.3 million in the same quarter last year
- Market Capitalization: $17.74 billion
Company Overview
Founded in Silicon Valley in 1993 and known for its modular "building block" approach to server design, Super Micro Computer (NASDAQ:SMCI) designs and manufactures high-performance, energy-efficient server and storage systems for data centers, cloud computing, AI, and edge computing applications.
Super Micro Computer's business revolves around its "Total IT Solutions" approach, offering complete server systems, storage solutions, networking devices, and management software. The company differentiates itself through its modular Server Building Block Solutions architecture, which allows for rapid customization and deployment of servers tailored to specific customer needs.
The company's product portfolio includes several specialized server families: SuperBlade systems that share computing resources to save space and power; Twin family servers with multiple nodes for density and efficiency; GPU-accelerated systems for AI workloads; and edge computing systems for 5G and IoT applications. These systems can be configured with various processors, memory, storage, and networking options to meet diverse computing requirements.
A key competitive advantage is Super Micro's resource-saving architecture, which allows components like CPUs and memory to be refreshed independently. This approach reduces e-waste and lowers total cost of ownership for customers, as they can upgrade specific components rather than replacing entire systems.
Super Micro serves a diverse customer base across enterprise data centers, cloud service providers, and AI research organizations. For example, a cloud provider might use Super Micro's high-density blade servers to maximize computing power while minimizing space and energy consumption in their data centers. An AI research lab might deploy Super Micro's GPU-accelerated systems to train complex machine learning models.
The company generates revenue through direct sales to large enterprises and cloud providers, as well as through distributors, value-added resellers, and system integrators. Super Micro maintains manufacturing facilities in the United States, Taiwan, and the Netherlands, allowing it to serve customers globally while managing its supply chain efficiently.
4. Hardware & Infrastructure
The Hardware & Infrastructure sector will be buoyed by demand related to AI adoption, cloud computing expansion, and the need for more efficient data storage and processing solutions. Companies with tech offerings such as servers, switches, and storage solutions are well-positioned in our new hybrid working and IT world. On the other hand, headwinds include ongoing supply chain disruptions, rising component costs, and intensifying competition from cloud-native and hyperscale providers reducing reliance on traditional hardware. Additionally, regulatory scrutiny over data sovereignty, cybersecurity standards, and environmental sustainability in hardware manufacturing could increase compliance costs.
Super Micro Computer competes with major server and data center hardware providers including Dell Technologies (NYSE:DELL), Hewlett Packard Enterprise (NYSE:HPE), Lenovo Group (OTC:LNVGY), and Inspur (OTC:ISPNF). In the specialized high-performance computing and AI server market, it also faces competition from NVIDIA (NASDAQ:NVDA) with its DGX systems.
5. Revenue Growth
Examining a company’s long-term performance can provide clues about its quality. Any business can have short-term success, but a top-tier one grows for years.
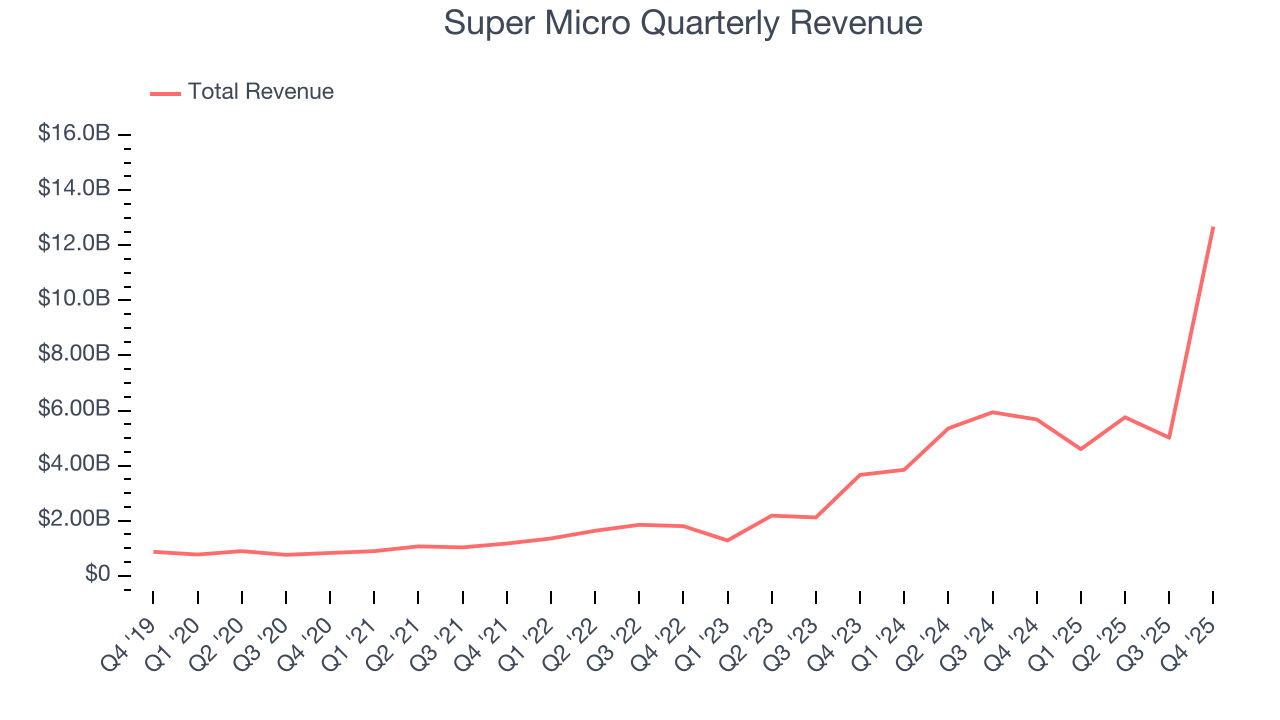
With $28.06 billion in revenue over the past 12 months, Super Micro is a behemoth in the business services sector and benefits from economies of scale, giving it an edge in distribution. This also enables it to gain more leverage on its fixed costs than smaller competitors and the flexibility to offer lower prices.
As you can see below, Super Micro’s 53.8% annualized revenue growth over the last five years was incredible. This is a great starting point for our analysis because it shows Super Micro’s demand was higher than many business services companies.
Long-term growth is the most important, but within business services, a half-decade historical view may miss new innovations or demand cycles. Super Micro’s annualized revenue growth of 74.1% over the last two years is above its five-year trend, suggesting its demand was strong and recently accelerated. 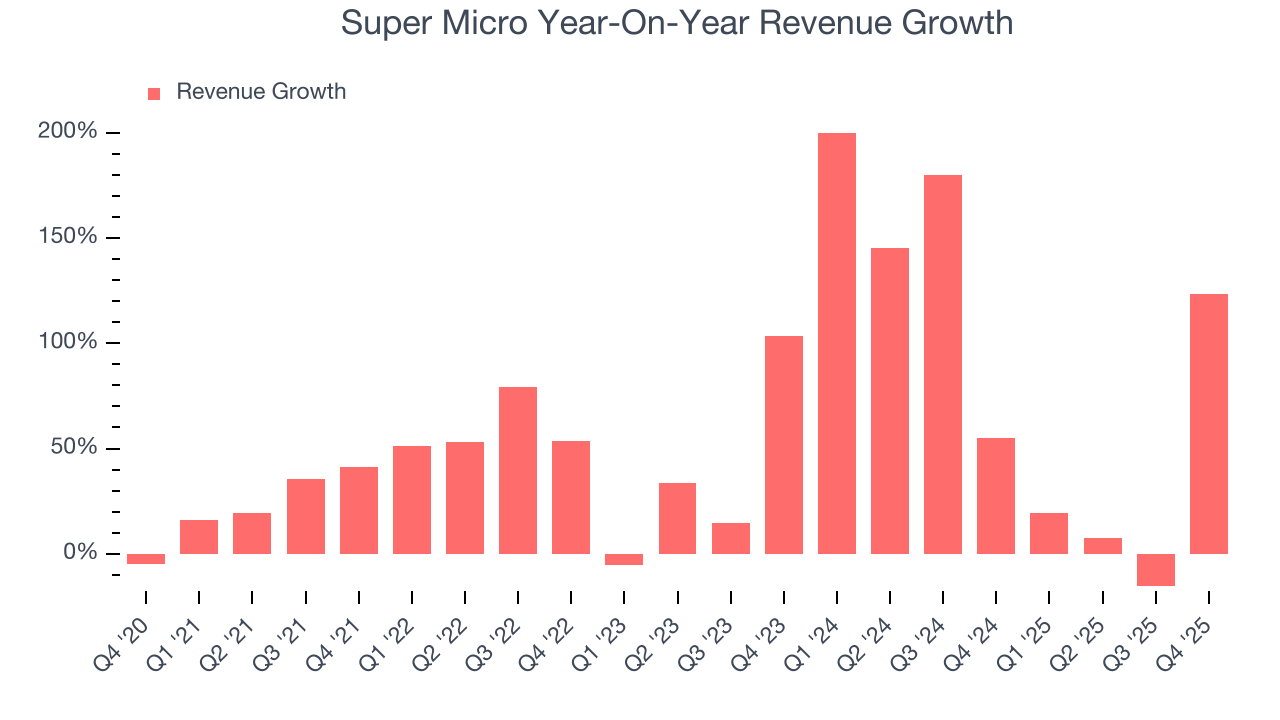
This quarter, Super Micro reported magnificent year-on-year revenue growth of 123%, and its $12.68 billion of revenue beat Wall Street’s estimates by 21.5%. Company management is currently guiding for a 167% year-on-year increase in sales next quarter.
Looking further ahead, sell-side analysts expect revenue to grow 51.4% over the next 12 months, a deceleration versus the last two years. Still, this projection is eye-popping given its scale and implies the market is baking in success for its products and services.
6. Operating Margin
Super Micro’s operating margin might fluctuated slightly over the last 12 months but has remained more or less the same, averaging 6.2% over the last five years. This profitability was paltry for a business services business and caused by its suboptimal cost structure.
Analyzing the trend in its profitability, Super Micro’s operating margin might fluctuated slightly but has generally stayed the same over the last five years. This raises questions about the company’s expense base because its revenue growth should have given it leverage on its fixed costs, resulting in better economies of scale and profitability.
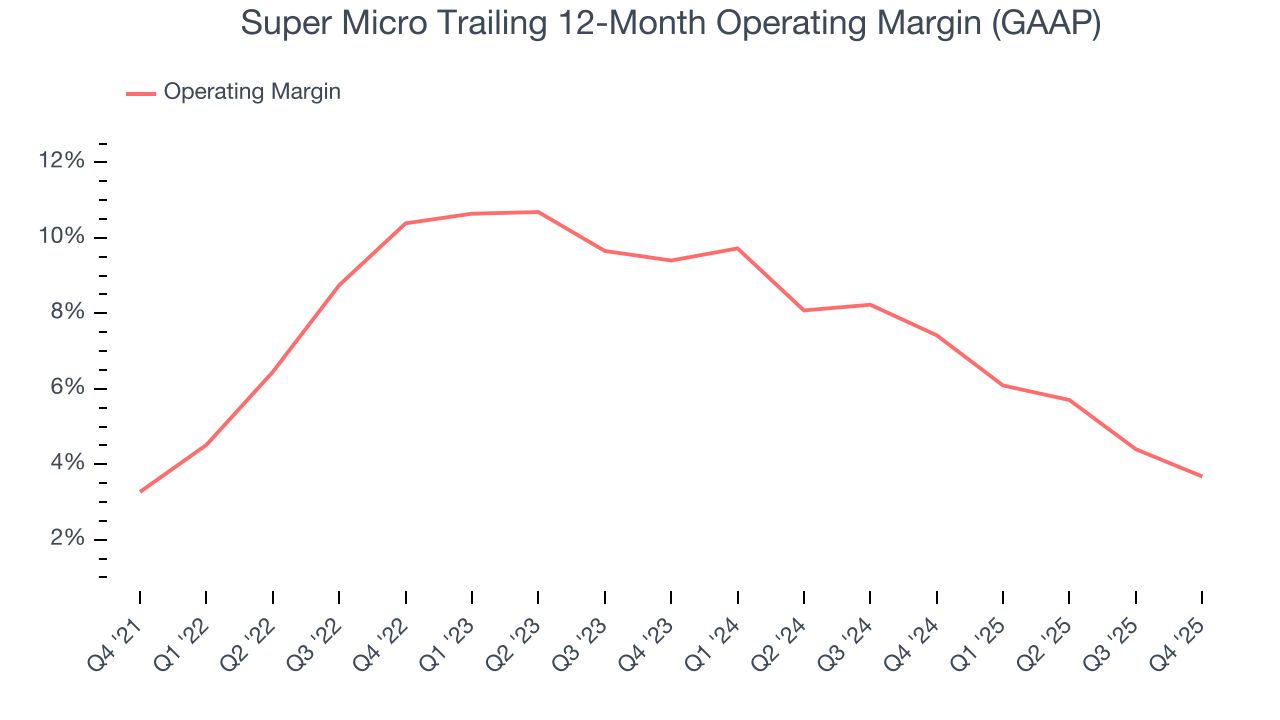
In Q4, Super Micro generated an operating margin profit margin of 3.7%, down 2.8 percentage points year on year. This contraction shows it was less efficient because its expenses grew faster than its revenue.
7. Earnings Per Share
Revenue trends explain a company’s historical growth, but the long-term change in earnings per share (EPS) points to the profitability of that growth – for example, a company could inflate its sales through excessive spending on advertising and promotions.
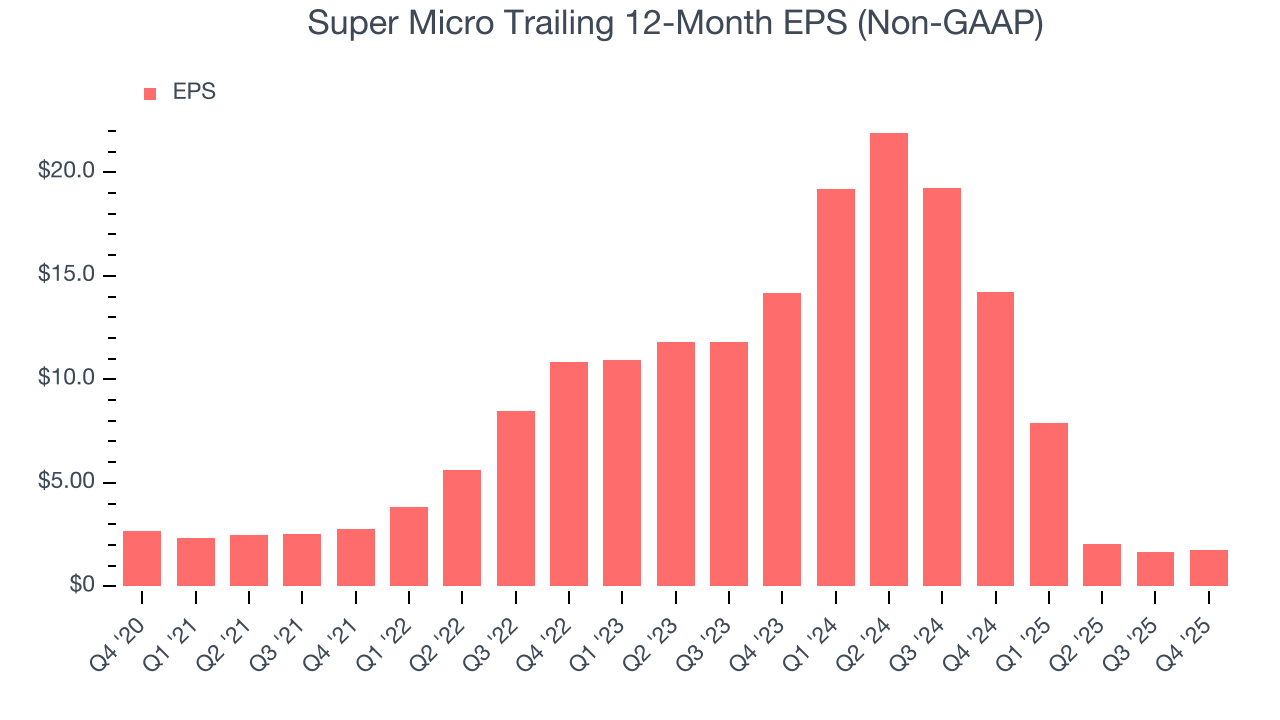
Sadly for Super Micro, its EPS declined by 8.2% annually over the last five years while its revenue grew by 53.8%. However, its operating margin didn’t change during this time, telling us that non-fundamental factors such as interest and taxes affected its ultimate earnings.
Like with revenue, we analyze EPS over a more recent period because it can provide insight into an emerging theme or development for the business.
For Super Micro, its two-year annual EPS declines of 64.7% show it’s continued to underperform. These results were bad no matter how you slice the data, but given it was successful in other measures of financial health, we’re hopeful Super Micro can generate earnings growth in the future.
In Q4, Super Micro reported adjusted EPS of $0.69, up from $0.60 in the same quarter last year. This print easily cleared analysts’ estimates, and shareholders should be content with the results. Over the next 12 months, Wall Street expects Super Micro’s full-year EPS of $1.76 to grow 45.7%.
8. Cash Is King
Free cash flow isn't a prominently featured metric in company financials and earnings releases, but we think it's telling because it accounts for all operating and capital expenses, making it tough to manipulate. Cash is king.
While Super Micro’s free cash flow broke even this quarter, the broader story hasn’t been so clean. Super Micro’s demanding reinvestments have drained its resources over the last five years, putting it in a pinch and limiting its ability to return capital to investors. Its free cash flow margin averaged negative 2.9%, meaning it lit $2.94 of cash on fire for every $100 in revenue.
Taking a step back, an encouraging sign is that Super Micro’s margin expanded by 8.9 percentage points during that time. The company’s improvement shows it’s heading in the right direction, and continued increases could help it achieve long-term cash profitability.
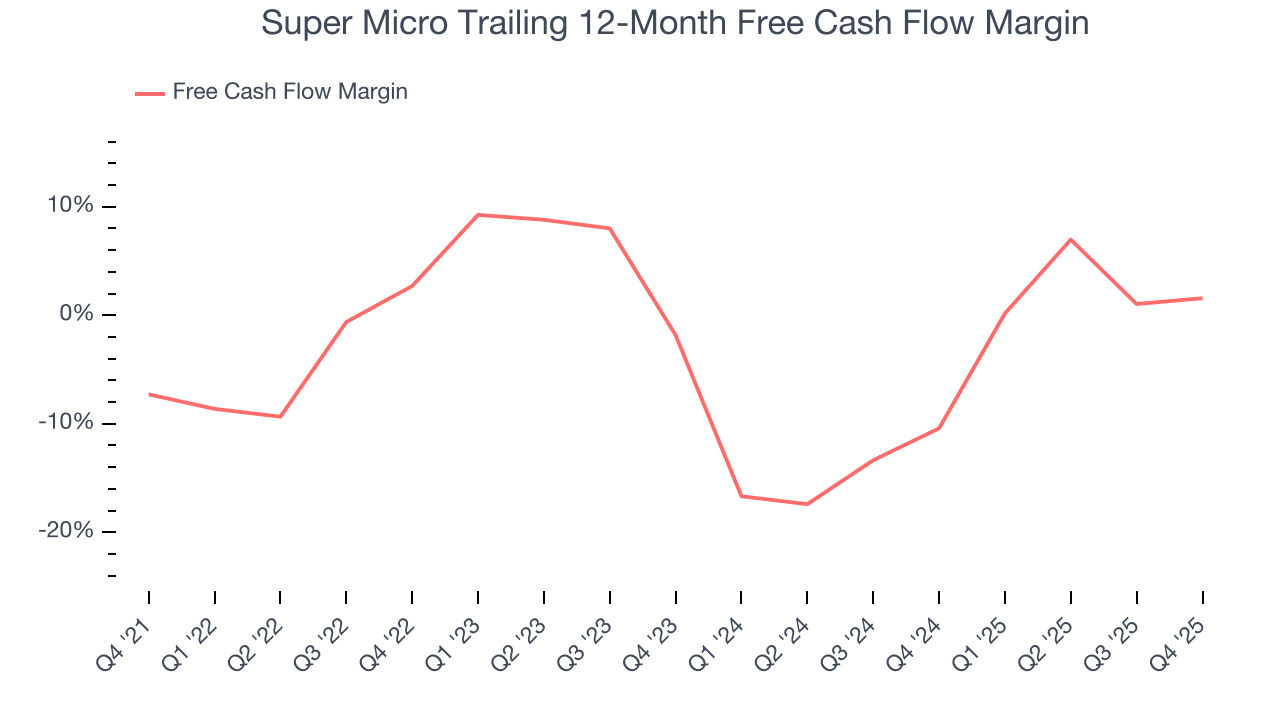
Super Micro broke even from a free cash flow perspective in Q4. This result was good as its margin was 4.4 percentage points higher than in the same quarter last year, building on its favorable historical trend.
9. Return on Invested Capital (ROIC)
EPS and free cash flow tell us whether a company was profitable while growing its revenue. But was it capital-efficient? A company’s ROIC explains this by showing how much operating profit it makes compared to the money it has raised (debt and equity).
Super Micro’s five-year average ROIC was 23.7%, placing it among the best business services companies. This illustrates its management team’s ability to invest in highly profitable ventures and produce tangible results for shareholders.
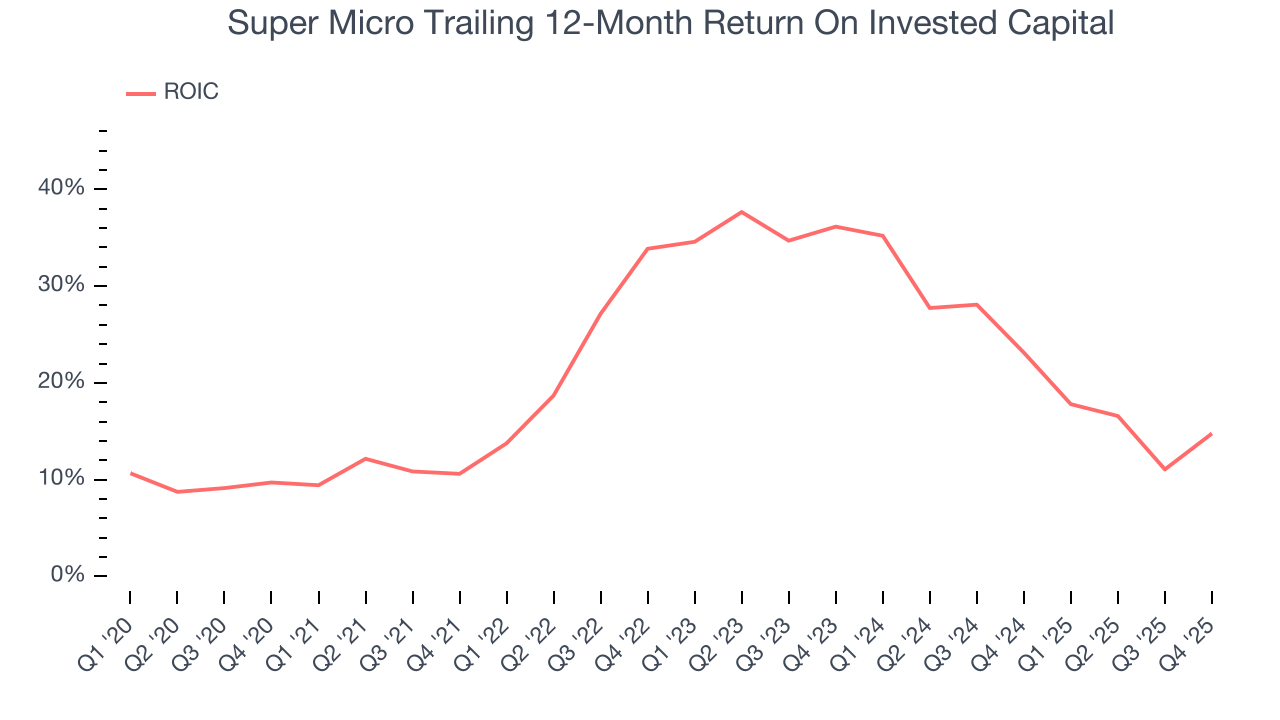
We like to invest in businesses with high returns, but the trend in a company’s ROIC is what often surprises the market and moves the stock price. Over the last few years, Super Micro’s ROIC averaged 3.3 percentage point decreases each year. Only time will tell if its new bets can bear fruit and potentially reverse the trend.
10. Balance Sheet Assessment
Super Micro reported $4.09 billion of cash and $4.88 billion of debt on its balance sheet in the most recent quarter. As investors in high-quality companies, we primarily focus on two things: 1) that a company’s debt level isn’t too high and 2) that its interest payments are not excessively burdening the business.
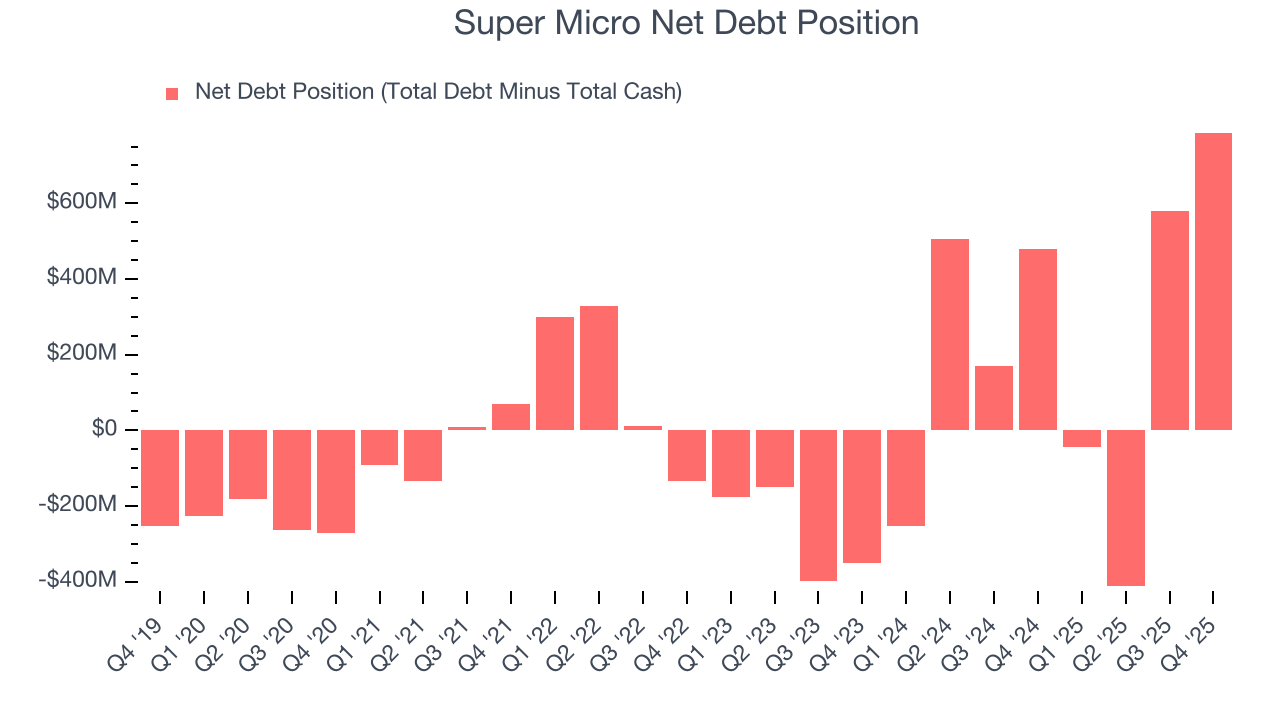
With $1.49 billion of EBITDA over the last 12 months, we view Super Micro’s 0.5× net-debt-to-EBITDA ratio as safe. We also see its $86.3 million of annual interest expenses as appropriate. The company’s profits give it plenty of breathing room, allowing it to continue investing in growth initiatives.
11. Key Takeaways from Super Micro’s Q4 Results
It was good to see Super Micro beat analysts’ EPS expectations this quarter. We were also excited its EPS guidance for next quarter outperformed Wall Street’s estimates by a wide margin. Zooming out, we think this quarter featured some important positives. The stock traded up 5.5% to $31.42 immediately after reporting.
12. Is Now The Time To Buy Super Micro?
Updated: March 14, 2026 at 11:59 PM EDT
A common mistake we notice when investors are deciding whether to buy a stock or not is that they simply look at the latest earnings results. Business quality and valuation matter more, so we urge you to understand these dynamics as well.
Super Micro is an amazing business ranking highly on our list. To begin with, its revenue growth was exceptional over the last five years, and its growth over the next 12 months is expected to accelerate. And while its cash burn raises the question of whether it can sustainably maintain growth, its scale makes it a trusted partner with negotiating leverage. Additionally, Super Micro’s rising cash profitability gives it more optionality.
Super Micro’s P/E ratio based on the next 12 months is 12.7x. Scanning the business services landscape today, Super Micro’s fundamentals clearly illustrate that it’s an elite business, and we like it at this price.
Wall Street analysts have a consensus one-year price target of $41.31 on the company (compared to the current share price of $30.69), implying they see 34.6% upside in buying Super Micro in the short term.