
Universal Display (OLED)
We’re wary of Universal Display. Its decelerating growth and falling profitability suggest it’s struggling to scale down costs as demand fades.― StockStory Analyst Team
1. News


2. Summary
Why Universal Display Is Not Exciting
Serving major consumer electronics manufacturers, Universal Display (NASDAQ:OLED) is a provider of organic light emitting diode (OLED) technologies used in display and lighting applications.
- Estimated sales growth of 4.2% for the next 12 months implies demand will slow from its two-year trend
- A consolation is that its offerings are mission-critical for businesses and result in a best-in-class gross margin of 75.3%


Universal Display doesn’t satisfy our quality benchmarks. There are more rewarding stocks elsewhere.
Why There Are Better Opportunities Than Universal Display


Universal Display is trading at $95.48 per share, or 19.8x forward P/E. Universal Display’s valuation may seem like a bargain, especially when stacked up against other semiconductor companies. We remind you that you often get what you pay for, though.
Our advice is to pay up for elite businesses whose advantages are tailwinds to earnings growth. Don’t get sucked into lower-quality businesses just because they seem like bargains. These mediocre businesses often never achieve a higher multiple as hoped, a phenomenon known as a “value trap”.
3. Universal Display (OLED) Research Report: Q4 CY2025 Update
OLED provider Universal Display (NASDAQ:OLED) met Wall Street’s revenue expectations in Q4 CY2025, with sales up 6.6% year on year to $172.9 million. On the other hand, the company’s full-year revenue guidance of $675 million at the midpoint came in 6.3% below analysts’ estimates. Its GAAP profit of $1.39 per share was 8.4% above analysts’ consensus estimates.
Universal Display (OLED) Q4 CY2025 Highlights:
- Revenue: $172.9 million vs analyst estimates of $173.4 million (6.6% year-on-year growth, in line)
- EPS (GAAP): $1.39 vs analyst estimates of $1.28 (8.4% beat)
- Operating Margin: 38.9%, up from 32.3% in the same quarter last year
- Free Cash Flow Margin: 8.7%, down from 13.6% in the same quarter last year
- Inventory Days Outstanding: 531, up from 515 in the previous quarter
- Market Capitalization: $5.70 billion
Company Overview
Serving major consumer electronics manufacturers, Universal Display (NASDAQ:OLED) is a provider of organic light emitting diode (OLED) technologies used in display and lighting applications.
Universal Display Corporation was founded in 1994 by Sherwin Seligsohn after he visited the electrical engineering school at Princeton University and observed research on self-emissive organic materials. In 1996, Universal Display went public with a research contract with Princeton, 3 part-time employees, and one patent pending.
Organic light emitting diodes or OLEDs are thin, lightweight devices that emit light that can be manufactured on both flexible and rigid substrates, which make them suitable for color displays and other lighting products. OLED displays have been capturing market share from inorganic light emitting diodes or LEDs due to superior power efficiency, contrast ratio, video response time, and manufacturing cost. As such, OLED technology is commonly employed in mobile phones, TVs, wearables, AR/VR devices, and automotive markets among others.
Universal Display generates revenue by entering into long-term agreements with our customers through (1) commercial supply agreements for the purchase of specific OLED materials and/or (2) patent license agreements related to the manufacture of display and lighting devices. Commercial supply agreements often involve multi-year purchase commitments for mass production facilities, which gives customers volume discounts and preferential pricing.
Competitors offering OLED or competing lighting technologies include Sumitomo Chemical (TSE:4005), Idemitsu Kosan (TSE:5019), and Cynora.
4. Revenue Growth
A company’s long-term performance is an indicator of its overall quality. Any business can experience short-term success, but top-performing ones enjoy sustained growth for years. Over the last five years, Universal Display grew its sales at a decent 8.7% compounded annual growth rate. Its growth was slightly above the average semiconductor company and shows its offerings resonate with customers. Semiconductors are a cyclical industry, and long-term investors should be prepared for periods of high growth followed by periods of revenue contractions.
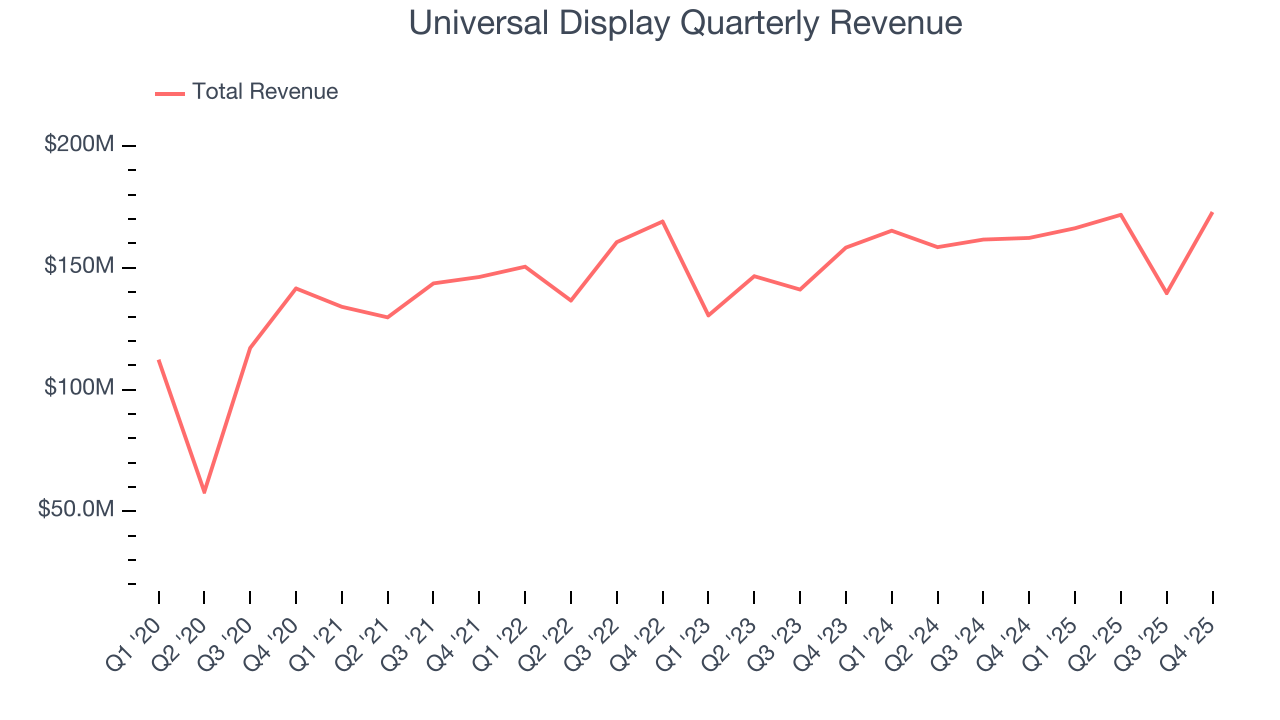
We at StockStory place the most emphasis on long-term growth, but within semiconductors, a half-decade historical view may miss new demand cycles or industry trends like AI. Universal Display’s annualized revenue growth of 6.2% over the last two years is below its five-year trend, but we still think the results were respectable. 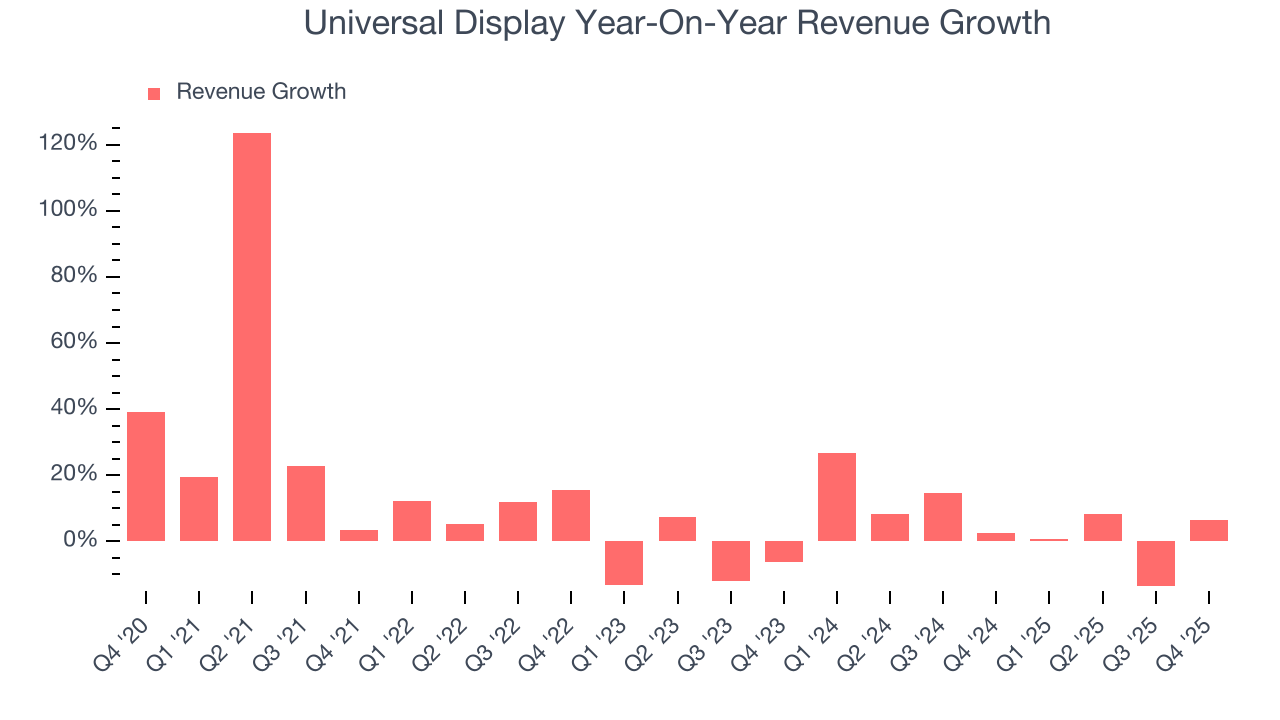
This quarter, Universal Display grew its revenue by 6.6% year on year, and its $172.9 million of revenue was in line with Wall Street’s estimates. Additionally, Universal Display’s growth inflected positively this quarter, news that will likely give some shareholders hope.
Looking ahead, sell-side analysts expect revenue to grow 8.8% over the next 12 months. Although this projection suggests its newer products and services will catalyze better top-line performance, it is still below average for the sector. At least the company is tracking well in other measures of financial health.
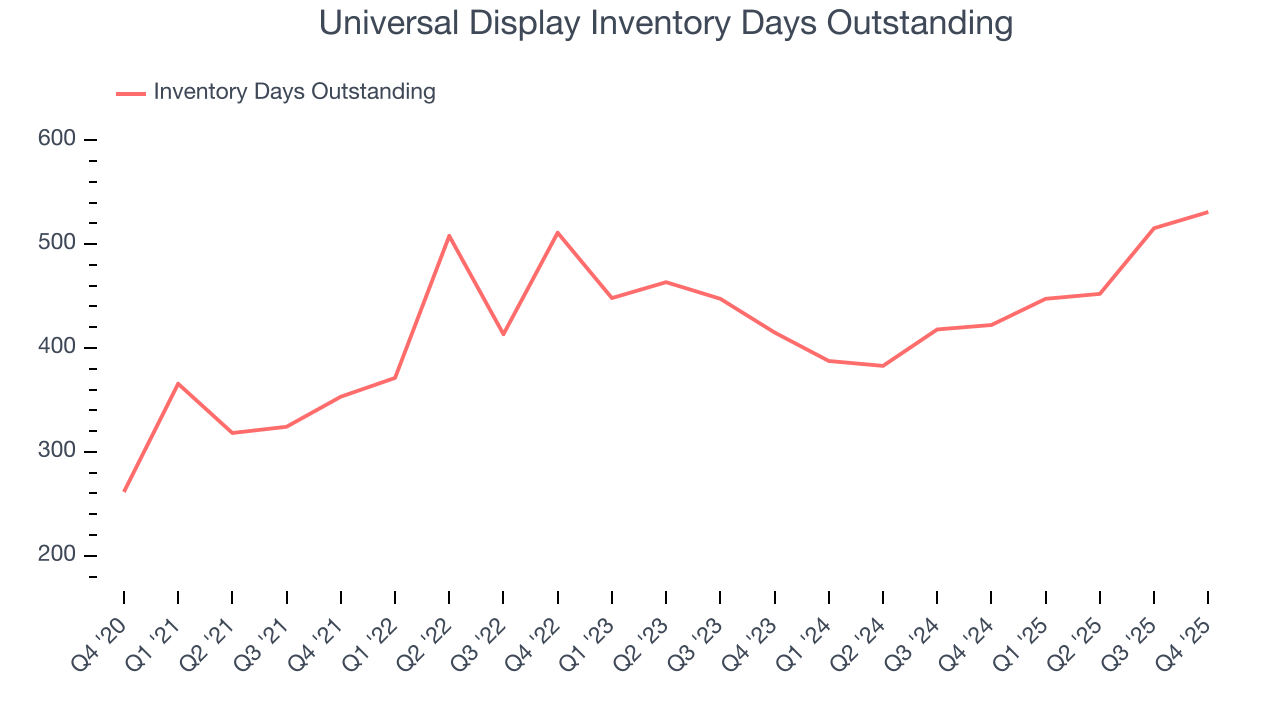
5. Product Demand & Outstanding Inventory
Days Inventory Outstanding (DIO) is an important metric for chipmakers, as it reflects a business’ capital intensity and the cyclical nature of semiconductor supply and demand. In a tight supply environment, inventories tend to be stable, allowing chipmakers to exert pricing power. Steadily increasing DIO can be a warning sign that demand is weak, and if inventories continue to rise, the company may have to downsize production.
This quarter, Universal Display’s DIO came in at 531, which is 106 days above its five-year average, suggesting that the company’s inventory has grown to higher levels than we’ve seen in the past.
6. Gross Margin & Pricing Power
In the semiconductor industry, a company’s gross profit margin is a critical metric to track because it sheds light on its pricing power, complexity of products, and ability to procure raw materials, equipment, and labor.
Universal Display’s gross margin is one of the best in the semiconductor sector, and its strong pricing power is a direct result of its differentiated products and technological expertise. As you can see below, it averaged an elite 75.3% gross margin over the last two years. Said differently, roughly $75.34 was left to spend on selling, marketing, R&D, and general administrative overhead for every $100 in revenue. 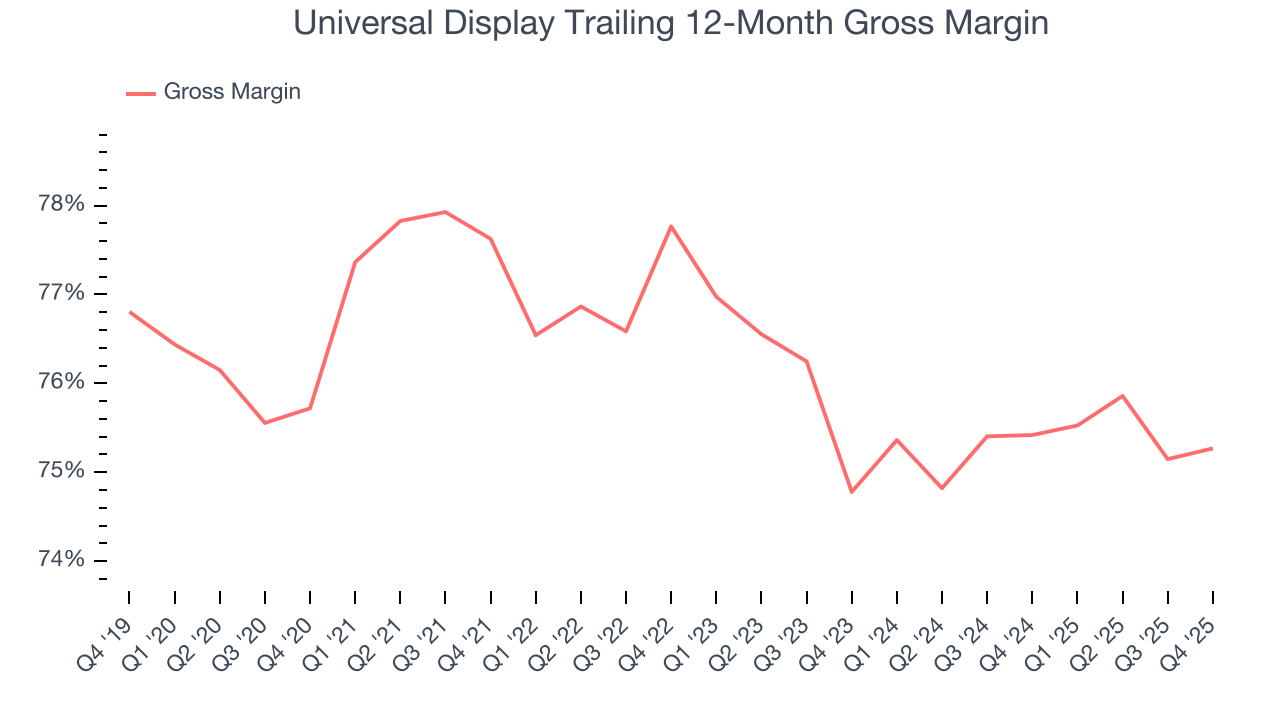
Universal Display produced a 76.1% gross profit margin in Q4, in line with the same quarter last year. Zooming out, the company’s full-year margin has remained steady over the past 12 months, suggesting its input costs (such as raw materials and manufacturing expenses) have been stable and it isn’t under pressure to lower prices.
7. Operating Margin
Universal Display has been a well-oiled machine over the last two years. It demonstrated elite profitability for a semiconductor business, boasting an average operating margin of 37.5%. This result isn’t surprising as its high gross margin gives it a favorable starting point.
Looking at the trend in its profitability, Universal Display’s operating margin decreased by 2.9 percentage points over the last five years. This raises questions about the company’s expense base because its revenue growth should have given it leverage on its fixed costs, resulting in better economies of scale and profitability.
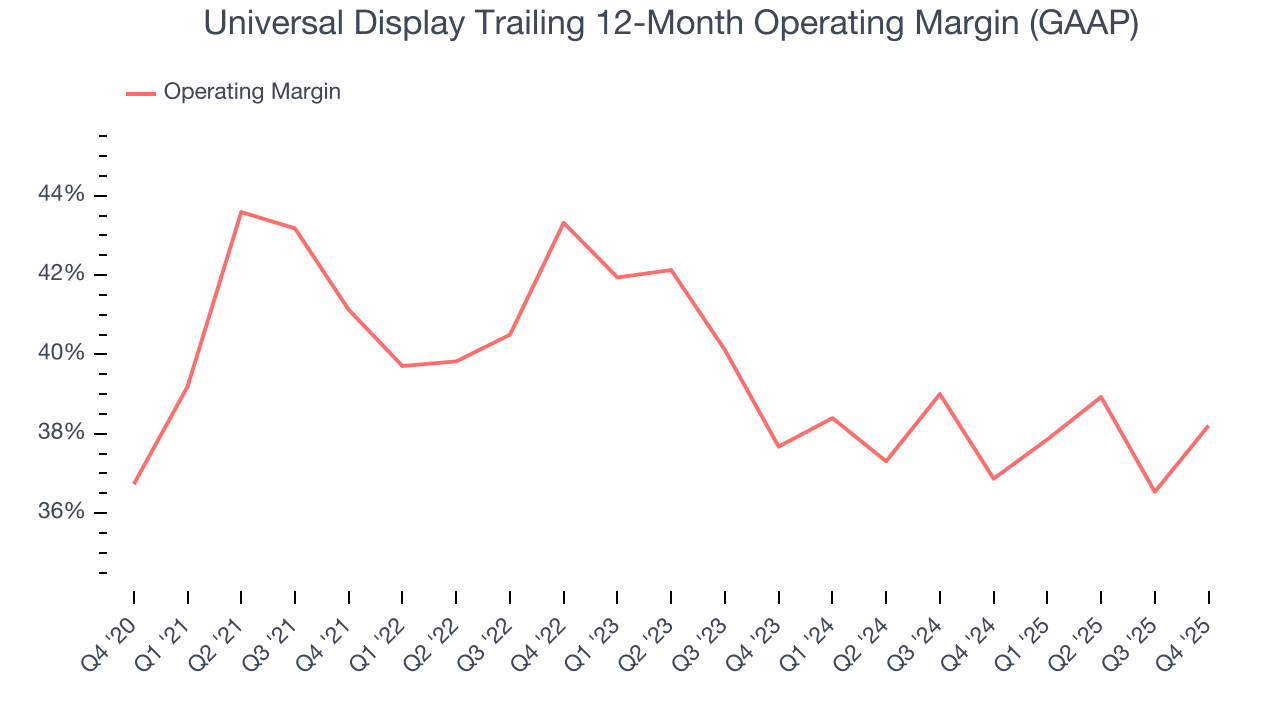
This quarter, Universal Display generated an operating margin profit margin of 38.9%, up 6.5 percentage points year on year. The increase was solid, and because its operating margin rose more than its gross margin, we can infer it was more efficient with expenses such as marketing, R&D, and administrative overhead.
8. Earnings Per Share
We track the long-term change in earnings per share (EPS) for the same reason as long-term revenue growth. Compared to revenue, however, EPS highlights whether a company’s growth is profitable.
Universal Display’s EPS grew at an unimpressive 12.4% compounded annual growth rate over the last five years. This performance was better than its flat revenue, but we take it with a grain of salt because its operating margin didn’t improve and it didn’t repurchase its shares, meaning the delta came from reduced interest expenses or taxes.
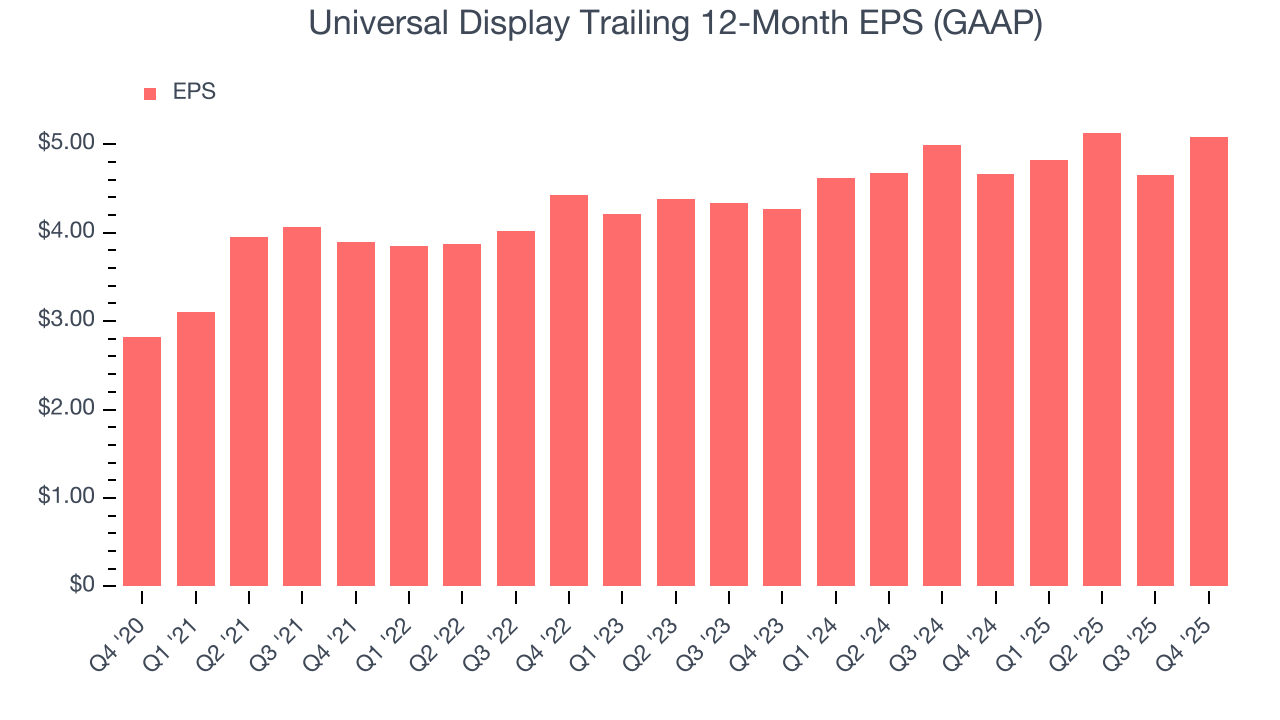
In Q4, Universal Display reported EPS of $1.39, up from $0.97 in the same quarter last year. This print beat analysts’ estimates by 8.4%. Over the next 12 months, Wall Street expects Universal Display’s full-year EPS of $5.08 to grow 8.1%.
9. Cash Is King
If you’ve followed StockStory for a while, you know we emphasize free cash flow. Why, you ask? We believe that in the end, cash is king, and you can’t use accounting profits to pay the bills.
Universal Display has shown terrific cash profitability, and if sustainable, puts it in an advantageous position to invest in new products, return capital to investors, and consolidate the market during industry downturns. The company’s free cash flow margin was among the best in the semiconductor sector, averaging 28.1% over the last two years.
Taking a step back, we can see that Universal Display’s margin dropped by 3 percentage points over the last five years. We’re willing to live with its performance for now but hope its cash conversion can rise soon. Continued declines could signal it is in the middle of an investment cycle.
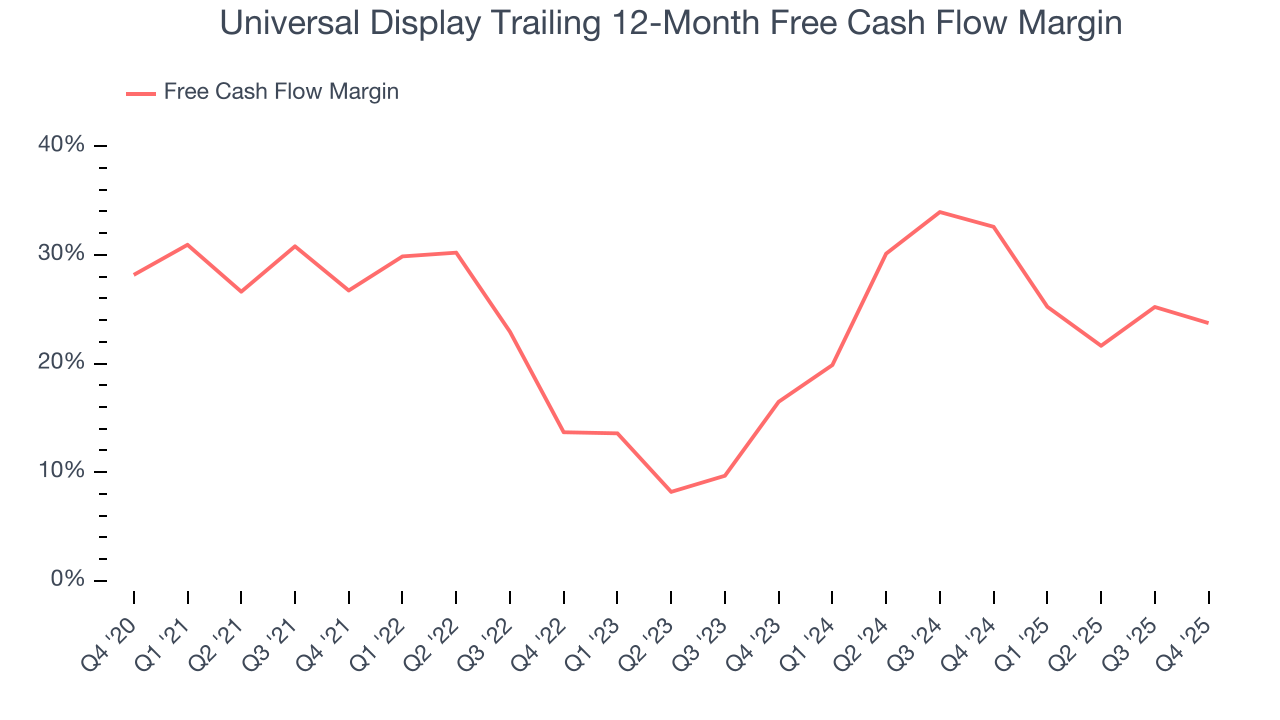
Universal Display’s free cash flow clocked in at $15.06 million in Q4, equivalent to a 8.7% margin. The company’s cash profitability regressed as it was 4.9 percentage points lower than in the same quarter last year, suggesting its historical struggles have dragged on.
10. Return on Invested Capital (ROIC)
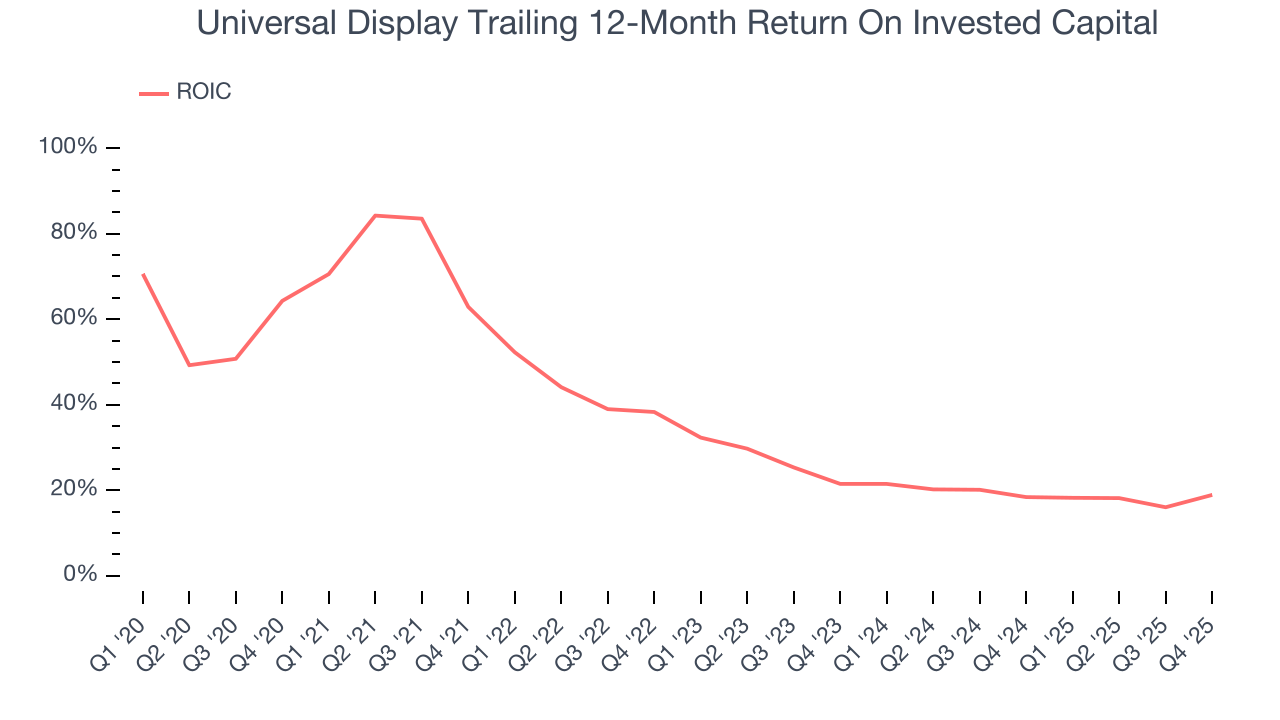
EPS and free cash flow tell us whether a company was profitable while growing its revenue. But was it capital-efficient? A company’s ROIC explains this by showing how much operating profit it makes compared to the money it has raised (debt and equity).
Universal Display’s five-year average ROIC was 32%, beating other semiconductor companies by a wide margin. This illustrates its management team’s ability to invest in attractive growth opportunities and produce tangible results for shareholders.
11. Balance Sheet Assessment
One of the best ways to mitigate bankruptcy risk is to hold more cash than debt.
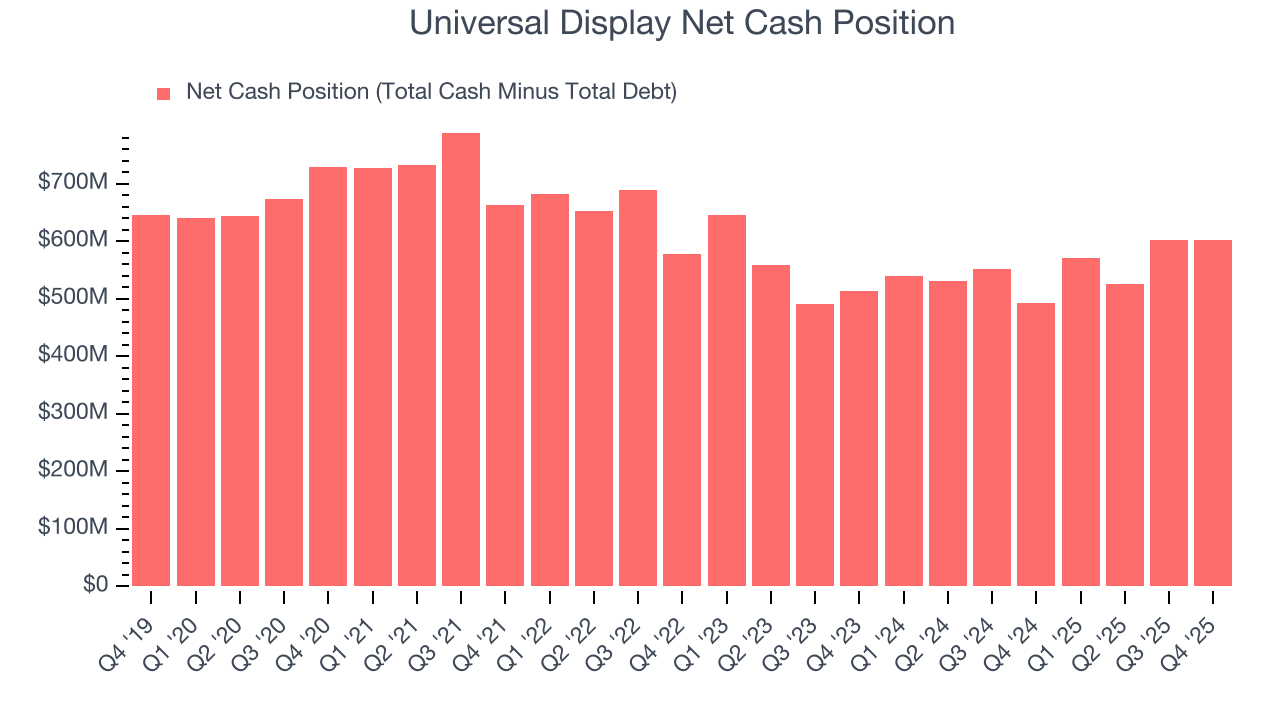
Universal Display is a profitable, well-capitalized company with $602.4 million of cash and no debt. This position is 10.8% of its market cap and gives it the freedom to borrow money, return capital to shareholders, or invest in growth initiatives. Leverage is not an issue here.
12. Key Takeaways from Universal Display’s Q4 Results
It was good to see Universal Display beat analysts’ EPS expectations this quarter on in-line revenue. On the other hand, its full-year revenue guidance missed. Overall, this was a mixed quarter. The stock traded up 1.8% to $119.15 immediately after reporting.
13. Is Now The Time To Buy Universal Display?
Updated: March 19, 2026 at 10:33 PM EDT
The latest quarterly earnings matters, sure, but we actually think longer-term fundamentals and valuation matter more. Investors should consider all these pieces before deciding whether or not to invest in Universal Display.
Universal Display’s business quality ultimately falls short of our standards. Although its revenue growth was good over the last five years, it’s expected to deteriorate over the next 12 months and its projected EPS for the next year is lacking.
Universal Display’s P/E ratio based on the next 12 months is 19.8x. While this valuation is reasonable, we don’t really see a big opportunity at the moment. We're fairly confident there are better stocks to buy right now.
Wall Street analysts have a consensus one-year price target of $150.75 on the company (compared to the current share price of $95.48).
Although the price target is bullish, readers should exercise caution because analysts tend to be overly optimistic. The firms they work for, often big banks, have relationships with companies that extend into fundraising, M&A advisory, and other rewarding business lines. As a result, they typically hesitate to say bad things for fear they will lose out. We at StockStory do not suffer from such conflicts of interest, so we’ll always tell it like it is.