Ollie's (OLLI)
Ollie's piques our interest. Its revenue and EPS are projected to skyrocket next year, an optimistic sign for its share price.― StockStory Analyst Team
1. News

2. Summary
Why Ollie's Is Interesting
Often located in suburban or semi-rural shopping centers, Ollie’s Bargain Outlet (NASDAQ:OLLI) is a discount retailer that acquires excess inventory then sells at meaningful discounts.
- Notable projected revenue growth of 13.4% for the next 12 months hints at market share gains
- Rapid rollout of new stores to capitalize on market opportunities makes sense given its strong same-store sales performance
- A drawback is its subscale operations are evident in its revenue base of $2.65 billion, meaning it has fewer distribution channels than its larger rivals (but more room for growth)


Ollie's almost passes our quality test. If you like the company, the price seems fair.
Why Is Now The Time To Buy Ollie's?


At $90.37 per share, Ollie's trades at 20.8x forward P/E. Compared to companies in the consumer retail space, we think this multiple is warranted for the revenue growth you get.
If you think the market is undervaluing the company, now could be a good time to build a position.
3. Ollie's (OLLI) Research Report: Q4 CY2025 Update
Discount retail company Ollie’s Bargain Outlet (NASDAQ:OLLI) missed Wall Street’s revenue expectations in Q4 CY2025, but sales rose 16.8% year on year to $779.3 million. On the other hand, the company’s outlook for the full year was close to analysts’ estimates with revenue guided to $3.00 billion at the midpoint. Its non-GAAP profit of $1.39 per share was 1.1% below analysts’ consensus estimates.
Ollie's (OLLI) Q4 CY2025 Highlights:
- Revenue: $779.3 million vs analyst estimates of $783.3 million (16.8% year-on-year growth, 0.5% miss)
- Adjusted EPS: $1.39 vs analyst expectations of $1.41 (1.1% miss)
- Adjusted EBITDA: $127.1 million vs analyst estimates of $125.8 million (16.3% margin, 1% beat)
- Adjusted EPS guidance for the upcoming financial year 2026 is $4.45 at the midpoint, missing analyst estimates by 1.8%
- Operating Margin: 14%, in line with the same quarter last year
- Free Cash Flow Margin: 21.1%, up from 18.5% in the same quarter last year
- Locations: 645 at quarter end, up from 559 in the same quarter last year
- Same-Store Sales rose 3.6% year on year, in line with the same quarter last year
- Market Capitalization: $6.34 billion
Company Overview
Often located in suburban or semi-rural shopping centers, Ollie’s Bargain Outlet (NASDAQ:OLLI) is a discount retailer that acquires excess inventory then sells at meaningful discounts.
For example, if Walmart orders huge quantities of toys based on a new Disney movie but the movie flops and the popularity of that toy never materializes, Walmart may sell those in bulk to Ollie’s at pennies on the dollar rather than discount the items and try to sell them individually. This is often done to clear shelf space for new products.
Ollie’s buying approach focuses on finding excess inventory or overstocked items from other retailers, so selection can change quickly and be varied. Shopping at Ollie’s is often a treasure hunt–what the consumer loses in reliable selection or the latest trends is made up for with very low prices. Prices of Ollie’s merchandise can be as much as 70% off other full-price retailers. Housewares and home decor, snacks, toys and games, and electronics are key product categories at the typical Ollie’s store.
The core customer is the value-conscious shopper who values a one-stop shop for many of a household’s needs. This customer is willing to physically go to stores and spend more time searching for the right merchandise since Ollie’s has a very limited online presence.
4. Discount Retailer
Discount retailers understand that many shoppers love a good deal, and they focus on providing excellent value to shoppers by selling general merchandise at major discounts. They can do this because of unique purchasing, procurement, and pricing strategies that involve scouring the market for trendy goods or buying excess inventory from manufacturers and other retailers. They then turn around and sell these snacks, paper towels, toys, clothes, and myriad other products at highly enticing prices. Despite the unique draw and lure of discounts, these discount retailers must also contend with the secular headwinds of online shopping and challenged retail foot traffic in places like suburban strip malls.
Off-price and discount retail competitors include TJX (NYSE:TJX), Ross Stores (NASDAQ:ROST), and Burlington Stores (NYSE:BURL).
5. Revenue Growth
Reviewing a company’s long-term sales performance reveals insights into its quality. Any business can experience short-term success, but top-performing ones enjoy sustained growth for years.
With $2.65 billion in revenue over the past 12 months, Ollie's is a small retailer, which sometimes brings disadvantages compared to larger competitors benefiting from economies of scale and negotiating leverage with suppliers. On the bright side, it can grow faster because it has more white space to build new stores.
As you can see below, Ollie’s sales grew at a solid 13.2% compounded annual growth rate over the last three years as it opened new stores and increased sales at existing, established locations.
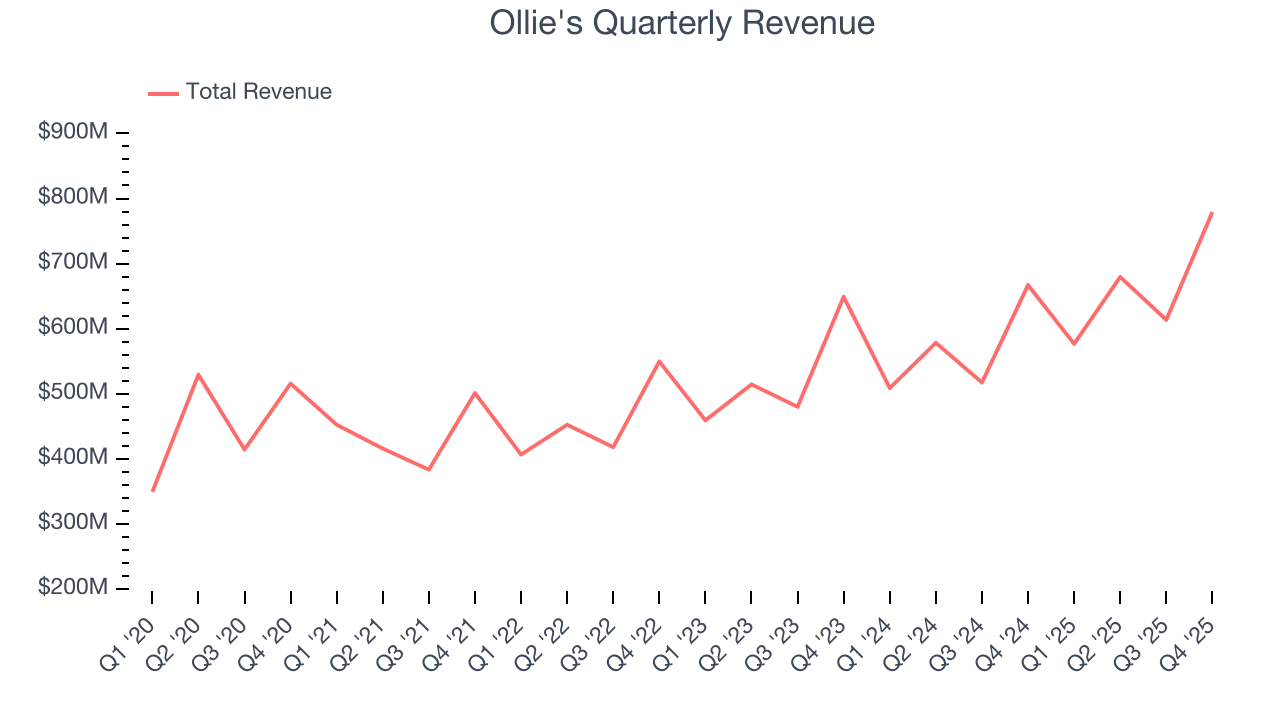
This quarter, Ollie’s revenue grew by 16.8% year on year to $779.3 million but fell short of Wall Street’s estimates.
Looking ahead, sell-side analysts expect revenue to grow 13.5% over the next 12 months, similar to its three-year rate. This projection is eye-popping and indicates the market sees success for its products.
6. Store Performance
Number of Stores
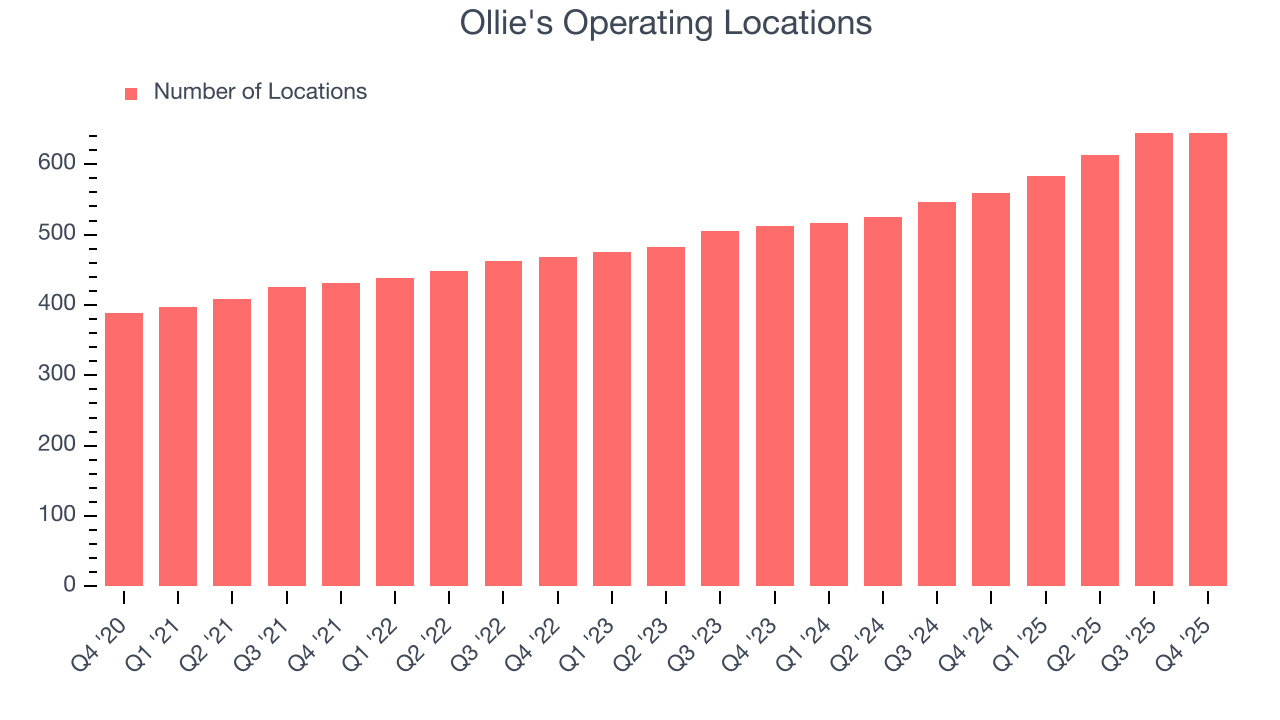
Ollie's sported 645 locations in the latest quarter. Over the last two years, it has opened new stores at a rapid clip by averaging 12.3% annual growth, among the fastest in the consumer retail sector. This gives it a chance to scale into a mid-sized business over time.
When a retailer opens new stores, it usually means it’s investing for growth because demand is greater than supply, especially in areas where consumers may not have a store within reasonable driving distance.
Same-Store Sales
The change in a company's store base only tells one side of the story. The other is the performance of its existing locations and e-commerce sales, which informs management teams whether they should expand or downsize their physical footprints. Same-store sales gives us insight into this topic because it measures organic growth for a retailer's e-commerce platform and brick-and-mortar shops that have existed for at least a year.
Ollie’s demand has been healthy for a retailer over the last two years. On average, the company has grown its same-store sales by a robust 3.2% per year. This performance gives it the confidence to meaningfully expand its store base.
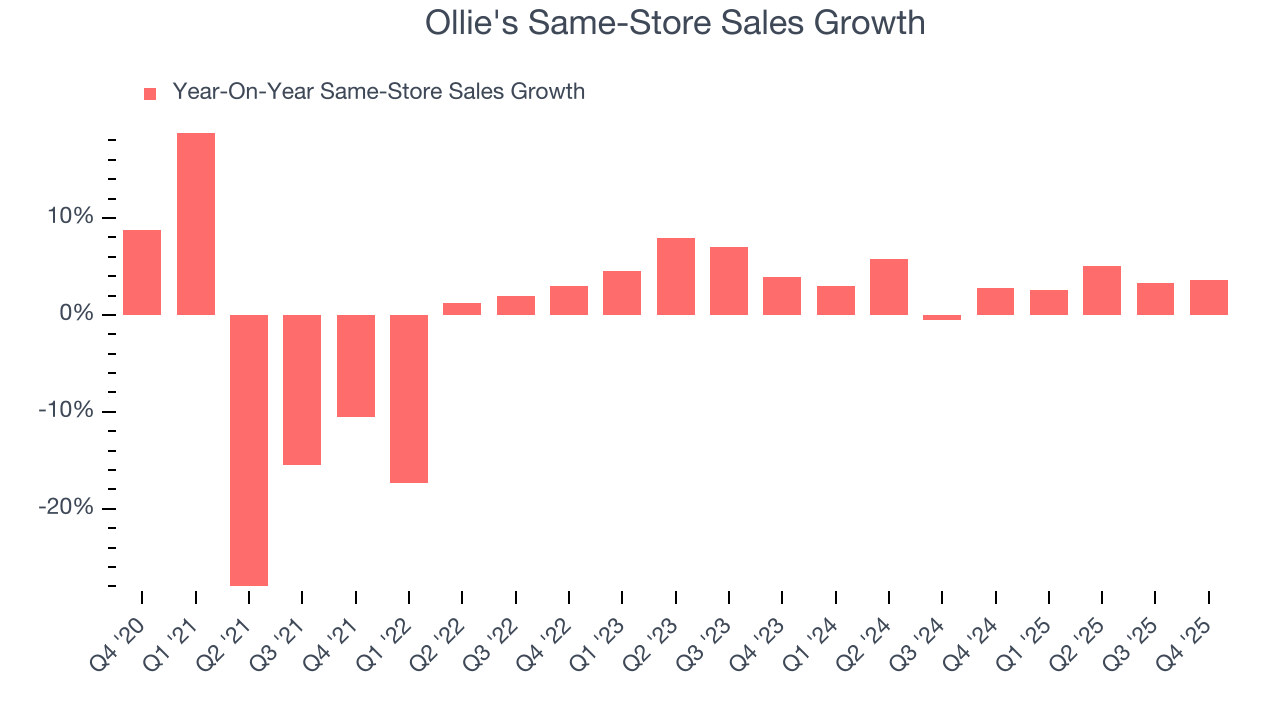
In the latest quarter, Ollie’s same-store sales rose 3.6% year on year. This performance was more or less in line with its historical levels.
7. Gross Margin & Pricing Power
Ollie’s unit economics are higher than the typical retailer, giving it the flexibility to invest in areas such as marketing and talent to reach more consumers. As you can see below, it averaged a decent 40.4% gross margin over the last two years. Said differently, Ollie's paid its suppliers $59.61 for every $100 in revenue. 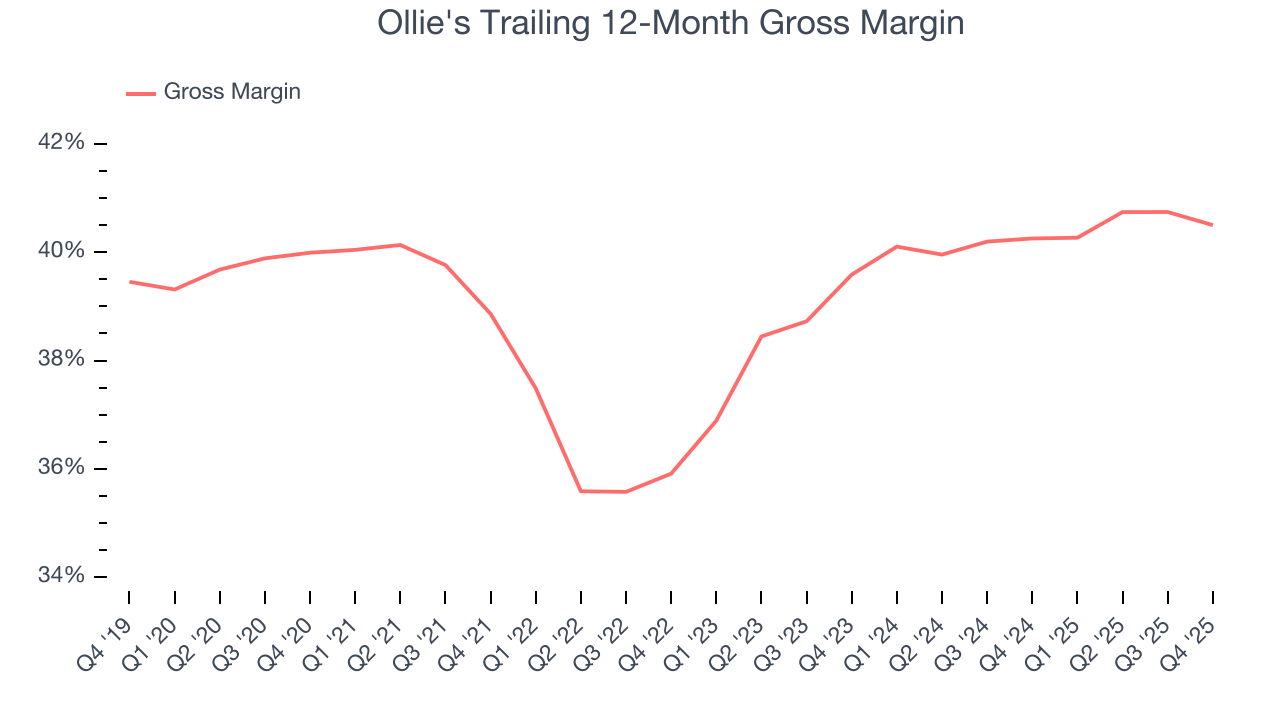
Ollie's produced a 39.9% gross profit margin in Q4, in line with the same quarter last year. Zooming out, the company’s full-year margin has remained steady over the past 12 months, suggesting it strives to keep prices low for customers and has stable input costs (such as labor and freight expenses to transport goods).
8. Operating Margin
Ollie’s operating margin has more or less stayed the same over the last 12 months , averaging 11.2% over the last two years. This profitability was solid for a consumer retail business and shows it’s an efficient company that manages its expenses well. This is seen in its fast historical revenue growth, which is why we look at both data points together.
Looking at the trend in its profitability, Ollie’s operating margin might fluctuated slightly but has generally stayed the same over the last year. This raises questions about the company’s expense base because its revenue growth should have given it leverage on its fixed costs, resulting in better economies of scale and profitability.
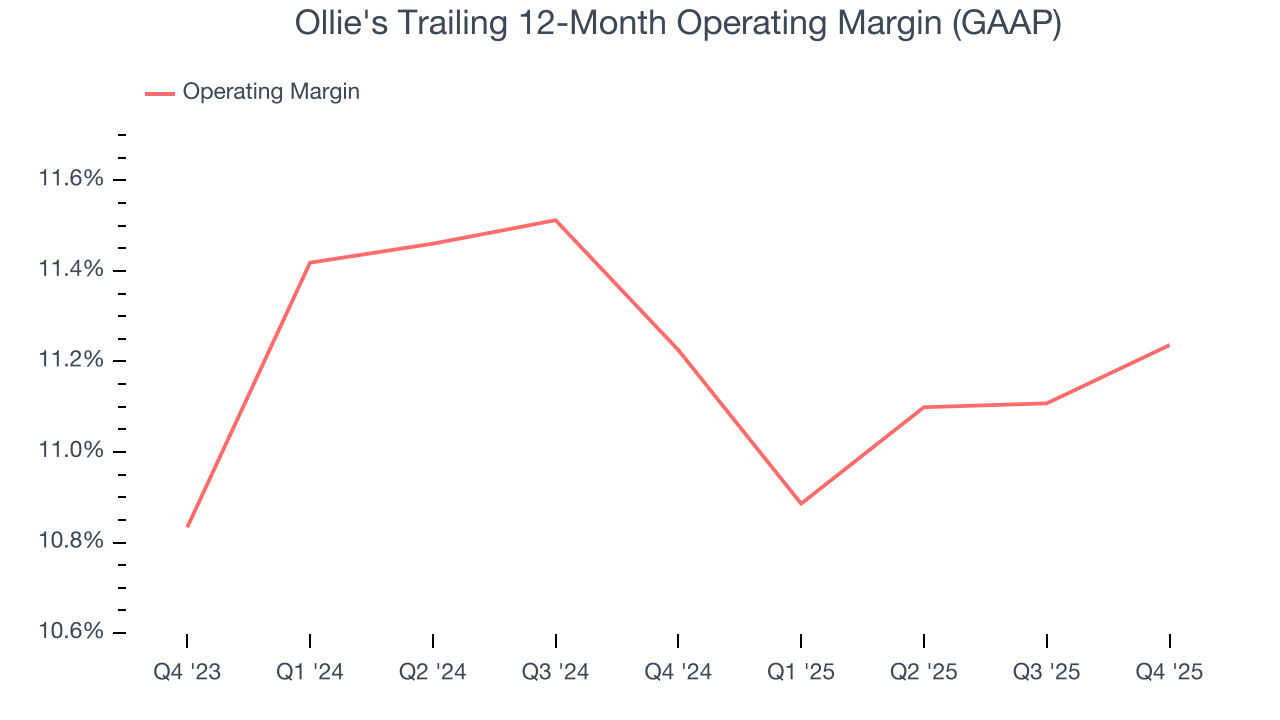
In Q4, Ollie's generated an operating margin profit margin of 14%, in line with the same quarter last year. This indicates the company’s cost structure has recently been stable.
9. Earnings Per Share
We track the long-term change in earnings per share (EPS) for the same reason as long-term revenue growth. Compared to revenue, however, EPS highlights whether a company’s growth is profitable.
Ollie’s EPS grew at 33.5% compounded annual growth rate over the last three years, higher than its 13.2% annualized revenue growth. This tells us the company became more profitable on a per-share basis as it expanded.
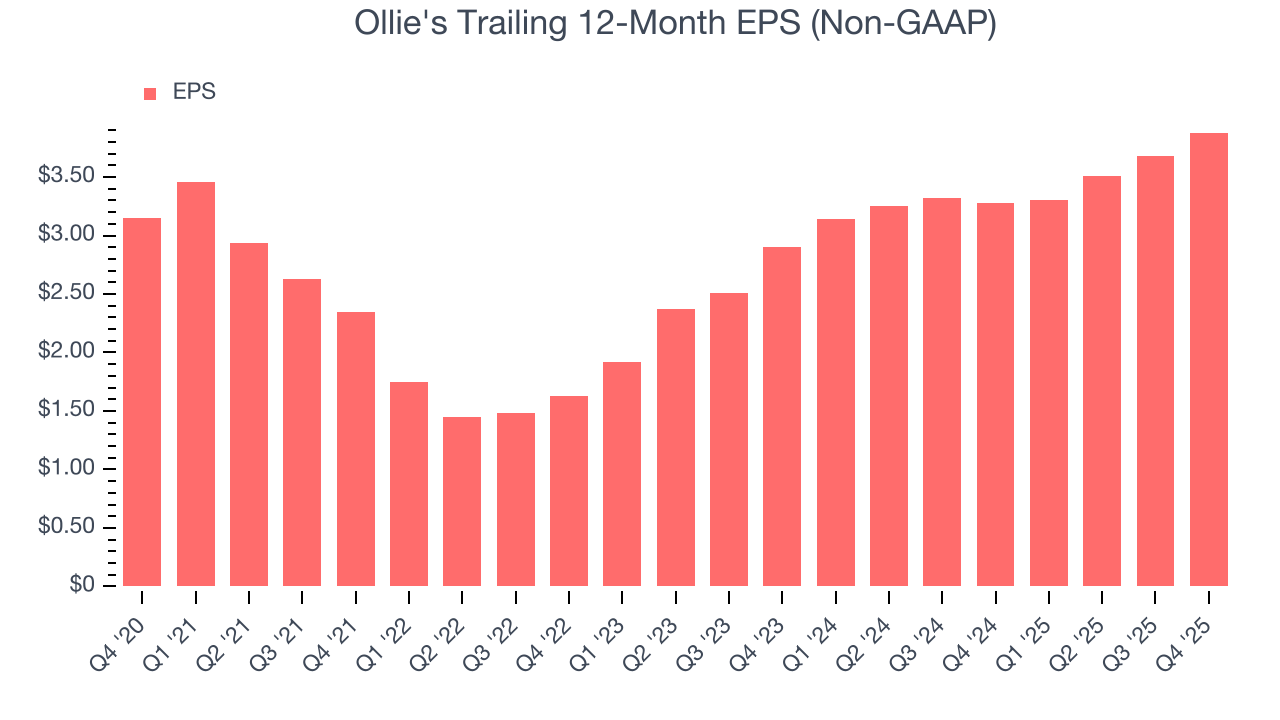
In Q4, Ollie's reported adjusted EPS of $1.39, up from $1.19 in the same quarter last year. Despite growing year on year, this print slightly missed analysts’ estimates, but we care more about long-term adjusted EPS growth than short-term movements. Over the next 12 months, Wall Street expects Ollie’s full-year EPS of $3.88 to grow 15.3%.
10. Cash Is King
Free cash flow isn't a prominently featured metric in company financials and earnings releases, but we think it's telling because it accounts for all operating and capital expenses, making it tough to manipulate. Cash is king.
Ollie's has shown impressive cash profitability, giving it the option to reinvest or return capital to investors. The company’s free cash flow margin averaged 6.1% over the last two years, better than the broader consumer retail sector.
Taking a step back, we can see that Ollie’s margin expanded by 2.6 percentage points over the last year. This shows the company is heading in the right direction, and we can see it became a less capital-intensive business because its free cash flow profitability rose while its operating profitability was flat.
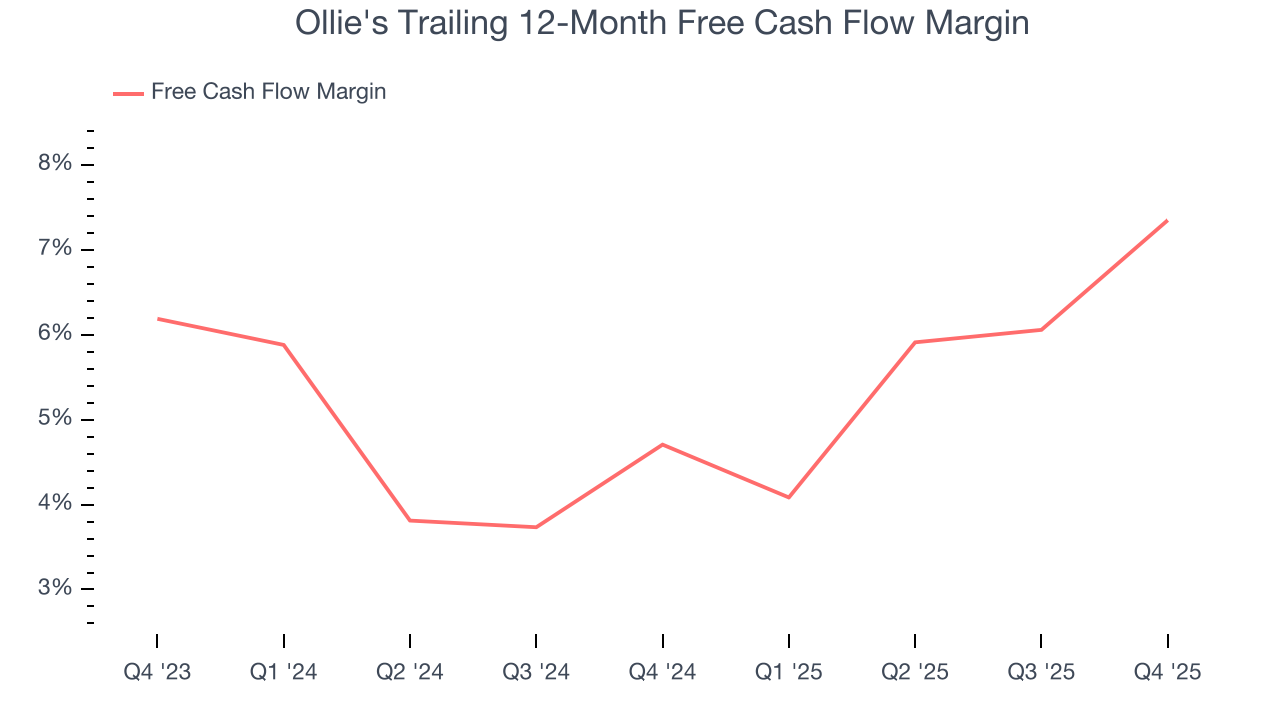
Ollie’s free cash flow clocked in at $164.4 million in Q4, equivalent to a 21.1% margin. This result was good as its margin was 2.6 percentage points higher than in the same quarter last year, building on its favorable historical trend.
11. Return on Invested Capital (ROIC)
EPS and free cash flow tell us whether a company was profitable while growing its revenue. But was it capital-efficient? A company’s ROIC explains this by showing how much operating profit it makes compared to the money it has raised (debt and equity).
Although Ollie's has shown solid fundamentals lately, it historically did a mediocre job investing in profitable growth initiatives. Its five-year average ROIC was 9.6%, somewhat low compared to the best consumer retail companies that consistently pump out 25%+.
12. Balance Sheet Assessment
Ollie's reported $296.3 million of cash and $685.9 million of debt on its balance sheet in the most recent quarter. As investors in high-quality companies, we primarily focus on two things: 1) that a company’s debt level isn’t too high and 2) that its interest payments are not excessively burdening the business.
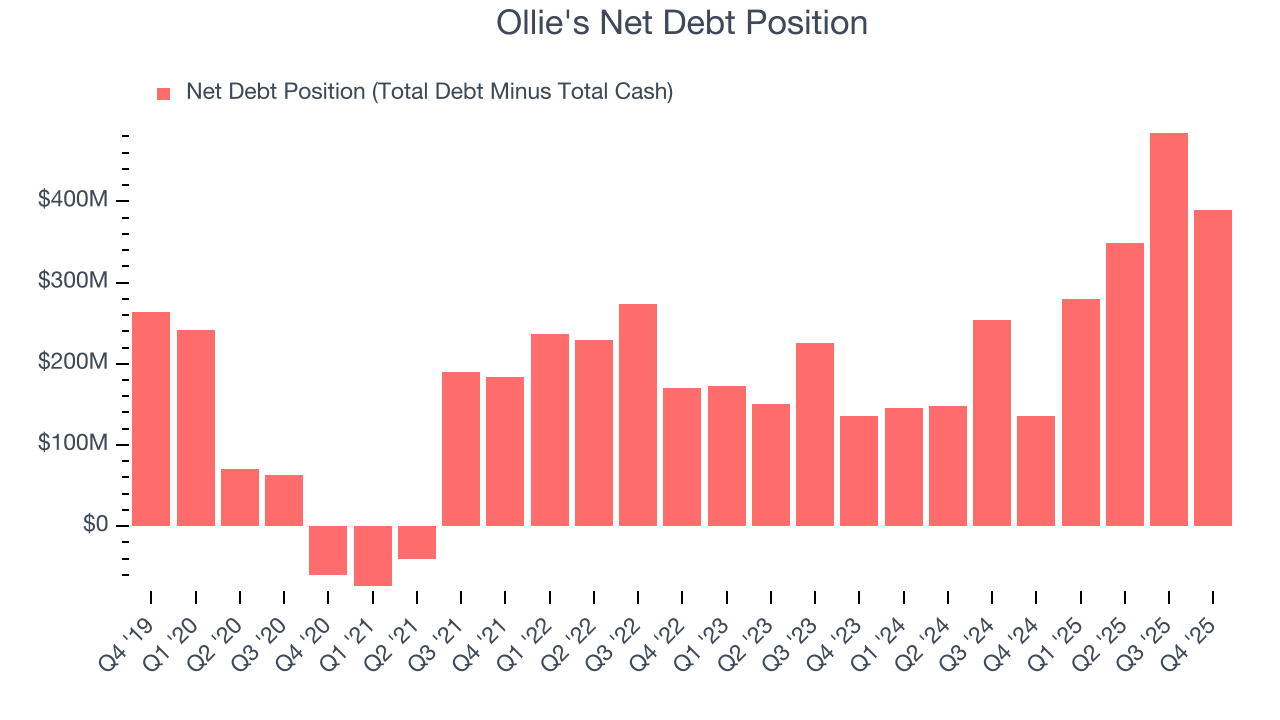
With $366 million of EBITDA over the last 12 months, we view Ollie’s 1.1× net-debt-to-EBITDA ratio as safe. We also see its $8.97 million of annual interest expenses as appropriate. The company’s profits give it plenty of breathing room, allowing it to continue investing in growth initiatives.
13. Key Takeaways from Ollie’s Q4 Results
It was good to see Ollie's narrowly top analysts’ gross margin expectations this quarter. We were also happy its EBITDA narrowly outperformed Wall Street’s estimates. On the other hand, its full-year EPS guidance missed and its revenue fell slightly short of Wall Street’s estimates. Overall, this was a weaker quarter. The stock traded up 2.3% to $105.34 immediately after reporting.
14. Is Now The Time To Buy Ollie's?
Updated: March 25, 2026 at 11:01 PM EDT
When considering an investment in Ollie's, investors should account for its valuation and business qualities as well as what’s happened in the latest quarter.
There are some positives when it comes to Ollie’s fundamentals. First off, its revenue growth was good over the last three years, and analysts believe this will continue. And while its brand caters to a niche market, its new store openings have increased its brand equity. On top of that, its projected EPS for the next year implies the company will continue generating shareholder value.
Ollie’s P/E ratio based on the next 12 months is 20.8x. Looking at the consumer retail space right now, Ollie's trades at a compelling valuation. If you believe in the company and its growth potential, now is an opportune time to buy shares.
Wall Street analysts have a consensus one-year price target of $138.60 on the company (compared to the current share price of $90.37), implying they see 53.4% upside in buying Ollie's in the short term.