
Pool (POOL)
We wouldn’t recommend Pool. Its weak sales growth and low returns on capital show it struggled to generate demand and profits.― StockStory Analyst Team
1. News


2. Summary
Why We Think Pool Will Underperform
Founded in 1993 and headquartered in Louisiana, Pool (NASDAQ:POOL) is one of the largest wholesale distributors of swimming pool supplies, equipment, and related leisure products.
- 6.1% annual revenue growth over the last five years was slower than its consumer discretionary peers
- Incremental sales over the last five years were less profitable as its 3.8% annual earnings per share growth lagged its revenue gains
- Subpar operating margin constrains its ability to invest in process improvements or effectively respond to new competitive threats


Pool’s quality is insufficient. We’d search for superior opportunities elsewhere.
Why There Are Better Opportunities Than Pool


Pool is trading at $206.04 per share, or 18.6x forward P/E. This multiple is quite expensive for the quality you get.
Paying a premium for high-quality companies with strong long-term earnings potential is preferable to owning challenged businesses with questionable prospects. That helps the prudent investor sleep well at night.
3. Pool (POOL) Research Report: Q4 CY2025 Update
Swimming pool distributor Pool (NASDAQ:POOL) missed Wall Street’s revenue expectations in Q4 CY2025, with sales flat year on year at $982.2 million. Its GAAP profit of $0.85 per share was 12.2% below analysts’ consensus estimates.
Pool (POOL) Q4 CY2025 Highlights:
- Revenue: $982.2 million vs analyst estimates of $998.8 million (flat year on year, 1.7% miss)
- EPS (GAAP): $0.85 vs analyst expectations of $0.97 (12.2% miss)
- EPS (GAAP) guidance for the upcoming financial year 2026 is $11 at the midpoint, missing analyst estimates by 5.6%
- Operating Margin: 5.3%, in line with the same quarter last year
- Free Cash Flow Margin: 7.3%, down from 15.9% in the same quarter last year
- Market Capitalization: $9.51 billion
Company Overview
Founded in 1993 and headquartered in Louisiana, Pool (NASDAQ:POOL) is one of the largest wholesale distributors of swimming pool supplies, equipment, and related leisure products.
Pool's products include swimming pool supplies, equipment, and related outdoor living products, encompassing everything from chemicals, replacement parts, and accessories to furniture, grills, and decorative accents.
Pool operates through a vast network of sales centers across North America, Europe, and Australia. This extensive geographic footprint allows the company to serve diverse customers, including swimming pool
Pool's business model emphasizes strong supplier relationships and efficient supply chain management. Acquisitions have also been a crucial component of its growth strategy. By acquiring smaller regional distributors and competitors, Pool has been able to expand its geographic footprint, enter new markets, and bring in additional product lines and customer bases.
4. Consumer Discretionary - Specialized Consumer Services
The Consumer Discretionary sector, by definition, is made up of companies selling non-essential goods and services. When economic conditions deteriorate or tastes shift, consumers can easily cut back or eliminate these purchases. For long-term investors with five-year holding periods, this creates a structural challenge: the sector is inherently hit-driven, with low switching costs and fickle customers. As a result, only a handful of companies can reliably grow demand and compound earnings over long periods, which is why our bar is high and High Quality ratings are rare.
Some consumer discretionary companies don’t fall neatly into a category because their products or services are unique. Although their offerings may be niche, these companies have often found more efficient or technology-enabled ways of doing or selling something that has existed for a while. Technology can be a double-edged sword, though, as it may lower the barriers to entry for new competitors and allow them to do serve customers better.
Pool’s primary competitors include Leslie's (NASDAQ:LESL), Hayward Holdings (NYSE:HAYW), Pentair (NYSE:PNR), and Fluidra S.A. (BME:FDR).
5. Revenue Growth
A company’s long-term sales performance can indicate its overall quality. Any business can put up a good quarter or two, but many enduring ones grow for years. Regrettably, Pool’s sales grew at a weak 6.1% compounded annual growth rate over the last five years. This was below our standard for the consumer discretionary sector and is a rough starting point for our analysis.
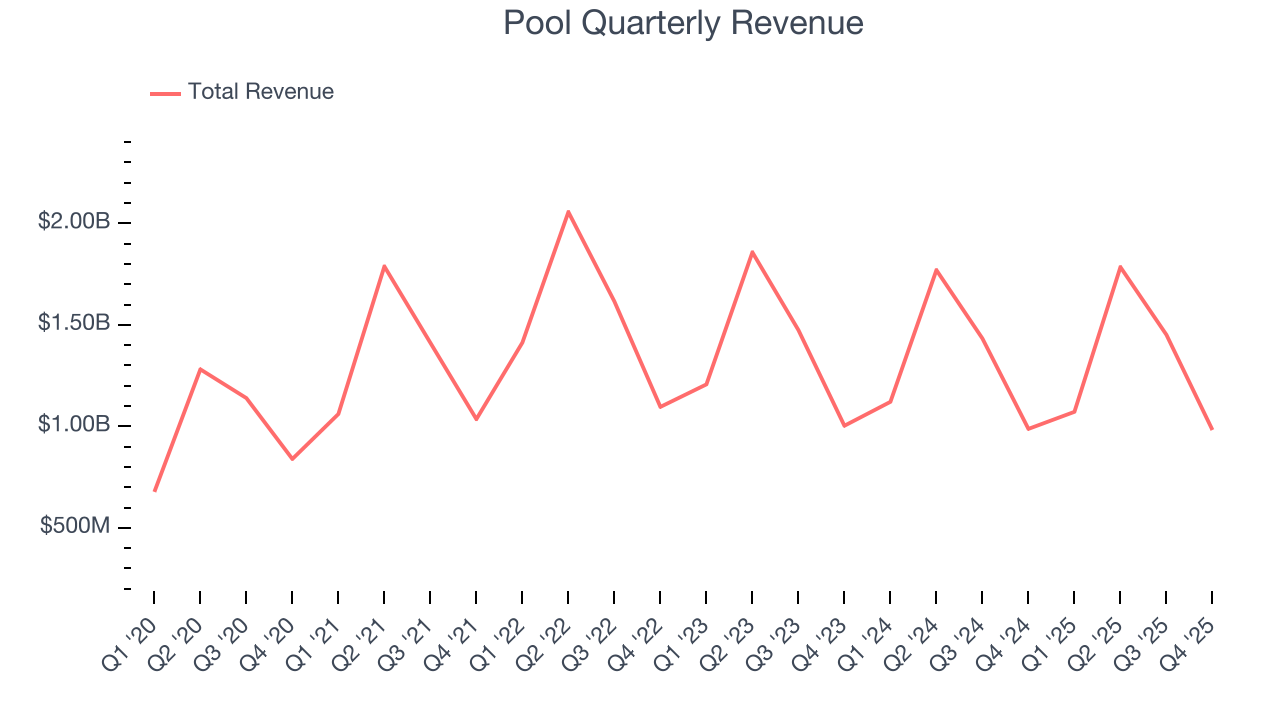
Long-term growth is the most important, but within consumer discretionary, product cycles are short and revenue can be hit-driven due to rapidly changing trends and consumer preferences. Pool’s performance shows it grew in the past but relinquished its gains over the last two years, as its revenue fell by 2.3% annually. 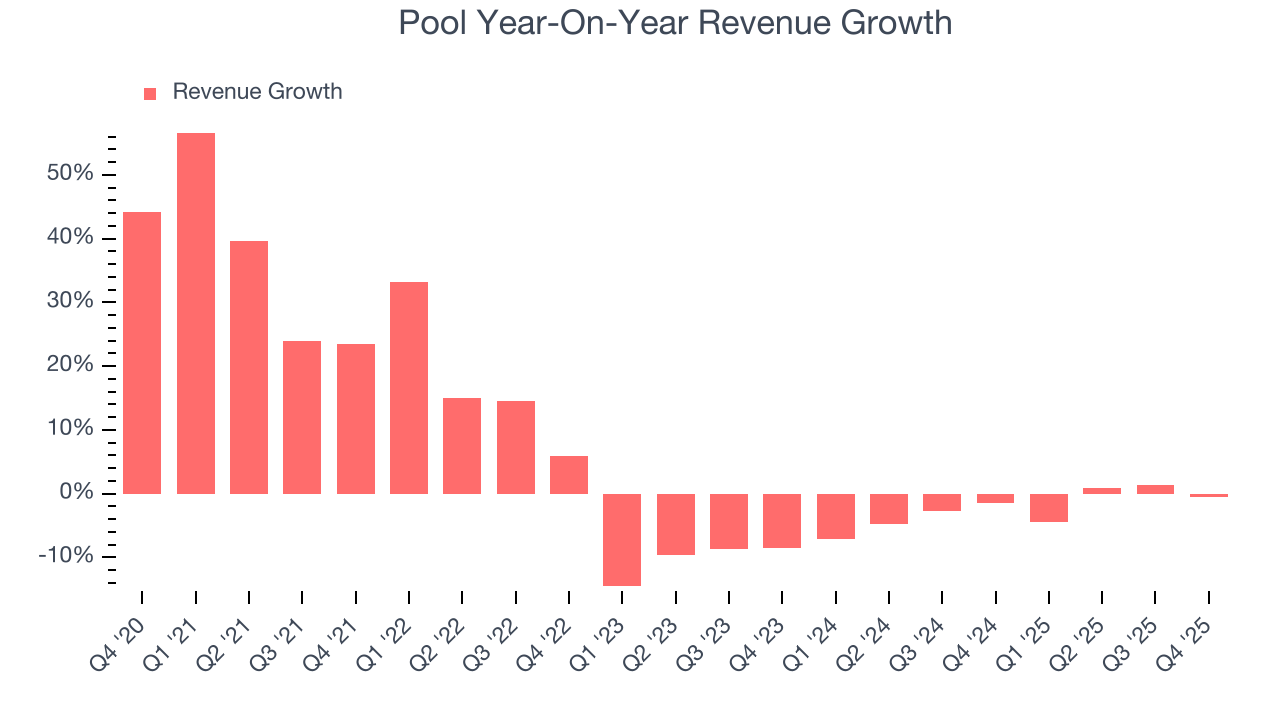
This quarter, Pool missed Wall Street’s estimates and reported a rather uninspiring 0.5% year-on-year revenue decline, generating $982.2 million of revenue.
Looking ahead, sell-side analysts expect revenue to grow 3.7% over the next 12 months. While this projection indicates its newer products and services will spur better top-line performance, it is still below average for the sector.
6. Operating Margin
Pool’s operating margin might fluctuated slightly over the last 12 months but has remained more or less the same, averaging 11.3% over the last two years. This profitability was inadequate for a consumer discretionary business and caused by its suboptimal cost structure.
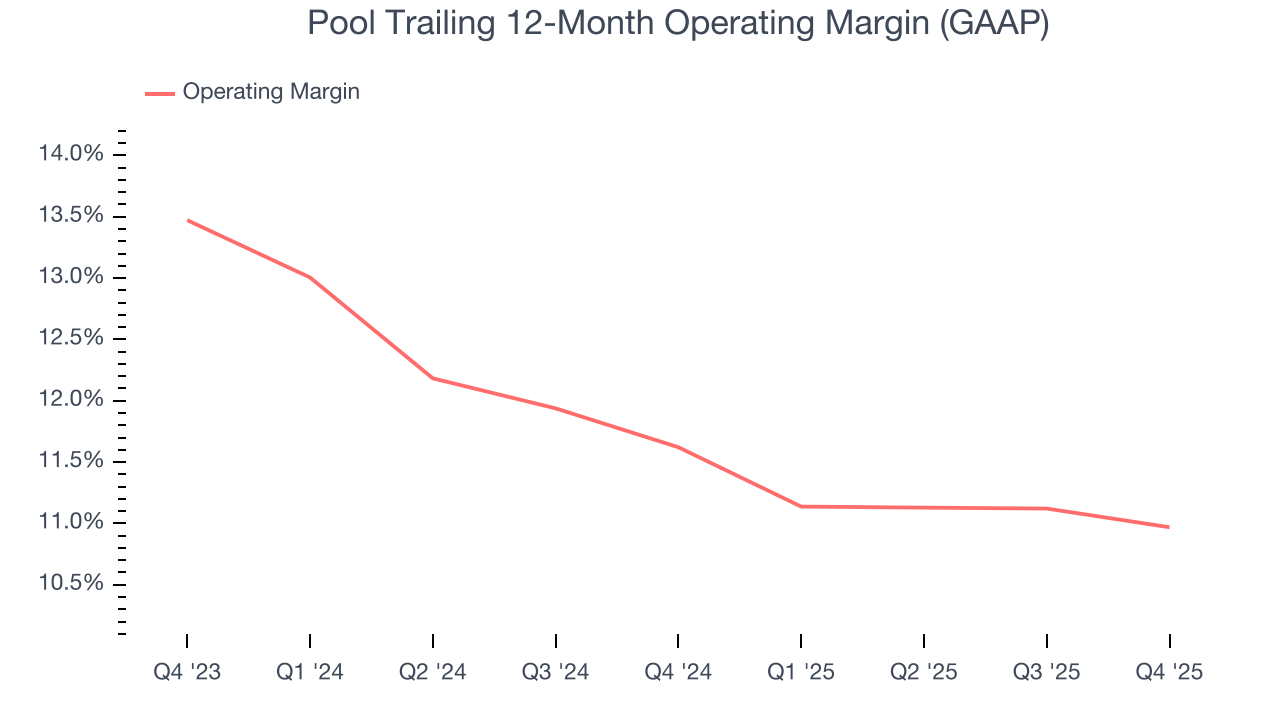
In Q4, Pool generated an operating margin profit margin of 5.3%, in line with the same quarter last year. This indicates the company’s overall cost structure has been relatively stable.
7. Earnings Per Share
Revenue trends explain a company’s historical growth, but the long-term change in earnings per share (EPS) points to the profitability of that growth – for example, a company could inflate its sales through excessive spending on advertising and promotions.
Pool’s EPS grew at a weak 3.8% compounded annual growth rate over the last five years, lower than its 6.1% annualized revenue growth. This tells us the company became less profitable on a per-share basis as it expanded due to non-fundamental factors such as interest expenses and taxes.
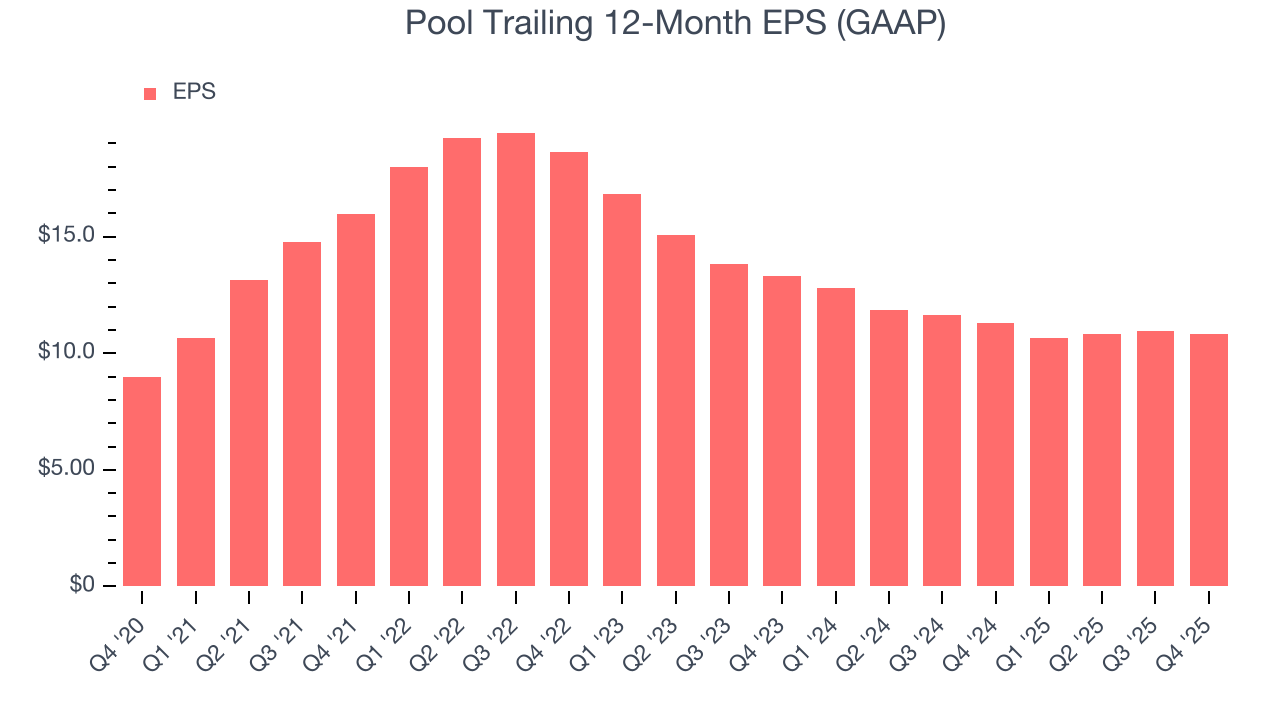
In Q4, Pool reported EPS of $0.85, down from $0.98 in the same quarter last year. This print missed analysts’ estimates. Over the next 12 months, Wall Street expects Pool’s full-year EPS of $10.83 to grow 7.4%.
8. Cash Is King
Although earnings are undoubtedly valuable for assessing company performance, we believe cash is king because you can’t use accounting profits to pay the bills.
Pool has shown poor cash profitability over the last two years, giving the company limited opportunities to return capital to shareholders. Its free cash flow margin averaged 8.6%, lousy for a consumer discretionary business.
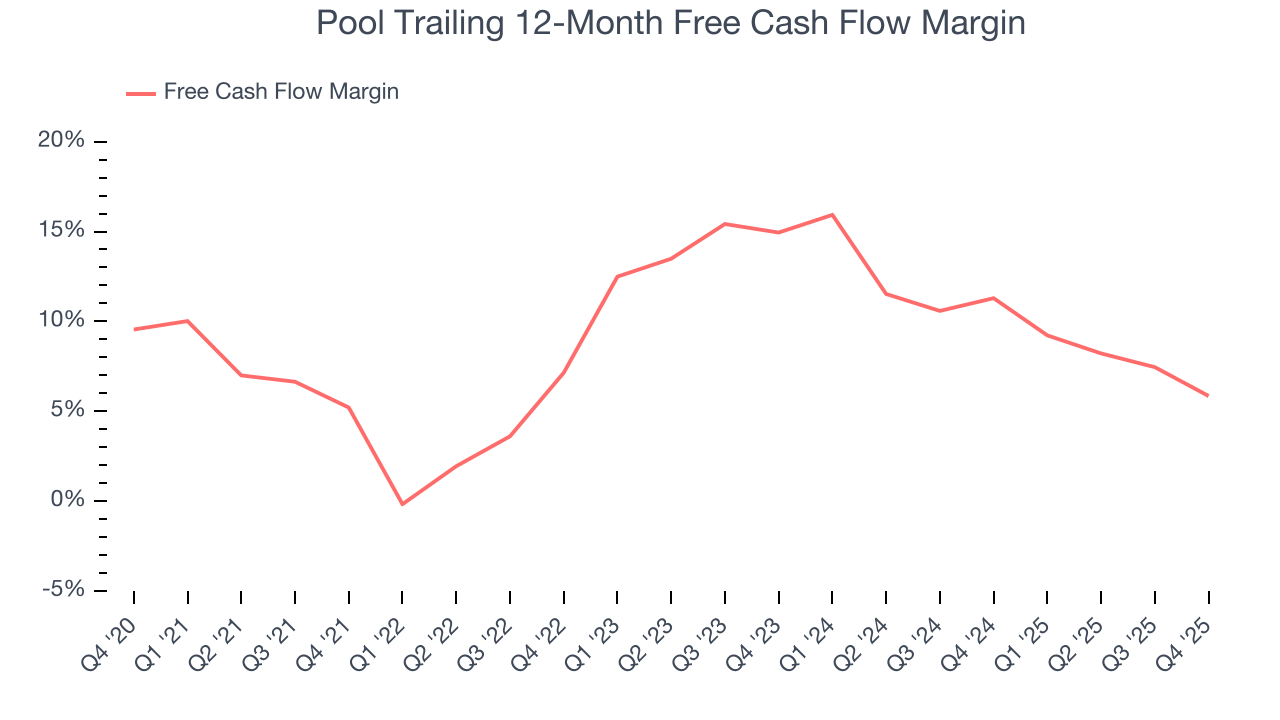
Pool’s free cash flow clocked in at $71.9 million in Q4, equivalent to a 7.3% margin. The company’s cash profitability regressed as it was 8.6 percentage points lower than in the same quarter last year, prompting us to pay closer attention. Short-term fluctuations typically aren’t a big deal because investment needs can be seasonal, but we’ll be watching to see if the trend extrapolates into future quarters.
Over the next year, analysts predict Pool’s cash conversion will improve. Their consensus estimates imply its free cash flow margin of 5.9% for the last 12 months will increase to 9.5%, giving it more flexibility for investments, share buybacks, and dividends.
9. Return on Invested Capital (ROIC)
EPS and free cash flow tell us whether a company was profitable while growing its revenue. But was it capital-efficient? Enter ROIC, a metric showing how much operating profit a company generates relative to the money it has raised (debt and equity).
Pool historically did a mediocre job investing in profitable growth initiatives. Its five-year average ROIC was 25.9%, somewhat low compared to the best consumer discretionary companies that consistently pump out 25%+.
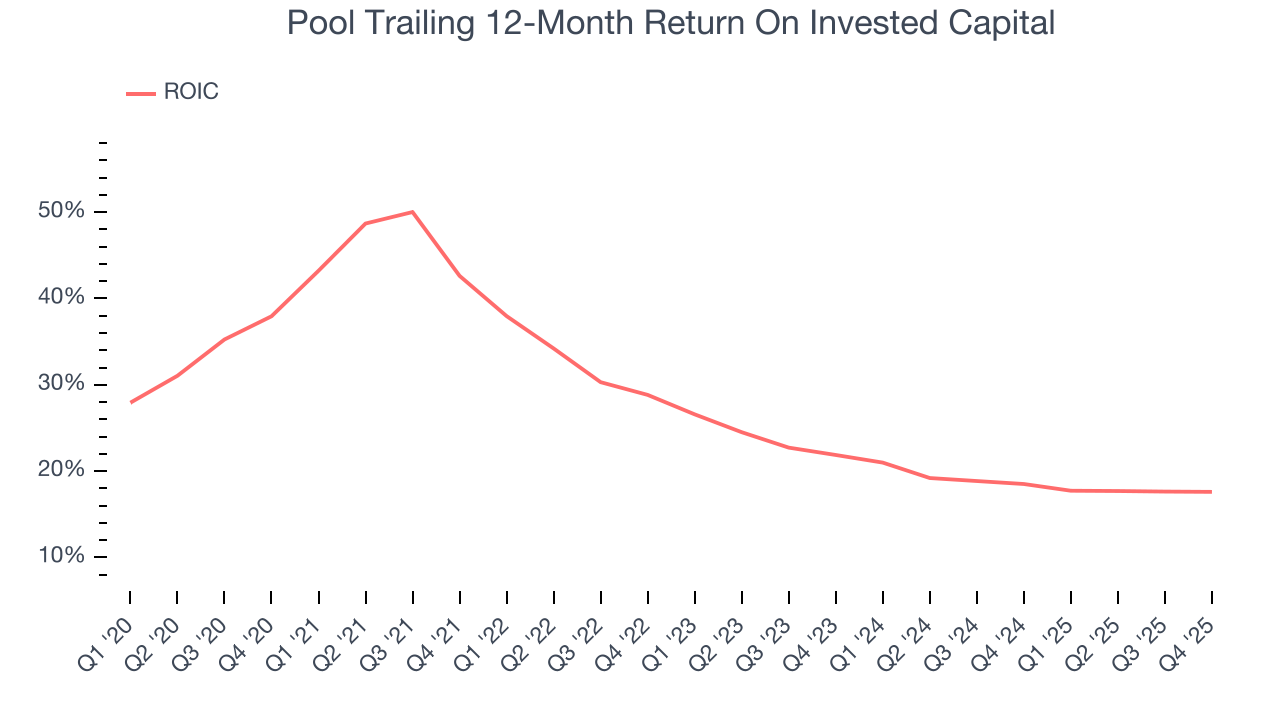
We like to invest in businesses with high returns, but the trend in a company’s ROIC is what often surprises the market and moves the stock price. Over the last few years, Pool’s ROIC has unfortunately decreased significantly. Paired with its already low returns, these declines suggest its profitable growth opportunities are few and far between.
10. Balance Sheet Assessment
Pool reported $105 million of cash and $1.54 billion of debt on its balance sheet in the most recent quarter. As investors in high-quality companies, we primarily focus on two things: 1) that a company’s debt level isn’t too high and 2) that its interest payments are not excessively burdening the business.
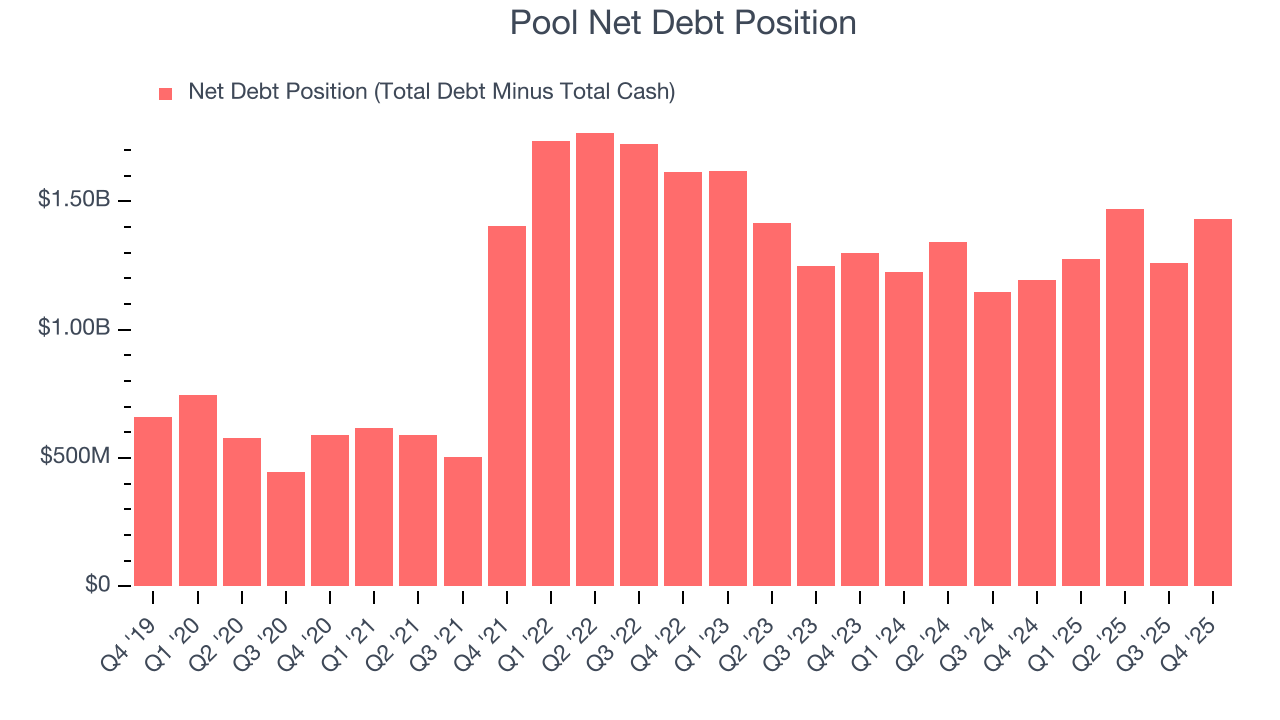
With $654.3 million of EBITDA over the last 12 months, we view Pool’s 2.2× net-debt-to-EBITDA ratio as safe. We also see its $24 million of annual interest expenses as appropriate. The company’s profits give it plenty of breathing room, allowing it to continue investing in growth initiatives.
11. Key Takeaways from Pool’s Q4 Results
We struggled to find many positives in these results. Its EPS missed and its full-year EPS guidance fell short of Wall Street’s estimates. Overall, this quarter could have been better. The stock traded down 6.6% to $238.40 immediately following the results.
12. Is Now The Time To Buy Pool?
Updated: March 15, 2026 at 11:06 PM EDT
Are you wondering whether to buy Pool or pass? We urge investors to not only consider the latest earnings results but also longer-term business quality and valuation as well.
We cheer for all companies serving everyday consumers, but in the case of Pool, we’ll be cheering from the sidelines. On top of that, Pool’s Forecasted free cash flow margin suggests the company will have more capital to invest or return to shareholders next year, and its weak EPS growth over the last five years shows it’s failed to produce meaningful profits for shareholders.
Pool’s P/E ratio based on the next 12 months is 18.6x. At this valuation, there’s a lot of good news priced in - we think there are better stocks to buy right now.
Wall Street analysts have a consensus one-year price target of $266.09 on the company (compared to the current share price of $206.04).
Although the price target is bullish, readers should exercise caution because analysts tend to be overly optimistic. The firms they work for, often big banks, have relationships with companies that extend into fundraising, M&A advisory, and other rewarding business lines. As a result, they typically hesitate to say bad things for fear they will lose out. We at StockStory do not suffer from such conflicts of interest, so we’ll always tell it like it is.