Reynolds (REYN)
We wouldn’t buy Reynolds. Its weak gross margin and failure to generate revenue growth show it lacks demand and decent unit economics.― StockStory Analyst Team
1. News


2. Summary
Why We Think Reynolds Will Underperform
Best known for its aluminum foil, Reynolds (NASDAQ:REYN) is a household products company whose products focus on food storage, cooking, and waste.
- Products fail to spark excitement with consumers, as seen in its flat sales over the last three years
- Organic revenue growth fell short of our benchmarks over the past two years and implies it may need to improve its products, pricing, or go-to-market strategy
- Projected sales for the next 12 months are flat and suggest demand will be subdued


Reynolds doesn’t live up to our standards. There are more promising alternatives.
Why There Are Better Opportunities Than Reynolds


At $21.03 per share, Reynolds trades at 13.3x forward P/E. Yes, this valuation multiple is lower than that of other consumer staples peers, but we’ll remind you that you often get what you pay for.
Our advice is to pay up for elite businesses whose advantages are tailwinds to earnings growth. Don’t get sucked into lower-quality businesses just because they seem like bargains. These mediocre businesses often never achieve a higher multiple as hoped, a phenomenon known as a “value trap”.
3. Reynolds (REYN) Research Report: Q4 CY2025 Update
Household products company Reynolds (NASDAQ:REYN) reported Q4 CY2025 results topping the market’s revenue expectations, with sales up 1.3% year on year to $1.03 billion. On the other hand, next quarter’s revenue guidance of $809.8 million was less impressive, coming in 3.3% below analysts’ estimates. Its non-GAAP profit of $0.59 per share was in line with analysts’ consensus estimates.
Reynolds (REYN) Q4 CY2025 Highlights:
- Revenue: $1.03 billion vs analyst estimates of $1.01 billion (1.3% year-on-year growth, 2.9% beat)
- Adjusted EPS: $0.59 vs analyst estimates of $0.59 (in line)
- Adjusted EBITDA: $220 million vs analyst estimates of $214.5 million (21.3% margin, 2.5% beat)
- Revenue Guidance for Q1 CY2026 is $809.8 million at the midpoint, below analyst estimates of $837.9 million
- Adjusted EPS guidance for the upcoming financial year 2026 is $1.60 at the midpoint, missing analyst estimates by 8.3%
- EBITDA guidance for the upcoming financial year 2026 is $667.5 million at the midpoint, below analyst estimates of $681.8 million
- Operating Margin: 17%, in line with the same quarter last year
- Free Cash Flow Margin: 19.3%, up from 13.8% in the same quarter last year
- Organic Revenue rose 1% year on year (beat)
- Sales Volumes fell 2% year on year (2% in the same quarter last year)
- Market Capitalization: $4.59 billion
Company Overview
Best known for its aluminum foil, Reynolds (NASDAQ:REYN) is a household products company whose products focus on food storage, cooking, and waste.
The company and its famous foil trace their roots back to 1947 when a nephew of the Reynolds Tobacco Company founder established Reynolds Metals Company. From there, the company expanded its line of kitchen and cooking products to include parchment paper, wax paper, containers for food storage, and others. In 2010, Reynolds further expanded its portfolio with a strategic acquisition that added the Hefty brand of trash bags.
Reynolds targets middle-income consumers, especially those who cook at home for themselves or their family members. These customers are looking for proven brands that are competitive in price versus alternatives. Given Reynolds’ brand awareness, though, the company’s products don’t need to be the absolute cheapest. Many consumers are willing to pay a reasonable premium to buy established brands rather than lesser-known or private-label brands.
It’s quite easy to find Reynolds’ products for sale, and the company tends to dominate the section or aisle for food storage. Traditional brick-and-mortar retailers such as supermarkets, mass merchants, drug stores, and specialty stores are the most common sellers of the company’s products. Given Reynolds’ scale and traffic-driving brands, the company often has prominent placement on retailer shelves.
4. Household Products
Household products stocks are generally stable investments, as many of the industry's products are essential for a comfortable and functional living space. Recently, there's been a growing emphasis on eco-friendly and sustainable offerings, reflecting the evolving consumer preferences for environmentally conscious options. These trends can be double-edged swords that benefit companies who innovate quickly to take advantage of them and hurt companies that don't invest enough to meet consumers where they want to be with regards to trends.
Competitors that offer household products, especially in the areas of food preparation and storage, include Proctor & Gamble (NYSE:PG), Clorox (NYSE:CLX), and Kimberly-Clark (NYSE:KMB).
5. Revenue Growth
Examining a company’s long-term performance can provide clues about its quality. Any business can experience short-term success, but top-performing ones enjoy sustained growth for years.
With $3.72 billion in revenue over the past 12 months, Reynolds carries some recognizable products but is a mid-sized consumer staples company. Its size could bring disadvantages compared to larger competitors benefiting from better brand awareness and economies of scale.
As you can see below, Reynolds struggled to increase demand as its $3.72 billion of sales for the trailing 12 months was close to its revenue three years ago. This is mainly because consumers bought less of its products - we’ll explore what this means in the "Volume Growth" section.
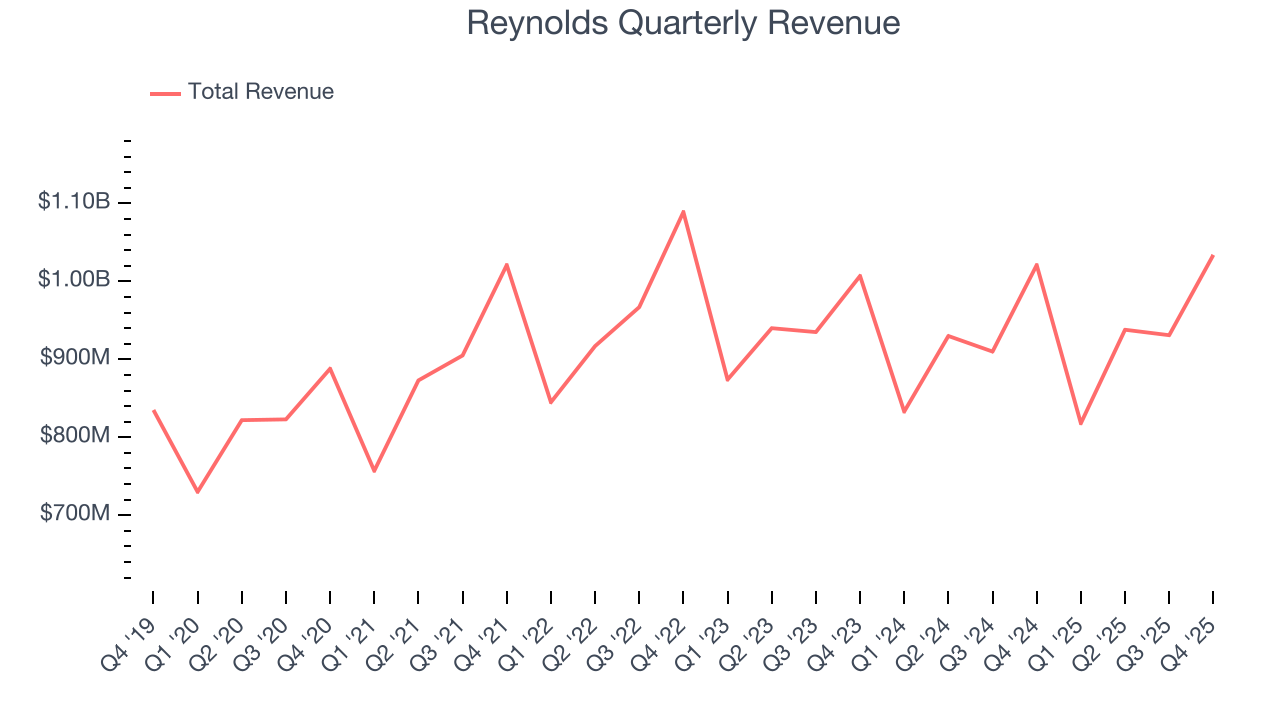
This quarter, Reynolds reported modest year-on-year revenue growth of 1.3% but beat Wall Street’s estimates by 2.9%. Company management is currently guiding for a 1% year-on-year decline in sales next quarter.
Looking further ahead, sell-side analysts expect revenue to grow 1.2% over the next 12 months. Although this projection indicates its newer products will fuel better top-line performance, it is still below average for the sector.
6. Volume Growth
Revenue growth can be broken down into changes in price and volume (the number of units sold). While both are important, volume is the lifeblood of a successful staples business as there’s a ceiling to what consumers will pay for everyday goods; they can always trade down to non-branded products if the branded versions are too expensive.
To analyze whether Reynolds generated its growth (or lack thereof) from changes in price or volume, we can compare its volume growth to its organic revenue growth, which excludes non-fundamental impacts on company financials like mergers and currency fluctuations.
Over the last two years, Reynolds’s average quarterly sales volumes have shrunk by 1%. This isn’t ideal for a consumer staples company, where demand is typically stable.
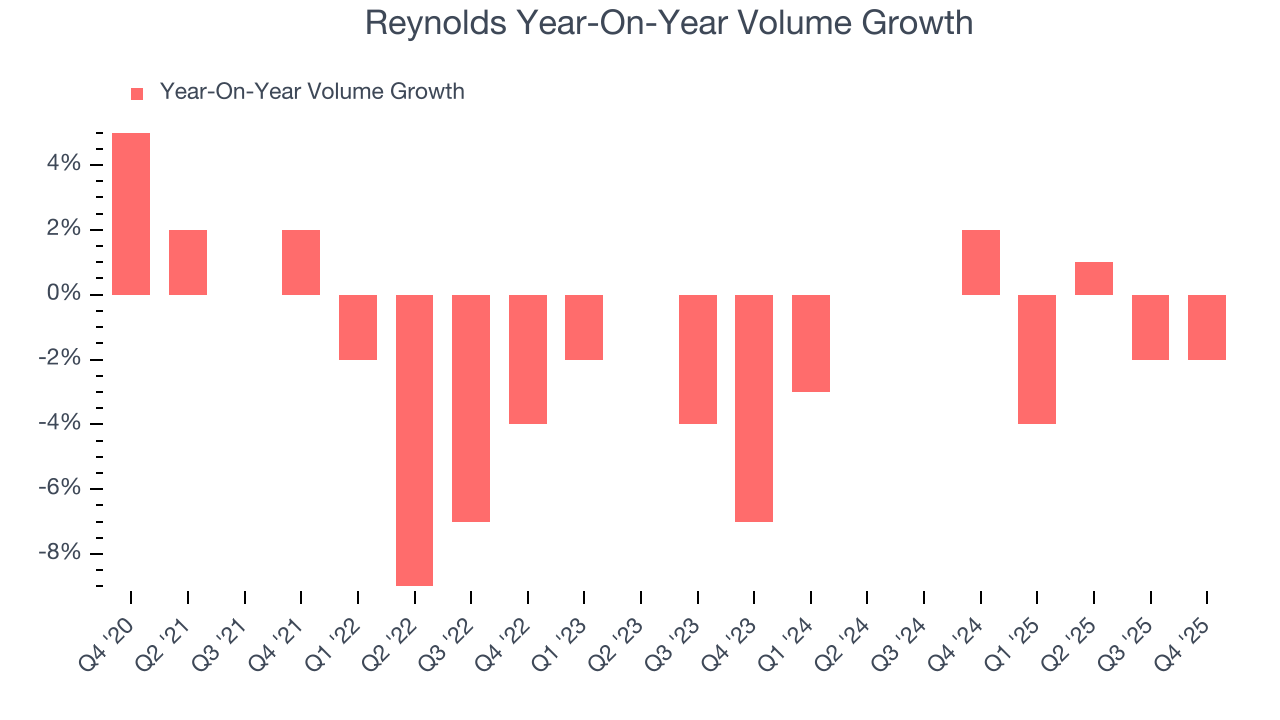
In Reynolds’s Q4 2025, sales volumes dropped 2% year on year. This result represents a further deceleration from its historical levels, showing the business is struggling to move its products.
7. Gross Margin & Pricing Power
Reynolds has bad unit economics for a consumer staples company, giving it less room to reinvest and develop new products. As you can see below, it averaged a 25.5% gross margin over the last two years. Said differently, for every $100 in revenue, a chunky $74.50 went towards paying for raw materials, production of goods, transportation, and distribution. 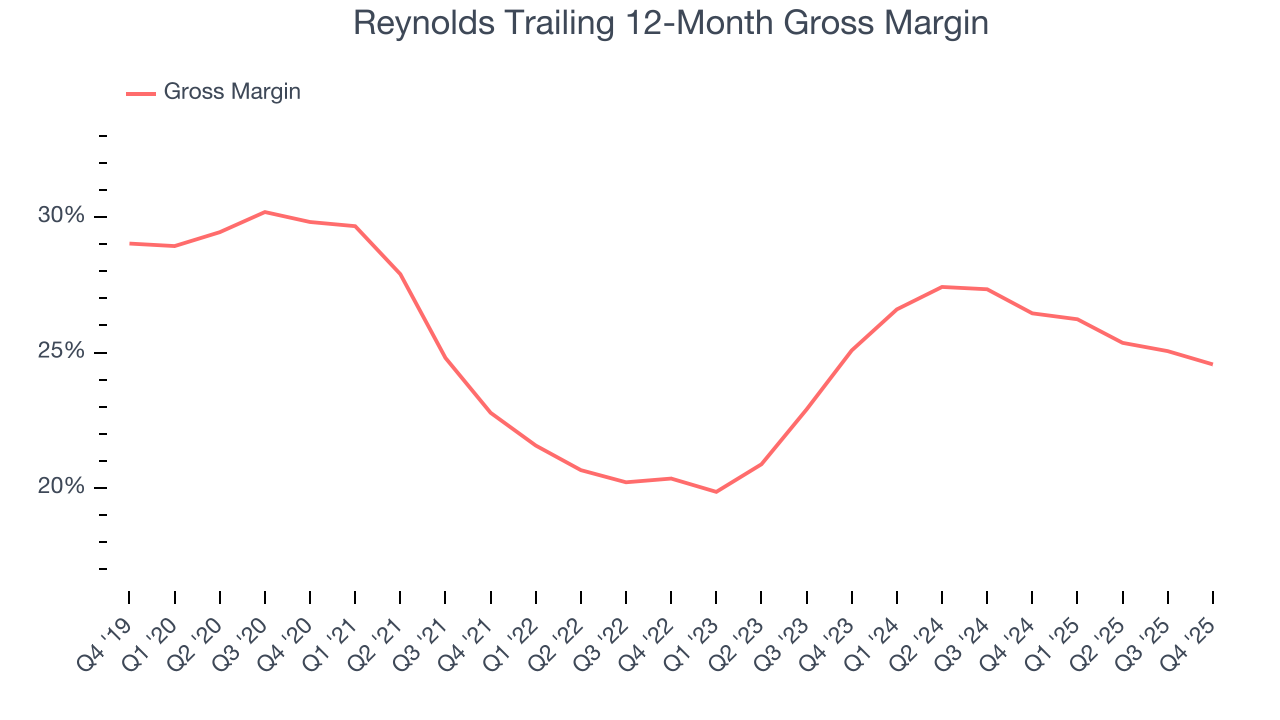
In Q4, Reynolds produced a 25.7% gross profit margin, marking a 1.8 percentage point decrease from 27.5% in the same quarter last year. Reynolds’s full-year margin has also been trending down over the past 12 months, decreasing by 1.9 percentage points. If this move continues, it could suggest a more competitive environment with some pressure to lower prices and higher input costs (such as raw materials and manufacturing expenses).
8. Operating Margin
Operating margin is an important measure of profitability as it shows the portion of revenue left after accounting for all core expenses – everything from the cost of goods sold to advertising and wages. It’s also useful for comparing profitability across companies with different levels of debt and tax rates because it excludes interest and taxes.
Reynolds has managed its cost base well over the last two years. It demonstrated solid profitability for a consumer staples business, producing an average operating margin of 14%. This result was particularly impressive because of its low gross margin, which is mostly a factor of what it sells and takes huge shifts to move meaningfully. Companies have more control over their operating margins, and it’s a show of well-managed operations if they’re high when gross margins are low.
Analyzing the trend in its profitability, Reynolds’s operating margin decreased by 1.6 percentage points over the last year. Even though its historical margin was healthy, shareholders will want to see Reynolds become more profitable in the future.
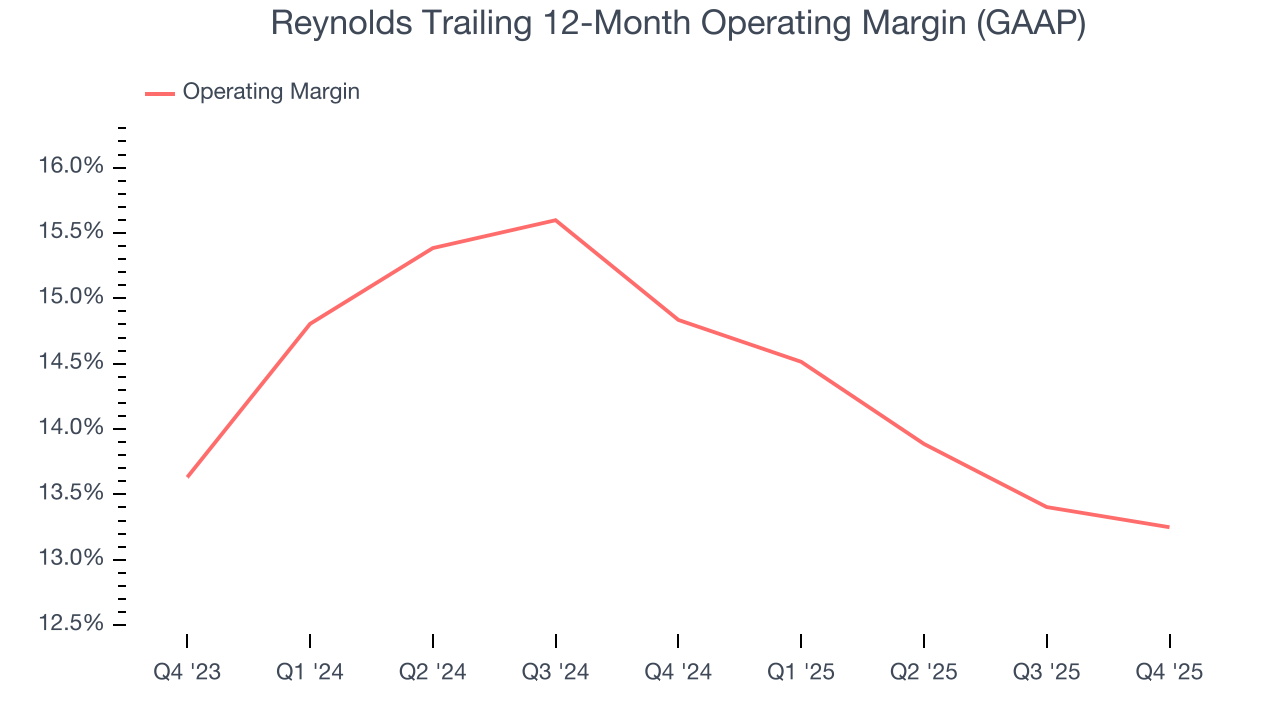
This quarter, Reynolds generated an operating margin profit margin of 17%, in line with the same quarter last year. This indicates the company’s cost structure has recently been stable.
9. Earnings Per Share
Revenue trends explain a company’s historical growth, but the long-term change in earnings per share (EPS) points to the profitability of that growth – for example, a company could inflate its sales through excessive spending on advertising and promotions.
Reynolds’s EPS grew at a decent 8.1% compounded annual growth rate over the last three years, higher than its flat revenue. This tells us management responded to softer demand by adapting its cost structure.
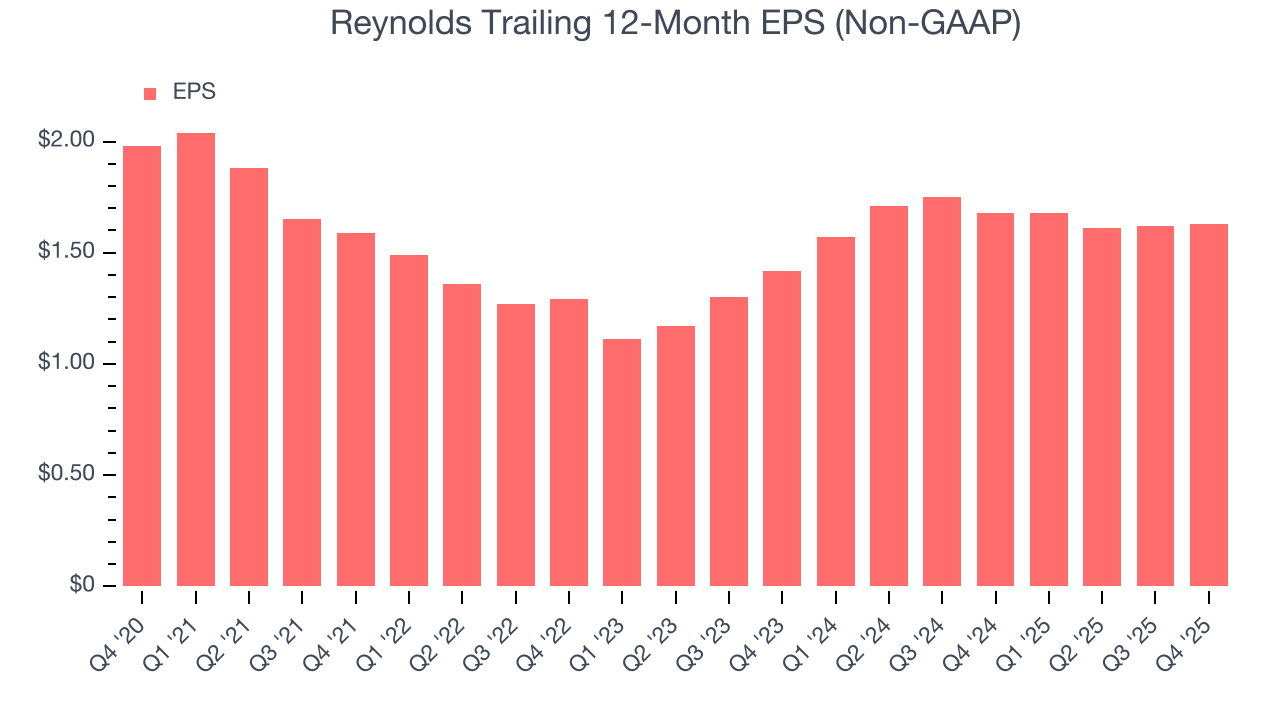
In Q4, Reynolds reported adjusted EPS of $0.59, up from $0.58 in the same quarter last year. This print was close to analysts’ estimates. Over the next 12 months, Wall Street expects Reynolds’s full-year EPS of $1.63 to grow 6.6%.
10. Cash Is King
Free cash flow isn't a prominently featured metric in company financials and earnings releases, but we think it's telling because it accounts for all operating and capital expenses, making it tough to manipulate. Cash is king.
Reynolds has shown robust cash profitability, giving it an edge over its competitors and the ability to reinvest or return capital to investors. The company’s free cash flow margin averaged 9.2% over the last two years, quite impressive for a consumer staples business.
Taking a step back, we can see that Reynolds’s margin dropped by 1.5 percentage points over the last year. Continued declines could signal it is in the middle of an investment cycle.
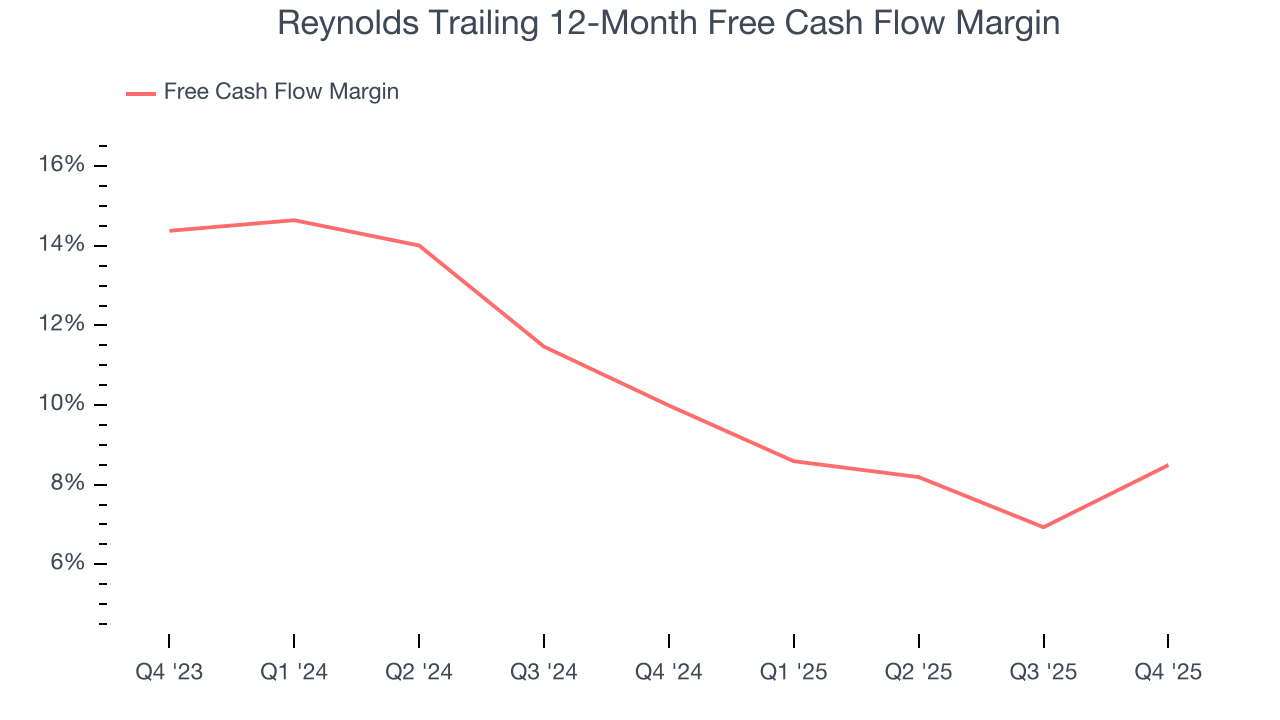
Reynolds’s free cash flow clocked in at $200 million in Q4, equivalent to a 19.3% margin. This result was good as its margin was 5.5 percentage points higher than in the same quarter last year, but we wouldn’t read too much into the short term because investment needs can be seasonal, causing temporary swings. Long-term trends carry greater meaning.
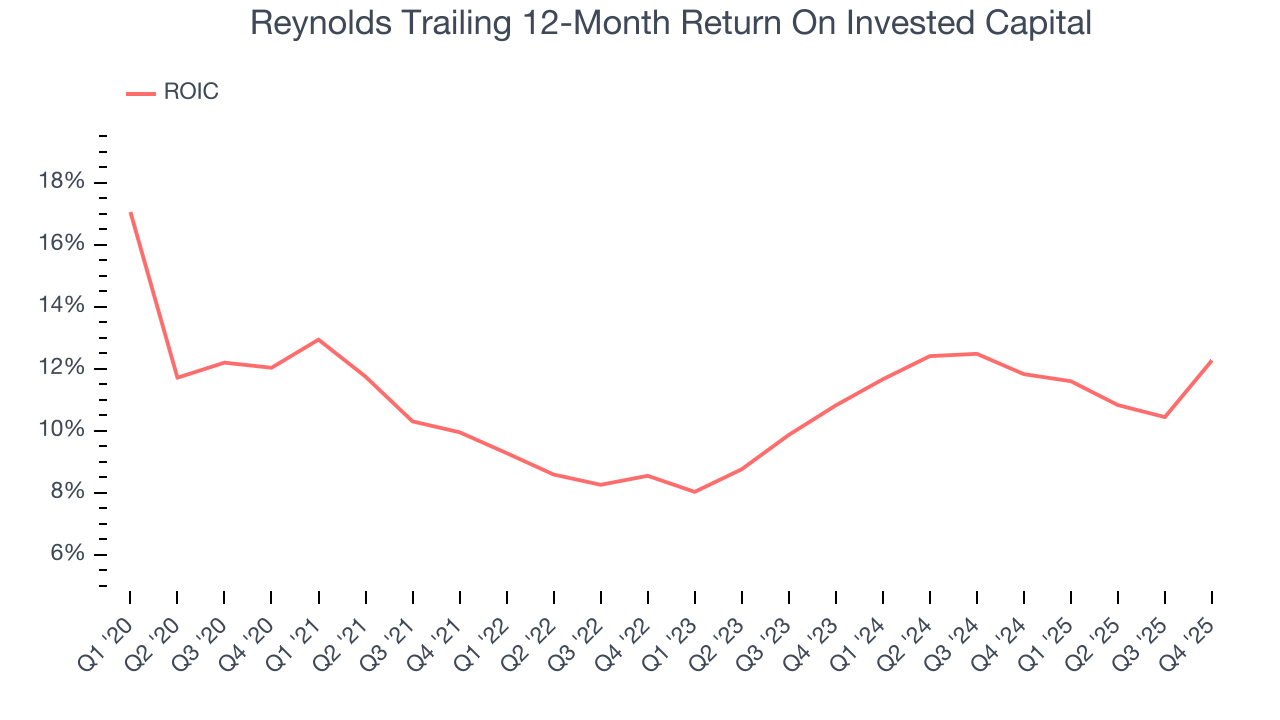
11. Return on Invested Capital (ROIC)
EPS and free cash flow tell us whether a company was profitable while growing its revenue. But was it capital-efficient? Enter ROIC, a metric showing how much operating profit a company generates relative to the money it has raised (debt and equity).
Reynolds’s management team makes decent investment decisions and generates value for shareholders. Its five-year average ROIC was 10.7%, slightly better than typical consumer staples business.
12. Balance Sheet Assessment
Reynolds reported $147 million of cash and $1.68 billion of debt on its balance sheet in the most recent quarter. As investors in high-quality companies, we primarily focus on two things: 1) that a company’s debt level isn’t too high and 2) that its interest payments are not excessively burdening the business.
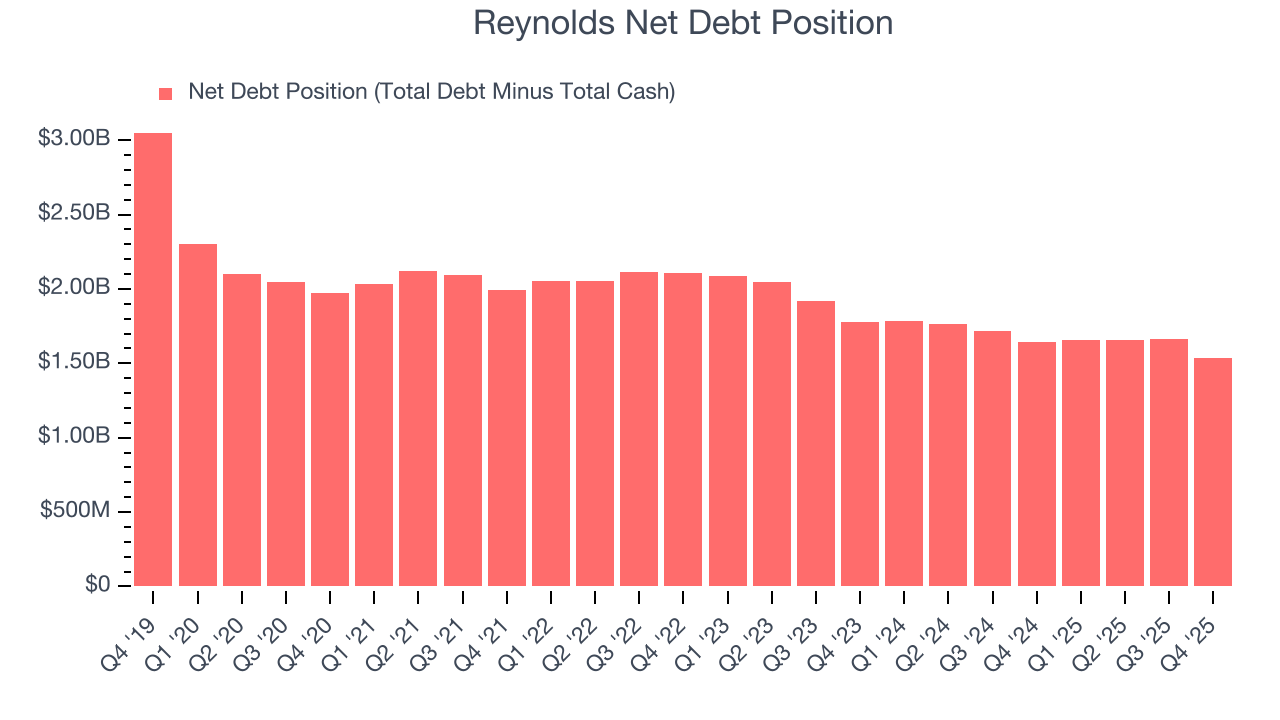
With $668 million of EBITDA over the last 12 months, we view Reynolds’s 2.3× net-debt-to-EBITDA ratio as safe. We also see its $87 million of annual interest expenses as appropriate. The company’s profits give it plenty of breathing room, allowing it to continue investing in growth initiatives.
13. Key Takeaways from Reynolds’s Q4 Results
We enjoyed seeing Reynolds beat analysts’ organic revenue expectations this quarter. We were also happy its revenue outperformed Wall Street’s estimates. On the other hand, its gross margin missed and its revenue guidance for next quarter fell short of Wall Street’s estimates. Overall, this print was mixed. The stock remained flat at $21.69 immediately after reporting.
14. Is Now The Time To Buy Reynolds?
Updated: March 26, 2026 at 10:55 PM EDT
The latest quarterly earnings matters, sure, but we actually think longer-term fundamentals and valuation matter more. Investors should consider all these pieces before deciding whether or not to invest in Reynolds.
Reynolds doesn’t pass our quality test. To begin with, its revenue has declined over the last three years, and analysts don’t see anything changing over the next 12 months. While its strong free cash flow generation allows it to invest in growth initiatives while maintaining an ample cushion, the downside is its projected EPS for the next year is lacking. On top of that, its gross margins indicate a disadvantaged starting point for the overall profitability of the business.
Reynolds’s P/E ratio based on the next 12 months is 13.3x. This valuation multiple is fair, but we don’t have much confidence in the company. There are superior stocks to buy right now.
Wall Street analysts have a consensus one-year price target of $26.29 on the company (compared to the current share price of $21.03).
Although the price target is bullish, readers should exercise caution because analysts tend to be overly optimistic. The firms they work for, often big banks, have relationships with companies that extend into fundraising, M&A advisory, and other rewarding business lines. As a result, they typically hesitate to say bad things for fear they will lose out. We at StockStory do not suffer from such conflicts of interest, so we’ll always tell it like it is.