
SAIC (SAIC)
SAIC is up against the odds. Its weak sales growth shows demand is soft and its low margins are a cause for concern.― StockStory Analyst Team
1. News


2. Summary
Why We Think SAIC Will Underperform
With over five decades of experience supporting national security missions, Science Applications International Corporation (NASDAQ:SAIC) provides technical, engineering, and enterprise IT services primarily to U.S. government agencies and military branches.
- Products and services are facing significant end-market challenges during this cycle as sales have declined by 2.1% annually over the last two years
- Demand will likely be weak over the next 12 months as Wall Street expects flat revenue
- Responsiveness to unforeseen market trends is restricted due to its substandard adjusted operating margin profitability


SAIC falls short of our expectations. We believe there are better businesses elsewhere.
Why There Are Better Opportunities Than SAIC


At $91.63 per share, SAIC trades at 10x forward P/E. Yes, this valuation multiple is lower than that of other business services peers, but we’ll remind you that you often get what you pay for.
Cheap stocks can look like a great deal at first glance, but they can be value traps. They often have less earnings power, meaning there is more reliance on a re-rating to generate good returns - an unlikely scenario for low-quality companies.
3. SAIC (SAIC) Research Report: Q4 CY2025 Update
Government IT services provider Science Applications International Corporation (NASDAQ:SAIC) missed Wall Street’s revenue expectations in Q4 CY2025, with sales falling 4.8% year on year to $1.75 billion. The company’s full-year revenue guidance of $7.1 billion at the midpoint came in 2.8% below analysts’ estimates. Its non-GAAP profit of $2.62 per share was 30% above analysts’ consensus estimates.
SAIC (SAIC) Q4 CY2025 Highlights:
- Revenue: $1.75 billion vs analyst estimates of $1.77 billion (4.8% year-on-year decline, 1% miss)
- Adjusted EPS: $2.62 vs analyst estimates of $2.01 (30% beat)
- Adjusted EBITDA: $181 million vs analyst estimates of $171.2 million (10.3% margin, 5.7% beat)
- Adjusted EPS guidance for the upcoming financial year 2027 is $9.60 at the midpoint, in line with analyst estimates
- EBITDA guidance for the upcoming financial year 2027 is $710 million at the midpoint, in line with analyst expectations
- Operating Margin: 7.6%, in line with the same quarter last year
- Free Cash Flow Margin: 19.2%, up from 12.8% in the same quarter last year
- Backlog: $22.62 billion at quarter end, up 3.5% year on year
- Market Capitalization: $4.15 billion
Company Overview
With over five decades of experience supporting national security missions, Science Applications International Corporation (NASDAQ:SAIC) provides technical, engineering, and enterprise IT services primarily to U.S. government agencies and military branches.
SAIC operates at the intersection of technology and national security, delivering complex solutions that help government agencies modernize their IT infrastructure, enhance digital capabilities, and address evolving threats. The company's services span the entire technology lifecycle—from design and development to integration, deployment, and ongoing management.
The company's portfolio includes IT modernization, where SAIC helps agencies transition to cloud computing environments while maintaining security and compliance requirements. Its digital engineering services create virtual models of complex systems before physical development, reducing costs and accelerating delivery. SAIC has also expanded into artificial intelligence solutions, helping government clients harness data for improved decision-making and operational efficiency.
For defense customers, SAIC provides critical support for weapon systems across all military branches. For example, when the Army needs to upgrade vehicle fleets with new communications or protection systems, SAIC engineers can design, integrate, and implement these modifications while ensuring interoperability with existing systems. The company also delivers training and simulation technologies that prepare military personnel for complex missions without the risks and costs of live exercises.
SAIC generates revenue primarily through government contracts, operating approximately 1,800 active contracts and task orders. The company maintains long-term relationships with key customers including the Army, Navy, Air Force, and intelligence agencies. While predominantly serving U.S. federal clients, SAIC's business model relies on winning competitive contract awards and delivering solutions that meet strict government requirements for security, reliability, and performance.
4. Government & Technical Consulting
The sector has historically benefitted from steady government spending on defense, infrastructure, and regulatory compliance, providing firms long-term contract stability. However, the Trump administration is showing more willingness than previous administrations to upend government spending and bloat. Whether or not defense budgets get cut, the rising demand for cybersecurity, AI-driven defense solutions, and sustainability consulting should benefit the sector for years, as agencies and enterprises seek expertise in navigating complex technology and regulations. Additionally, industrial automation and digital engineering are driving efficiency gains in infrastructure and technical consulting projects, which could help profit margins.
SAIC competes with large defense contractors that offer IT services alongside hardware systems, such as General Dynamics (NYSE:GD), Northrop Grumman (NYSE:NOC), and RTX Corporation (NYSE:RTX), as well as technical services specialists like Booz Allen Hamilton (NYSE:BAH), CACI International (NYSE:CACI), and Leidos Holdings (NYSE:LDOS).
5. Revenue Growth
A company’s long-term sales performance can indicate its overall quality. Any business can put up a good quarter or two, but many enduring ones grow for years.
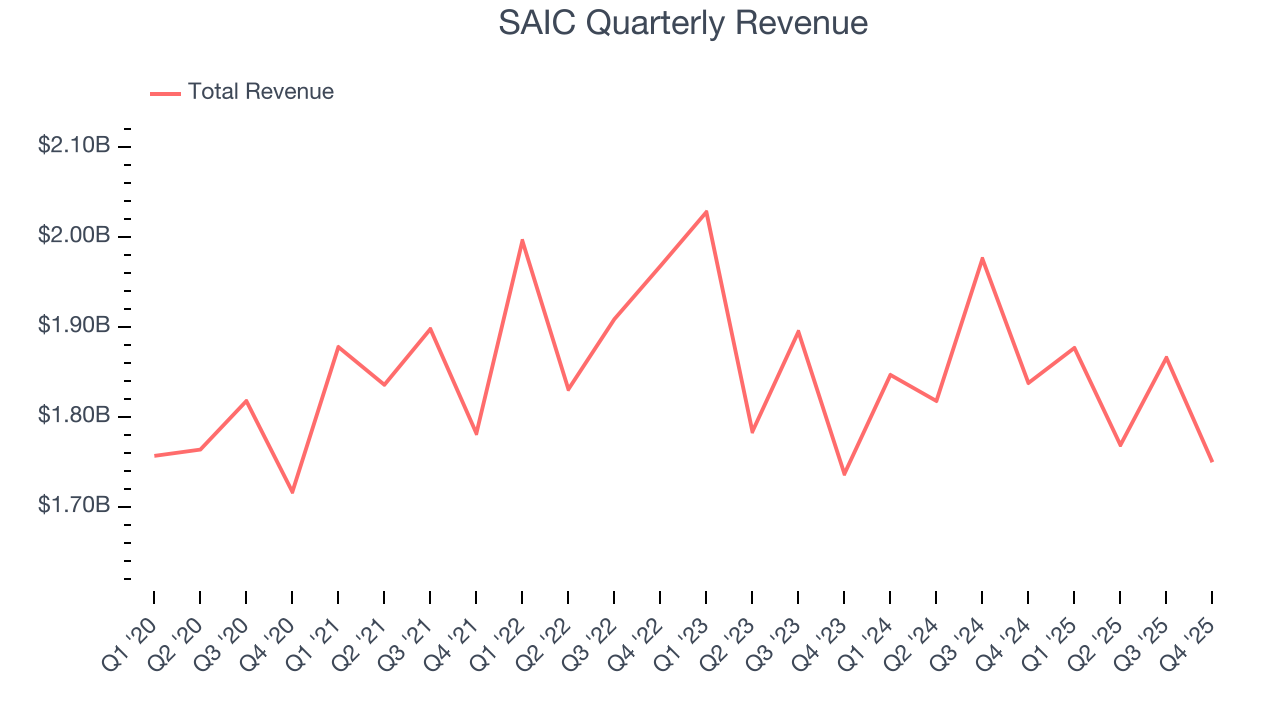
With $7.26 billion in revenue over the past 12 months, SAIC is one of the larger companies in the business services industry and benefits from a well-known brand that influences purchasing decisions. However, its scale is a double-edged sword because finding new avenues for growth becomes difficult when you already have a substantial market presence. To expand meaningfully, SAIC likely needs to tweak its prices, innovate with new offerings, or enter new markets.
As you can see below, SAIC struggled to increase demand as its $7.26 billion of sales for the trailing 12 months was close to its revenue five years ago. This shows demand was soft, a rough starting point for our analysis.
We at StockStory place the most emphasis on long-term growth, but within business services, a half-decade historical view may miss recent innovations or disruptive industry trends. SAIC’s recent performance shows its demand remained suppressed as its revenue has declined by 1.2% annually over the last two years. 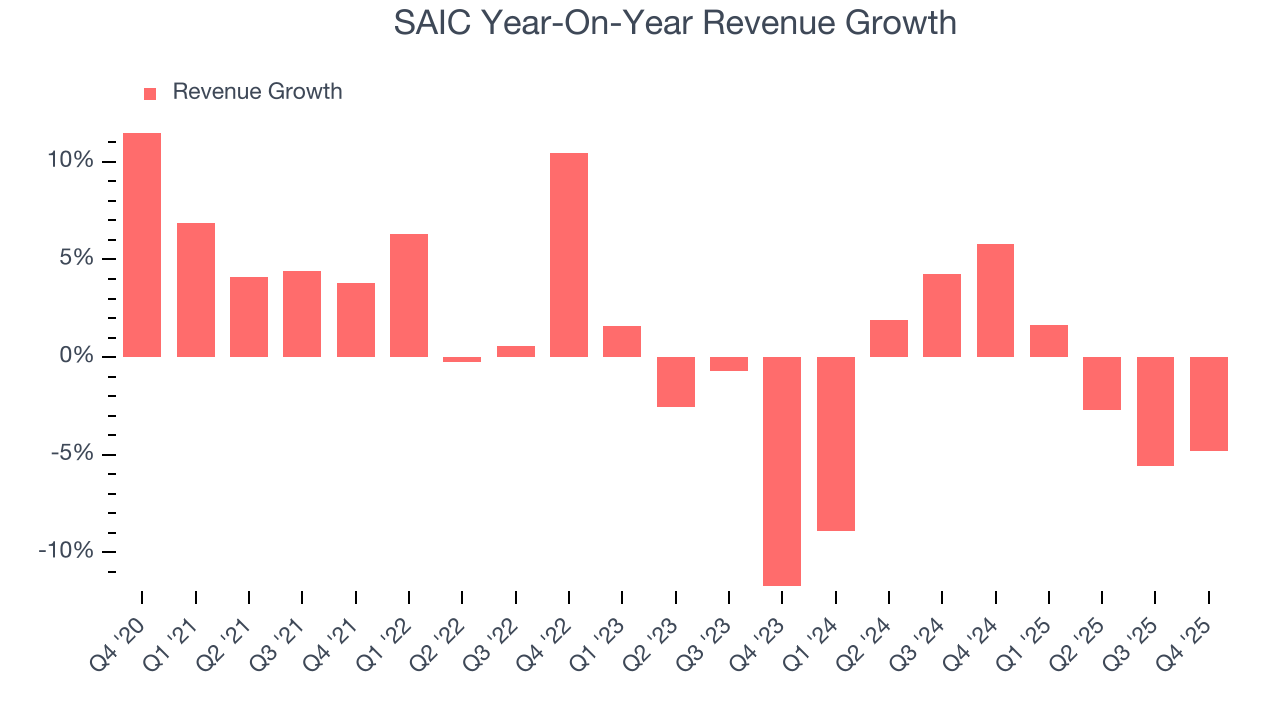
We can better understand the company’s revenue dynamics by analyzing its backlog, or the value of its outstanding orders that have not yet been executed or delivered. SAIC’s backlog reached $22.62 billion in the latest quarter and averaged 3.5% year-on-year growth over the last two years. Because this number is better than its revenue growth, we can see the company accumulated more orders than it could fulfill and deferred revenue to the future. This could imply elevated demand for SAIC’s products and services but raises concerns about capacity constraints. 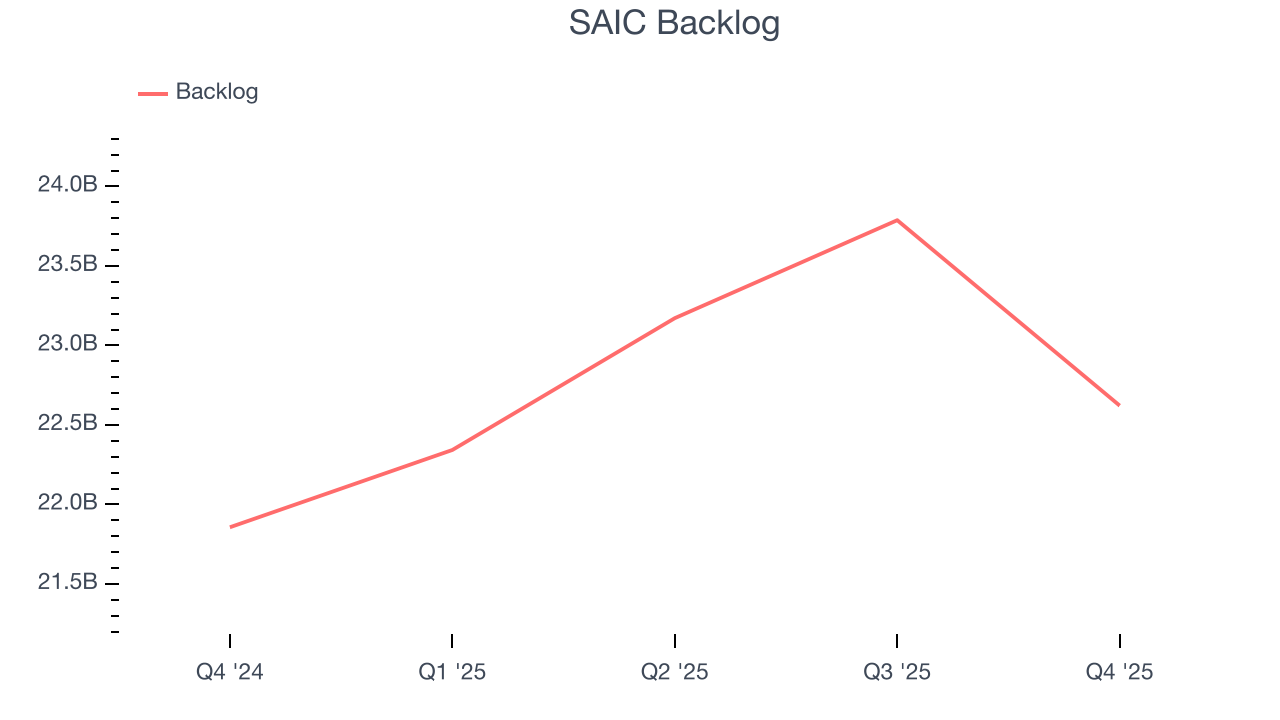
This quarter, SAIC missed Wall Street’s estimates and reported a rather uninspiring 4.8% year-on-year revenue decline, generating $1.75 billion of revenue.
Looking ahead, sell-side analysts expect revenue to remain flat over the next 12 months. While this projection implies its newer products and services will catalyze better top-line performance, it is still below average for the sector.
6. Operating Margin
SAIC’s operating margin has more or less stayed the same over the last 12 months , averaging 7.5% over the last five years. This profitability was paltry for a business services business and caused by its suboptimal cost structure.
Looking at the trend in its profitability, SAIC’s operating margin might fluctuated slightly but has generally stayed the same over the last five years, which doesn’t help its cause.
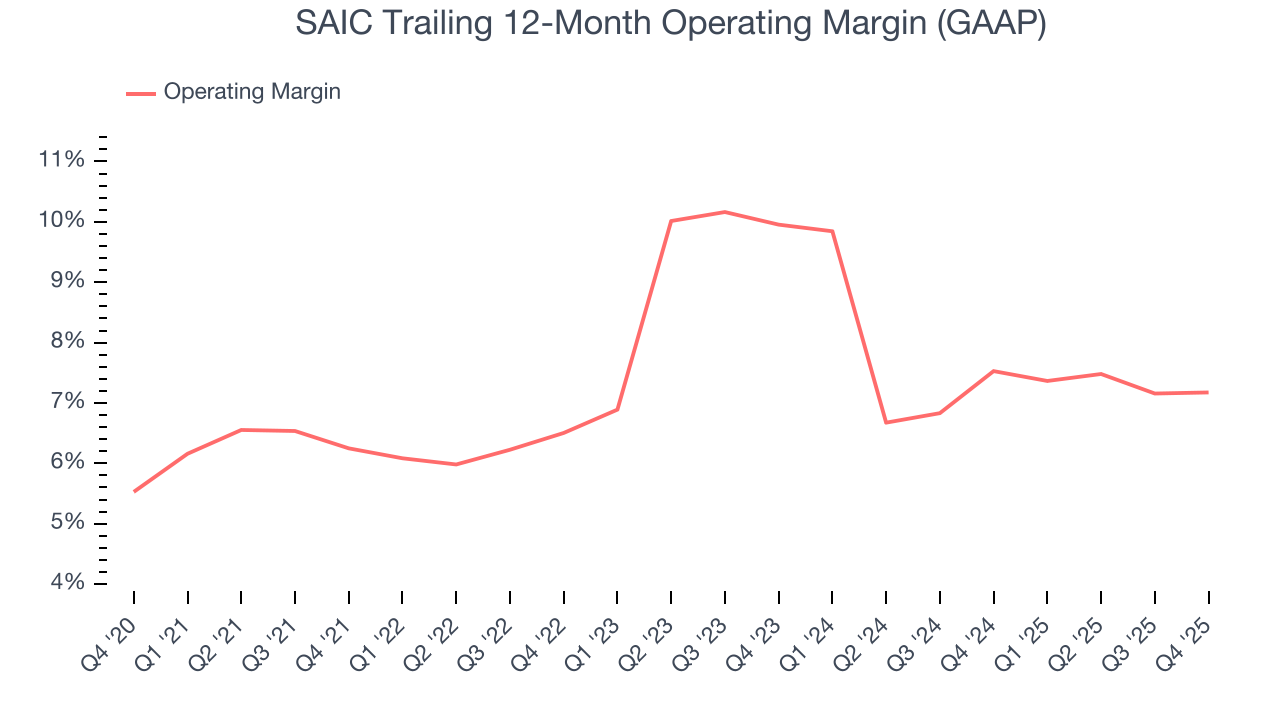
In Q4, SAIC generated an operating margin profit margin of 7.6%, in line with the same quarter last year. This indicates the company’s overall cost structure has been relatively stable.
7. Earnings Per Share
Revenue trends explain a company’s historical growth, but the long-term change in earnings per share (EPS) points to the profitability of that growth – for example, a company could inflate its sales through excessive spending on advertising and promotions.
SAIC’s EPS grew at 11.3% compounded annual growth rate over the last five years, higher than its flat revenue. This tells us management responded to softer demand by adapting its cost structure.
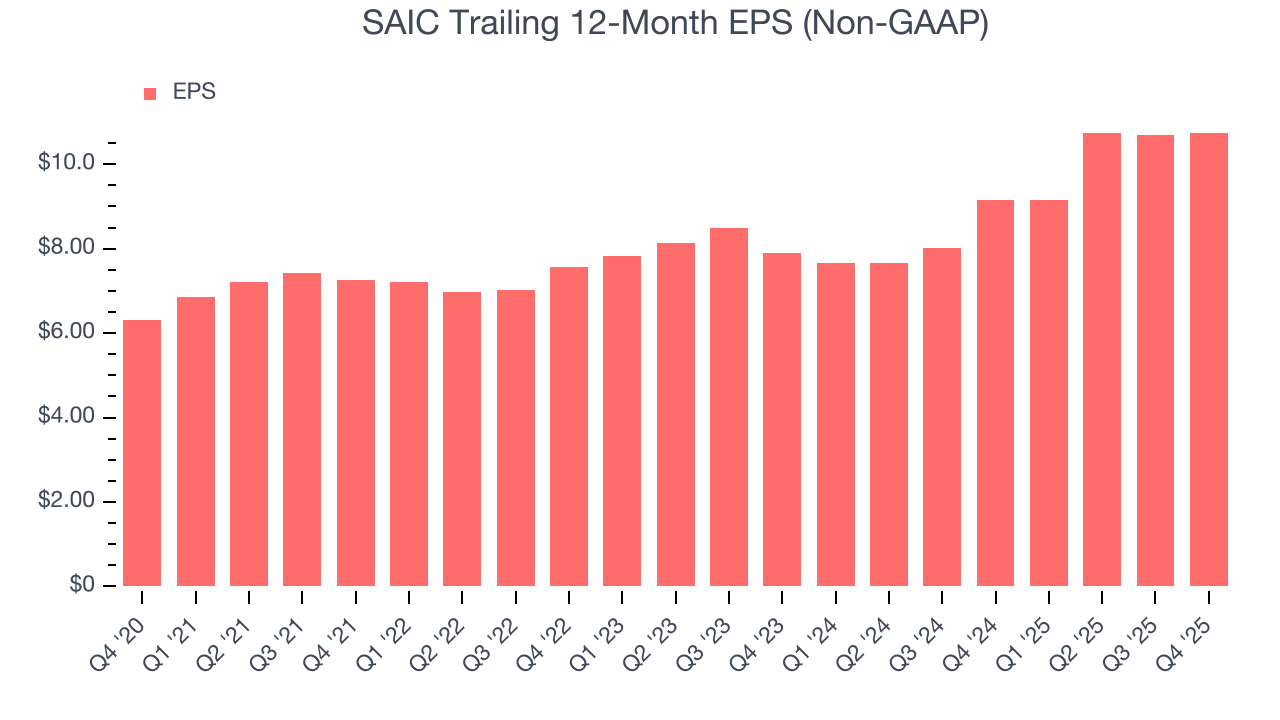
Like with revenue, we analyze EPS over a shorter period to see if we are missing a change in the business.
For SAIC, its two-year annual EPS growth of 16.7% was higher than its five-year trend. We love it when earnings growth accelerates, especially when it accelerates off an already high base.
In Q4, SAIC reported adjusted EPS of $2.62, up from $2.57 in the same quarter last year. This print easily cleared analysts’ estimates, and shareholders should be content with the results. Over the next 12 months, Wall Street expects SAIC’s full-year EPS of $10.75 to shrink by 10.3%.
8. Cash Is King
Free cash flow isn't a prominently featured metric in company financials and earnings releases, but we think it's telling because it accounts for all operating and capital expenses, making it tough to manipulate. Cash is king.
SAIC has shown decent cash profitability, giving it some flexibility to reinvest or return capital to investors. The company’s free cash flow margin averaged 6.5% over the last five years, slightly better than the broader business services sector.
Taking a step back, we can see that SAIC’s margin expanded by 1.6 percentage points during that time. This is encouraging because it gives the company more optionality.
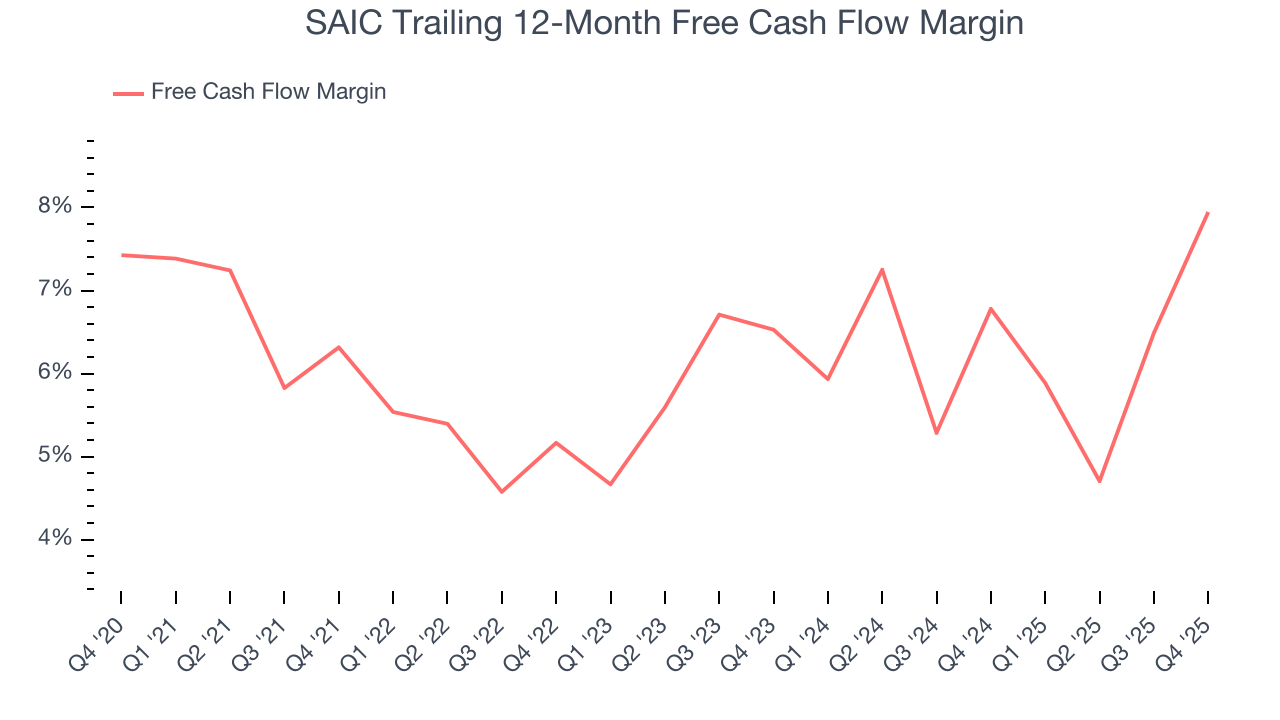
SAIC’s free cash flow clocked in at $336 million in Q4, equivalent to a 19.2% margin. This result was good as its margin was 6.4 percentage points higher than in the same quarter last year, building on its favorable historical trend.
9. Return on Invested Capital (ROIC)
EPS and free cash flow tell us whether a company was profitable while growing its revenue. But was it capital-efficient? Enter ROIC, a metric showing how much operating profit a company generates relative to the money it has raised (debt and equity).
SAIC’s management team makes decent investment decisions and generates value for shareholders. Its five-year average ROIC was 12.7%, slightly better than typical business services business.
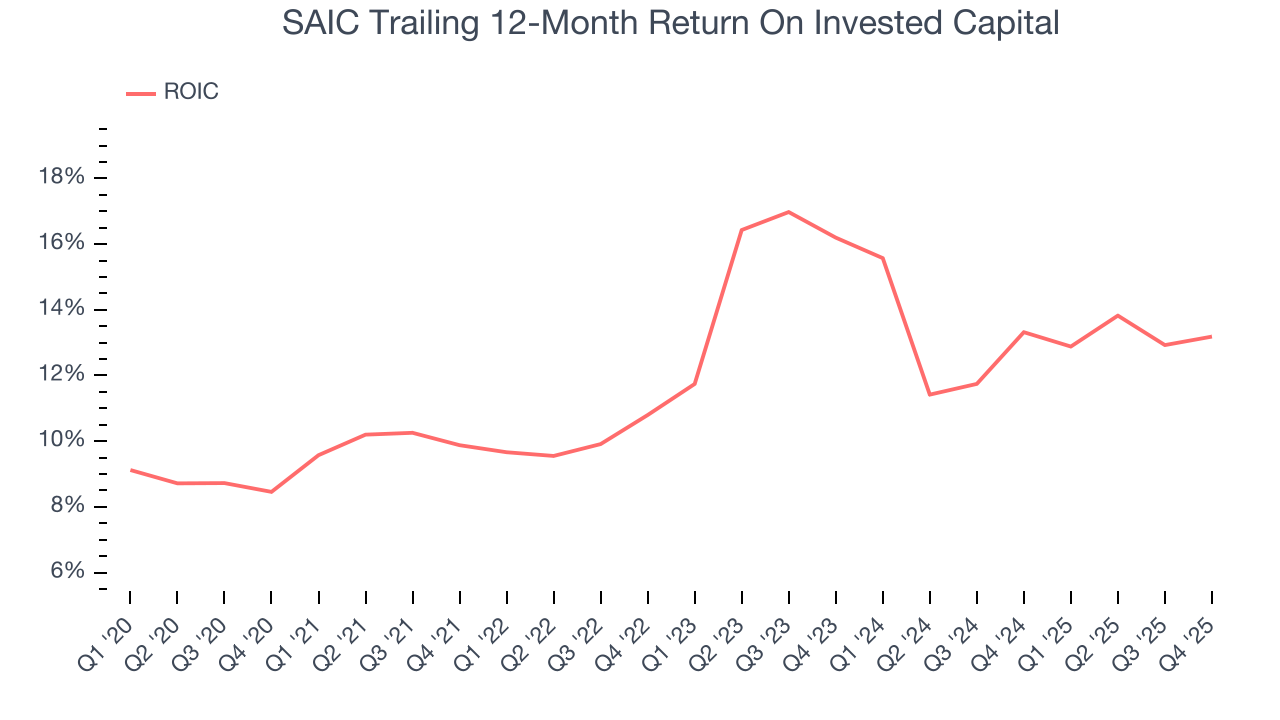
We like to invest in businesses with high returns, but the trend in a company’s ROIC is what often surprises the market and moves the stock price. On average, SAIC’s ROIC increased by 2.9 percentage points annually each year over the last few years. This is a good sign, and we hope the company can keep improving.
10. Balance Sheet Assessment
SAIC reported $182 million of cash and $2.69 billion of debt on its balance sheet in the most recent quarter. As investors in high-quality companies, we primarily focus on two things: 1) that a company’s debt level isn’t too high and 2) that its interest payments are not excessively burdening the business.
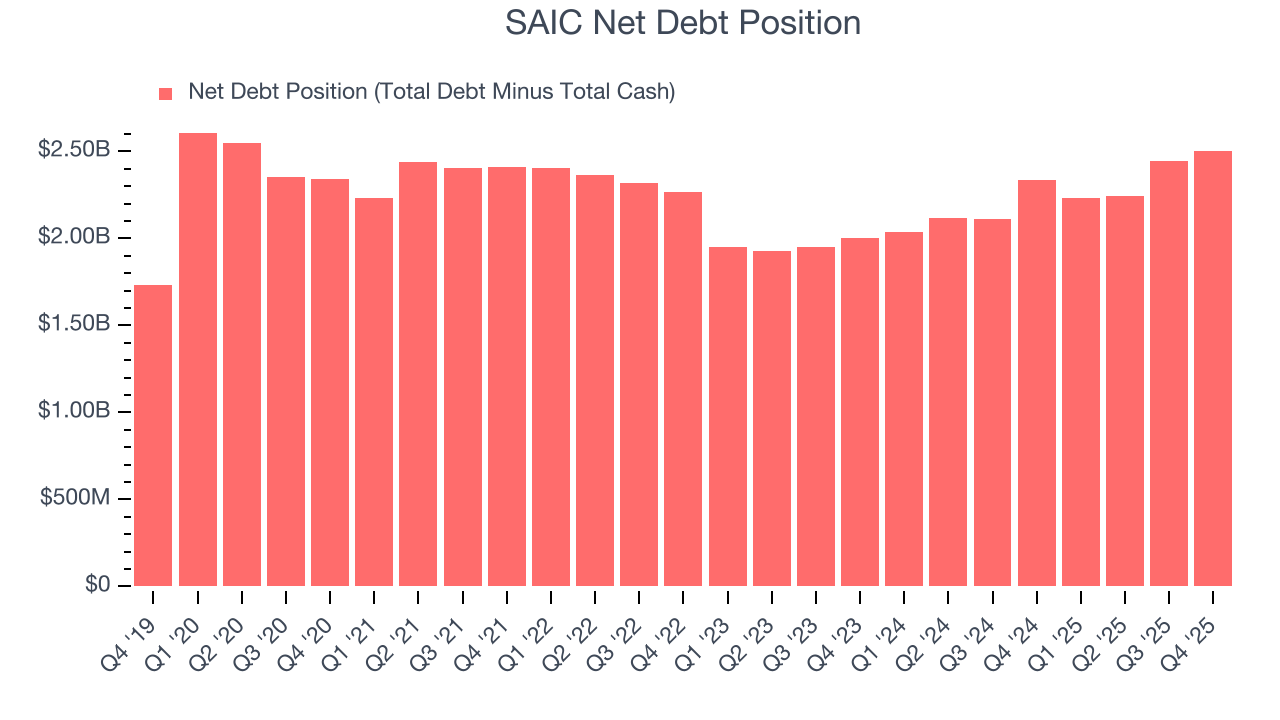
With $708 million of EBITDA over the last 12 months, we view SAIC’s 3.5× net-debt-to-EBITDA ratio as safe. We also see its $60 million of annual interest expenses as appropriate. The company’s profits give it plenty of breathing room, allowing it to continue investing in growth initiatives.
11. Key Takeaways from SAIC’s Q4 Results
It was good to see SAIC beat analysts’ EPS expectations this quarter. On the other hand, its revenue missed. Looking ahead, full-year revenue guidance fell short of Wall Street’s estimates, but EBITDA and EPS guidance were in line. Overall, this was a mixed quarter. The stock traded up 1.4% to $93.18 immediately following the results.
12. Is Now The Time To Buy SAIC?
Updated: March 16, 2026 at 7:12 AM EDT
Are you wondering whether to buy SAIC or pass? We urge investors to not only consider the latest earnings results but also longer-term business quality and valuation as well.
SAIC falls short of our quality standards. To kick things off, its revenue growth was weak over the last five years, and analysts don’t see anything changing over the next 12 months. While its scale and strong customer awareness give it negotiating power, the downside is its projected EPS for the next year is lacking. On top of that, its backlog growth has disappointed.
SAIC’s P/E ratio based on the next 12 months is 9.5x. While this valuation is optically cheap, the potential downside is huge given its shaky fundamentals. There are superior stocks to buy right now.
Wall Street analysts have a consensus one-year price target of $116.22 on the company (compared to the current share price of $93.18).
Although the price target is bullish, readers should exercise caution because analysts tend to be overly optimistic. The firms they work for, often big banks, have relationships with companies that extend into fundraising, M&A advisory, and other rewarding business lines. As a result, they typically hesitate to say bad things for fear they will lose out. We at StockStory do not suffer from such conflicts of interest, so we’ll always tell it like it is.