
Sinclair (SBGI)
We wouldn’t buy Sinclair. Its plummeting sales and returns on capital show its profits are shrinking as demand fizzles out.― StockStory Analyst Team
1. News


2. Summary
Why We Think Sinclair Will Underperform
With over 2,400 hours of local news produced weekly and 640 broadcast channels reaching millions of American homes, Sinclair (NASDAQ:SBGI) operates a network of 185 local television stations across 86 U.S. markets, producing news programming and distributing content from major networks.
- Sales tumbled by 11.8% annually over the last five years, showing market trends are working against its favor during this cycle
- Earnings per share decreased by more than its revenue over the last five years, showing each sale was less profitable
- High net-debt-to-EBITDA ratio of 8× increases the risk of forced asset sales or dilutive financing if operational performance weakens


Sinclair’s quality isn’t up to par. Better stocks can be found in the market.
Why There Are Better Opportunities Than Sinclair


Sinclair is trading at $13.97 per share, or 19.9x forward P/E. This multiple is higher than most business services companies, and we think it’s quite expensive for the weaker revenue growth you get.
There are stocks out there similarly priced with better business quality. We prefer owning these.
3. Sinclair (SBGI) Research Report: Q4 CY2025 Update
Media broadcasting company Sinclair (NASDAQ:SBGI) met Wall Street’s revenue expectations in Q4 CY2025, but sales fell by 16.7% year on year to $836 million. On the other hand, the company’s full-year revenue guidance of $3.47 billion at the midpoint came in 0.8% below analysts’ estimates. Its GAAP profit of $1.55 per share was significantly above analysts’ consensus estimates.
Sinclair (SBGI) Q4 CY2025 Highlights:
- Revenue: $836 million vs analyst estimates of $839.7 million (16.7% year-on-year decline, in line)
- EPS (GAAP): $1.55 vs analyst estimates of -$0.25 (significant beat)
- Adjusted EBITDA: $168 million vs analyst estimates of $148.4 million (20.1% margin, 13.2% beat)
- Operating Margin: 9.6%, down from 26.5% in the same quarter last year
- Market Capitalization: $979.8 million
Company Overview
With over 2,400 hours of local news produced weekly and 640 broadcast channels reaching millions of American homes, Sinclair (NASDAQ:SBGI) operates a network of 185 local television stations across 86 U.S. markets, producing news programming and distributing content from major networks.
Sinclair's television stations form the backbone of its business, broadcasting a mix of network programming, locally-produced news, sports events, and original content. The company maintains affiliation agreements with all major networks, including FOX (55 stations), ABC (40), CBS (30), NBC (25), CW (47), and MyNetworkTV (39), allowing it to deliver popular national programming to local audiences.
The company generates revenue primarily through two channels: selling advertising time on its stations and collecting distribution fees from cable, satellite, and streaming providers that carry Sinclair's channels. This dual-revenue model provides some insulation from fluctuations in the advertising market.
Local news production represents a significant investment for Sinclair, with news programming produced at 115 stations across 73 markets. For example, a typical Sinclair station might broadcast morning, midday, evening, and late-night newscasts focused on local events, weather, and sports, supplemented by the company's national news program, The National Desk.
Beyond traditional broadcasting, Sinclair operates several specialty networks including Comet (science fiction), CHARGE! (action entertainment), TBD (internet-first content), and The Nest (lifestyle programming). The company also owns Tennis Channel, which broadcasts major tennis tournaments and original sports programming, along with related digital properties like Tennis.com.
Sinclair has diversified into complementary businesses, including Compulse (digital marketing technology), Dielectric (broadcast equipment manufacturing), and ONE Media 3.0 (next-generation TV technology development). The company maintains investments in real estate, venture capital, and technology companies, particularly those focused on wireless communications and advertising technology.
4. Traditional Media & Publishing
The sector faces structural headwinds from declining linear TV viewership, shifts in advertising spend toward digital platforms, and ongoing challenges in monetizing print and broadcast content. However, for companies that invest wisely, tailwinds can include AI, the power of which can result in more personalized content creation and more detailed audience analysis. These can create a flywheel of success where one feeds into the other. Still there are outstanding questions around AI-generated content oversight, and the regulatory framework around this could evolve in unseen ways over the next few years.
Sinclair competes with other broadcast television groups like Nexstar Media Group (NASDAQ:NXST), Gray Television (NYSE:GTN), and TEGNA (NYSE:TGNA), as well as with larger media conglomerates such as Comcast (NASDAQ:CMCSA) and Paramount Global (NASDAQ:PARA) that own local stations.
5. Revenue Growth
A company’s long-term sales performance can indicate its overall quality. Any business can put up a good quarter or two, but many enduring ones grow for years.
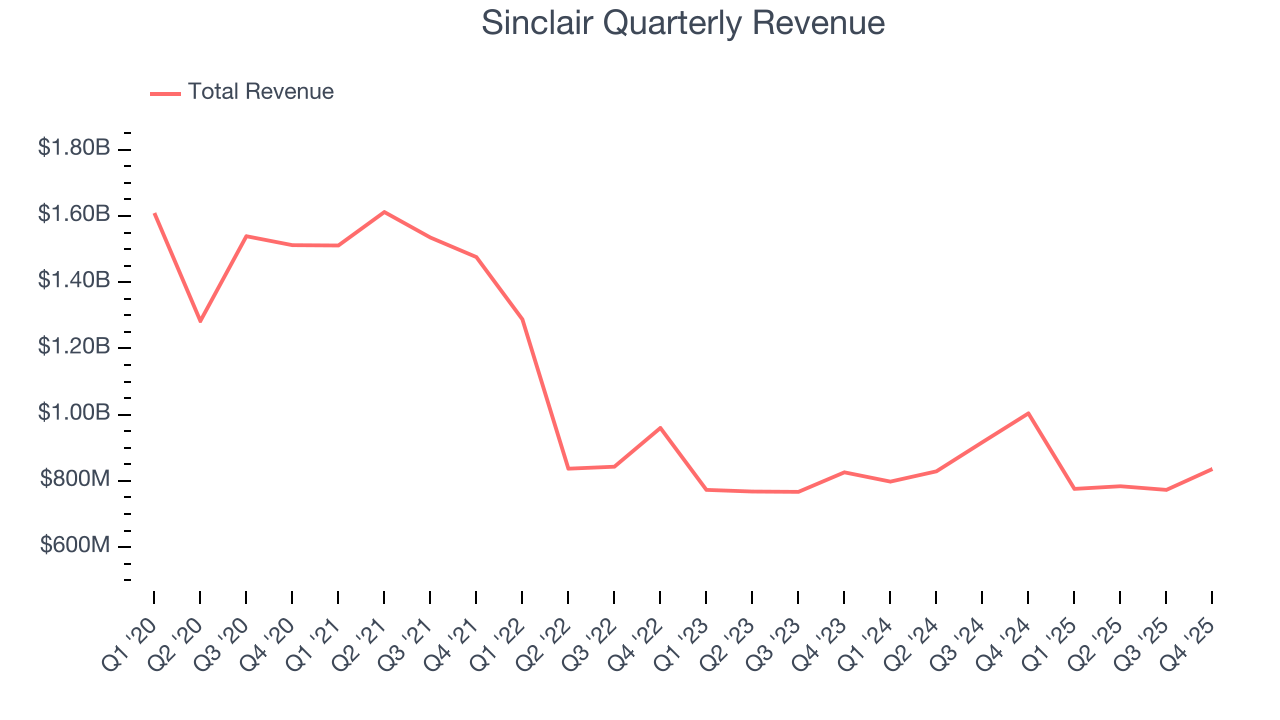
With $3.17 billion in revenue over the past 12 months, Sinclair is a mid-sized business services company, which sometimes brings disadvantages compared to larger competitors benefiting from better economies of scale.
As you can see below, Sinclair struggled to generate demand over the last five years. Its sales dropped by 11.8% annually, a rough starting point for our analysis.
We at StockStory place the most emphasis on long-term growth, but within business services, a half-decade historical view may miss recent innovations or disruptive industry trends. Sinclair’s revenue over the last two years was flat, sugggesting its demand was weak but stabilized after its initial drop. 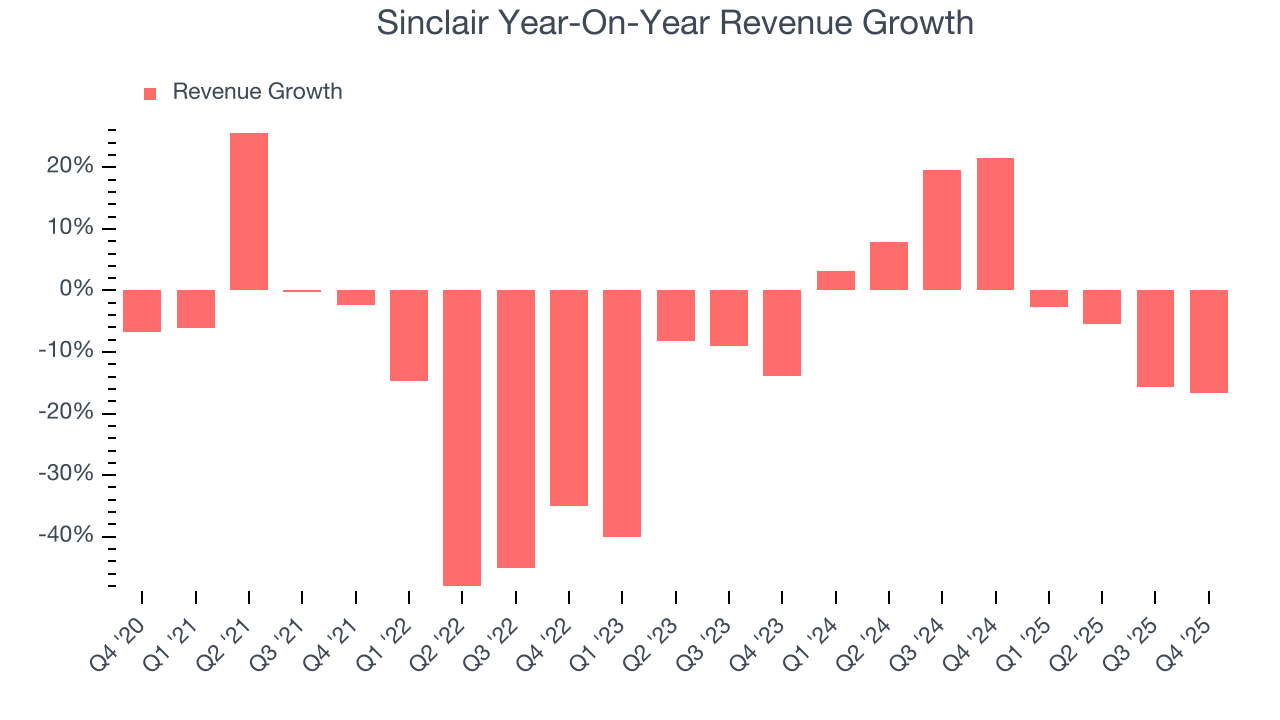
We can better understand the company’s revenue dynamics by analyzing its most important segments, Distribution and Advertising, which are 100% and 52.4% of revenue. Over the last two years, Sinclair’s Distribution revenue (content distribution) averaged 21.1% year-on-year growth while its Advertising revenue (advertising sales) averaged 7.8% growth. 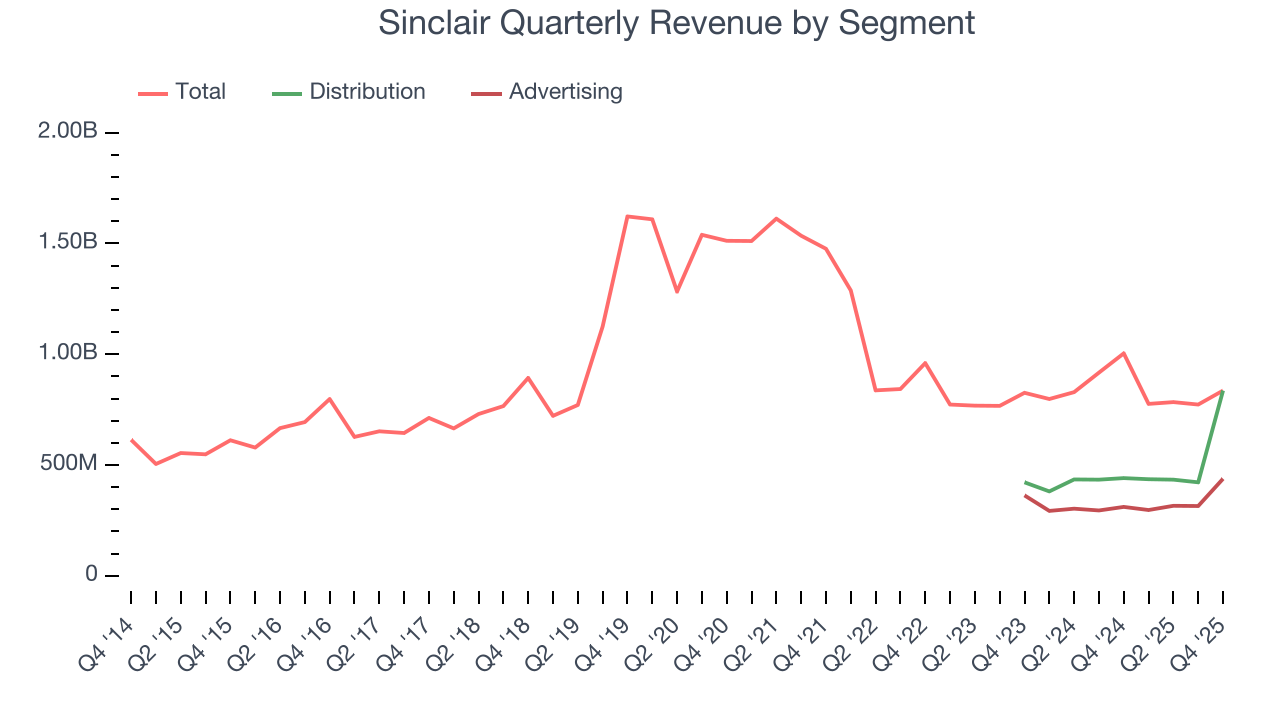
This quarter, Sinclair reported a rather uninspiring 16.7% year-on-year revenue decline to $836 million of revenue, in line with Wall Street’s estimates.
Looking ahead, sell-side analysts expect revenue to grow 11.1% over the next 12 months, an improvement versus the last two years. This projection is noteworthy and indicates its newer products and services will fuel better top-line performance.
6. Operating Margin
Operating margin is one of the best measures of profitability because it tells us how much money a company takes home after subtracting all core expenses, like marketing and R&D.
Sinclair has been a well-oiled machine over the last five years. It demonstrated elite profitability for a business services business, boasting an average operating margin of 22.4%.
Looking at the trend in its profitability, Sinclair’s operating margin rose by 3.9 percentage points over the last five years, showing its efficiency has improved.
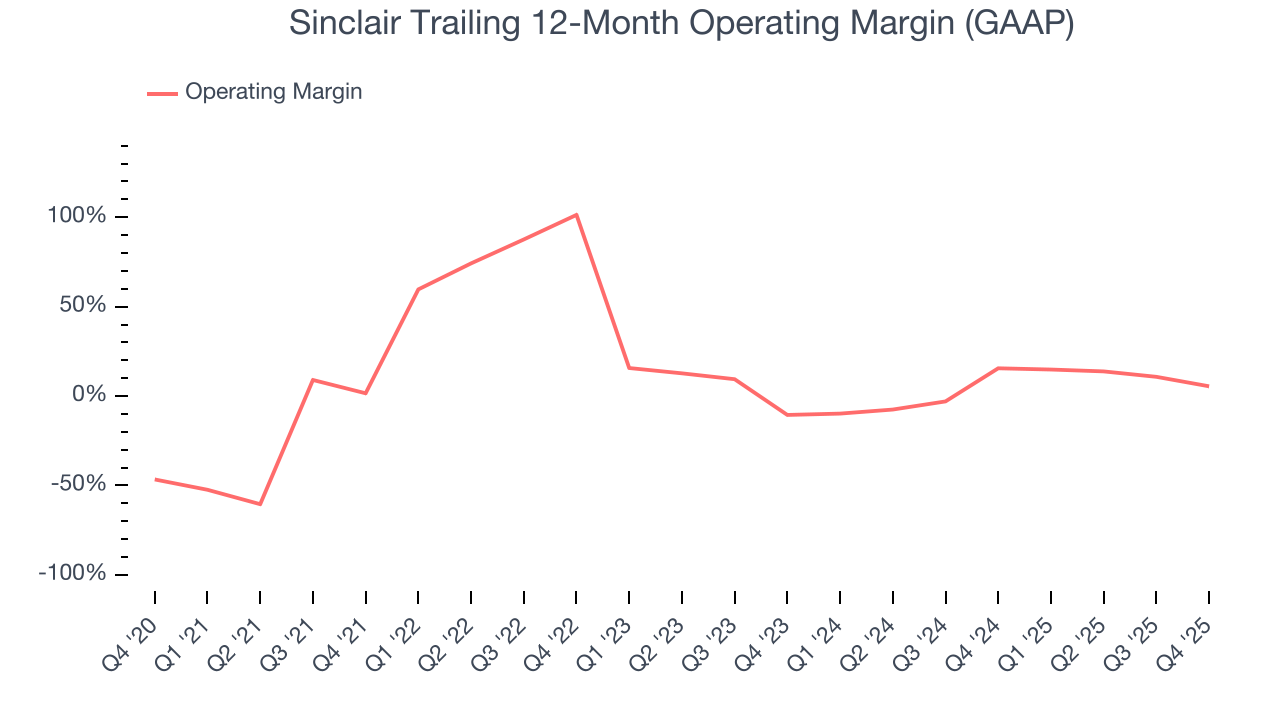
This quarter, Sinclair generated an operating margin profit margin of 9.6%, down 16.9 percentage points year on year. This contraction shows it was less efficient because its expenses increased relative to its revenue.
7. Earnings Per Share
We track the long-term change in earnings per share (EPS) for the same reason as long-term revenue growth. Compared to revenue, however, EPS highlights whether a company’s growth is profitable.
Although Sinclair’s full-year earnings are still negative, it reduced its losses and improved its EPS by 44.7% annually over the last five years. The next few quarters will be critical for assessing its long-term profitability.
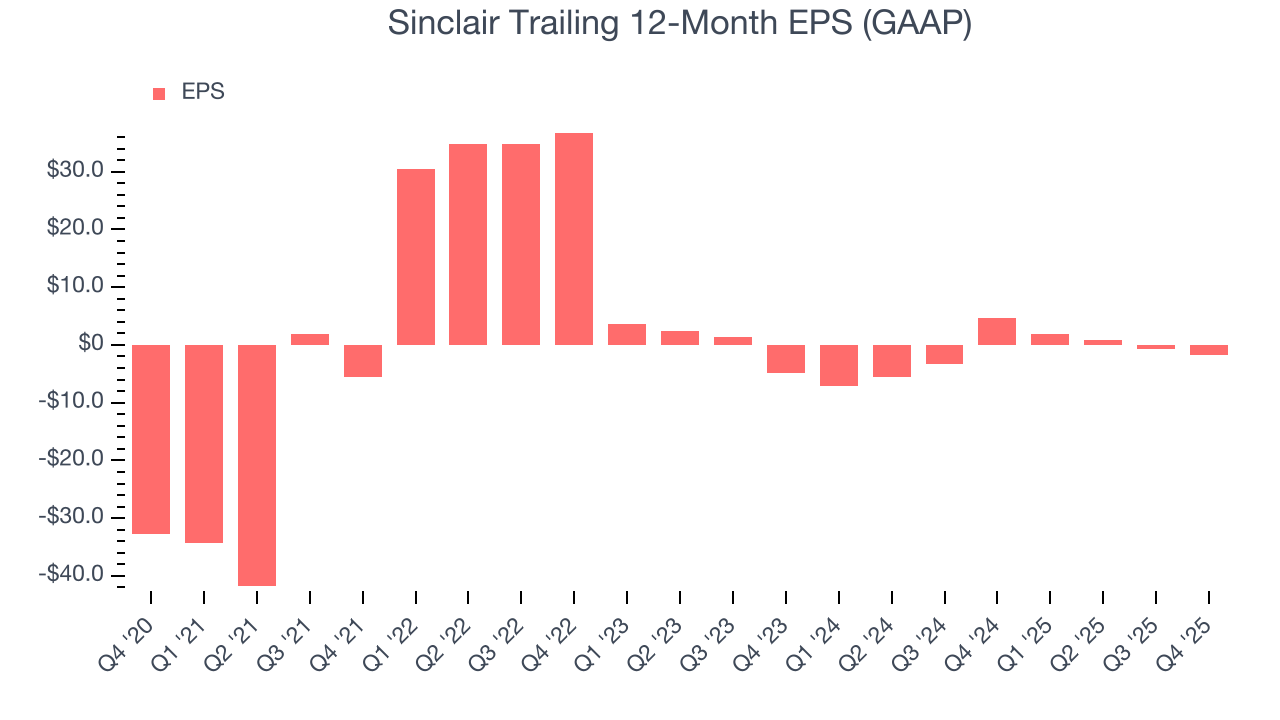
Like with revenue, we analyze EPS over a shorter period to see if we are missing a change in the business.
For Sinclair, its two-year annual EPS growth of 40.8% was lower than its five-year trend. We still think its growth was good and hope it can accelerate in the future.
In Q4, Sinclair reported EPS of $1.55, down from $2.62 in the same quarter last year. Despite falling year on year, this print easily cleared analysts’ estimates. Over the next 12 months, Wall Street is optimistic. Analysts forecast Sinclair’s full-year EPS of negative $1.70 will flip to positive $0.59.
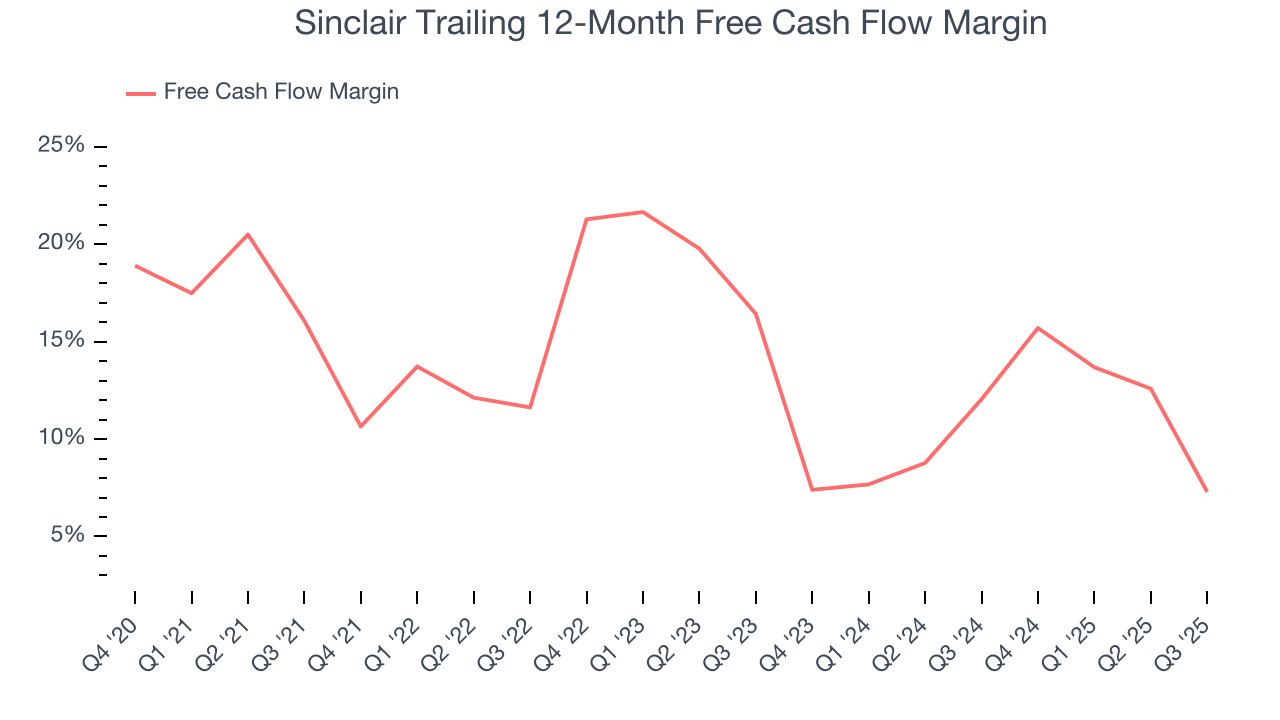
8. Cash Is King
Although earnings are undoubtedly valuable for assessing company performance, we believe cash is king because you can’t use accounting profits to pay the bills.
Sinclair has shown robust cash profitability, giving it an edge over its competitors and the ability to reinvest or return capital to investors. The company’s free cash flow margin averaged 11.9% over the last five years, quite impressive for a business services business.
Taking a step back, we can see that Sinclair’s margin dropped by 12.3 percentage points during that time. If its declines continue, it could signal increasing investment needs and capital intensity.
9. Return on Invested Capital (ROIC)
EPS and free cash flow tell us whether a company was profitable while growing its revenue. But was it capital-efficient? Enter ROIC, a metric showing how much operating profit a company generates relative to the money it has raised (debt and equity).
Although Sinclair hasn’t been the highest-quality company lately because of its poor top-line performance, it historically found a few growth initiatives that worked out well. Its five-year average ROIC was 21.3%, impressive for a business services business.
We like to invest in businesses with high returns, but the trend in a company’s ROIC is what often surprises the market and moves the stock price. Unfortunately, Sinclair’s ROIC has decreased significantly over the last few years. We like what management has done in the past, but its declining returns are perhaps a symptom of fewer profitable growth opportunities.
10. Balance Sheet Risk
Debt is a tool that can boost company returns but presents risks if used irresponsibly. As long-term investors, we aim to avoid companies taking excessive advantage of this instrument because it could lead to insolvency.
Sinclair’s $4.59 billion of debt exceeds the $866 million of cash on its balance sheet. Furthermore, its 8× net-debt-to-EBITDA ratio (based on its EBITDA of $481 million over the last 12 months) shows the company is overleveraged.
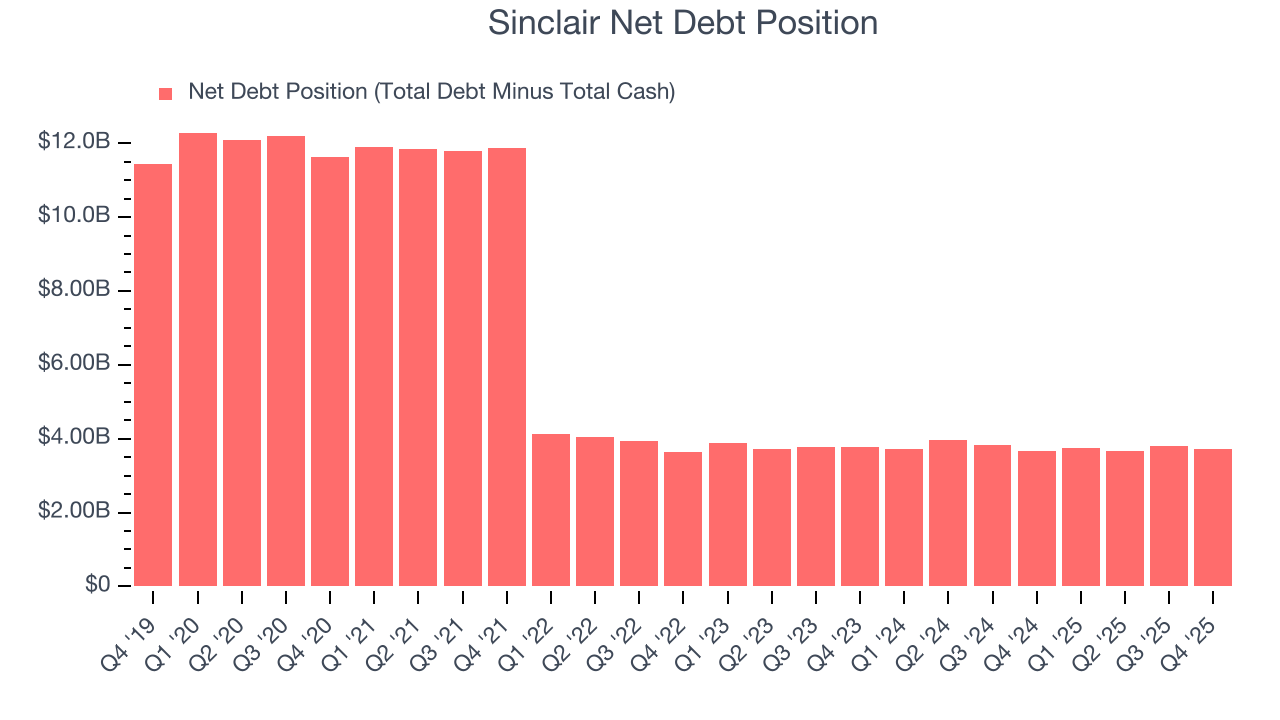
At this level of debt, incremental borrowing becomes increasingly expensive and credit agencies could downgrade the company’s rating if profitability falls. Sinclair could also be backed into a corner if the market turns unexpectedly – a situation we seek to avoid as investors in high-quality companies.
We hope Sinclair can improve its balance sheet and remain cautious until it increases its profitability or pays down its debt.
11. Key Takeaways from Sinclair’s Q4 Results
It was good to see Sinclair beat analysts’ EPS expectations this quarter. On the other hand, its full-year revenue guidance slightly missed and its revenue was in line with Wall Street’s estimates. Overall, this print was mixed but still had some key positives. The stock remained flat at $13.81 immediately after reporting.
12. Is Now The Time To Buy Sinclair?
Updated: March 11, 2026 at 11:00 PM EDT
We think that the latest earnings result is only one piece of the bigger puzzle. If you’re deciding whether to own Sinclair, you should also grasp the company’s longer-term business quality and valuation.
We see the value of companies helping their customers, but in the case of Sinclair, we’re out. First off, its revenue has declined over the last five years. While its impressive operating margins show it has a highly efficient business model, the downside is its diminishing returns show management's prior bets haven't worked out. On top of that, its declining EPS over the last five years makes it a less attractive asset to the public markets.
Sinclair’s P/E ratio based on the next 12 months is 19.9x. At this valuation, there’s a lot of good news priced in - we think other companies feature superior fundamentals at the moment.
Wall Street analysts have a consensus one-year price target of $17.86 on the company (compared to the current share price of $13.97).
Although the price target is bullish, readers should exercise caution because analysts tend to be overly optimistic. The firms they work for, often big banks, have relationships with companies that extend into fundraising, M&A advisory, and other rewarding business lines. As a result, they typically hesitate to say bad things for fear they will lose out. We at StockStory do not suffer from such conflicts of interest, so we’ll always tell it like it is.