
Stratasys (SSYS)
Stratasys keeps us up at night. Not only has its sales growth been weak but also its negative returns on capital show it destroyed value.― StockStory Analyst Team
1. News


2. Summary
Why We Think Stratasys Will Underperform
Born from the Founder’s idea of making a toy frog with a glue gun, Stratasys (NASDAQ:SSYS) offers 3D printers and related materials, software, and services to many industries.
- Annual sales declines of 6.3% for the past two years show its products and services struggled to connect with the market during this cycle
- Poor expense management has led to operating margin losses
- Cash-burning tendencies make us wonder if it can sustainably generate shareholder value


Stratasys is skating on thin ice. There are better opportunities in the market.
Why There Are Better Opportunities Than Stratasys


At $7.94 per share, Stratasys trades at 68.4x forward P/E. This valuation multiple seems a bit much considering the tepid revenue growth profile.
There are stocks out there similarly priced with better business quality. We prefer owning these.
3. Stratasys (SSYS) Research Report: Q4 CY2025 Update
3D printing company Stratasys (NASDAQ:SSYS) reported Q4 CY2025 results exceeding the market’s revenue expectations, but sales fell by 6.9% year on year to $140 million. The company’s full-year revenue guidance of $570 million at the midpoint came in 0.8% above analysts’ estimates. Its non-GAAP profit of $0.07 per share was 21.7% above analysts’ consensus estimates.
Stratasys (SSYS) Q4 CY2025 Highlights:
- Revenue: $140 million vs analyst estimates of $139.3 million (6.9% year-on-year decline, 0.5% beat)
- Adjusted EPS: $0.07 vs analyst estimates of $0.06 (21.7% beat)
- Adjusted EBITDA: $9.18 million vs analyst estimates of $10.47 million (6.6% margin, 12.3% miss)
- Adjusted EPS guidance for the upcoming financial year 2026 is $0.12 at the midpoint, missing analyst estimates by 52.6%
- EBITDA guidance for the upcoming financial year 2026 is $27.5 million at the midpoint, below analyst estimates of $37.56 million
- Operating Margin: -14.8%, down from -6.5% in the same quarter last year
- Market Capitalization: $837.3 million
Company Overview
Born from the Founder’s idea of making a toy frog with a glue gun, Stratasys (NASDAQ:SSYS) offers 3D printers and related materials, software, and services to many industries.
Stratasys traces its roots back to the late 1980s when it was founded by S. Scott Crump, the inventor of fused deposition modeling (FDM) technology. This breakthrough changed the world of additive manufacturing, enabling the production of complex 3D printers parts layer by layer. Today, the company serves a wide array of industries from aerospace and healthcare to healthcare and education.
Stratasys offers a wide range of 3D printers and related materials, softwares, and services. Whether it's rapid prototyping, tooling production, or end-use part manufacturing, Stratasys's advanced 3D printing systems cater to a wide range of applications and enable manufacturers to bring their ideas to life. One of Stratasys's flagship products is the FDM (Fused Deposition Modeling) 3D printer series which use thermoplastic materials to build prototypes and functional parts.
The company often enters into long-term contracts with its customers, particularly in the case of large-scale installations or ongoing service agreements. These contracts typically involve provisions for equipment procurement, maintenance services, software licensing, and consumables supply. By establishing contractual relationships with customers, Stratasys can secure recurring revenue streams and build long-term partnerships.
4. Custom Parts Manufacturing
Onshoring and inventory management–themes that grew in focus after COVID wreaked havoc on global supply chains–are tailwinds for companies that combine economies of scale with reliable service. Many in the space have adopted 3D printing to efficiently address the need for bespoke parts and components, but all companies are still at the whim of economic cycles. For example, consumer spending and interest rates can greatly impact the industrial production that drives demand for these companies’ offerings.
Competitors offering similar products include 3D Systems (NYSE:DDD), Desktop Metal (NYSE:DM), Proto Labs (NYSE:PRLB).
5. Revenue Growth
A company’s long-term performance is an indicator of its overall quality. Any business can experience short-term success, but top-performing ones enjoy sustained growth for years. Regrettably, Stratasys’s sales grew at a weak 1.1% compounded annual growth rate over the last five years. This was below our standards and is a poor baseline for our analysis.
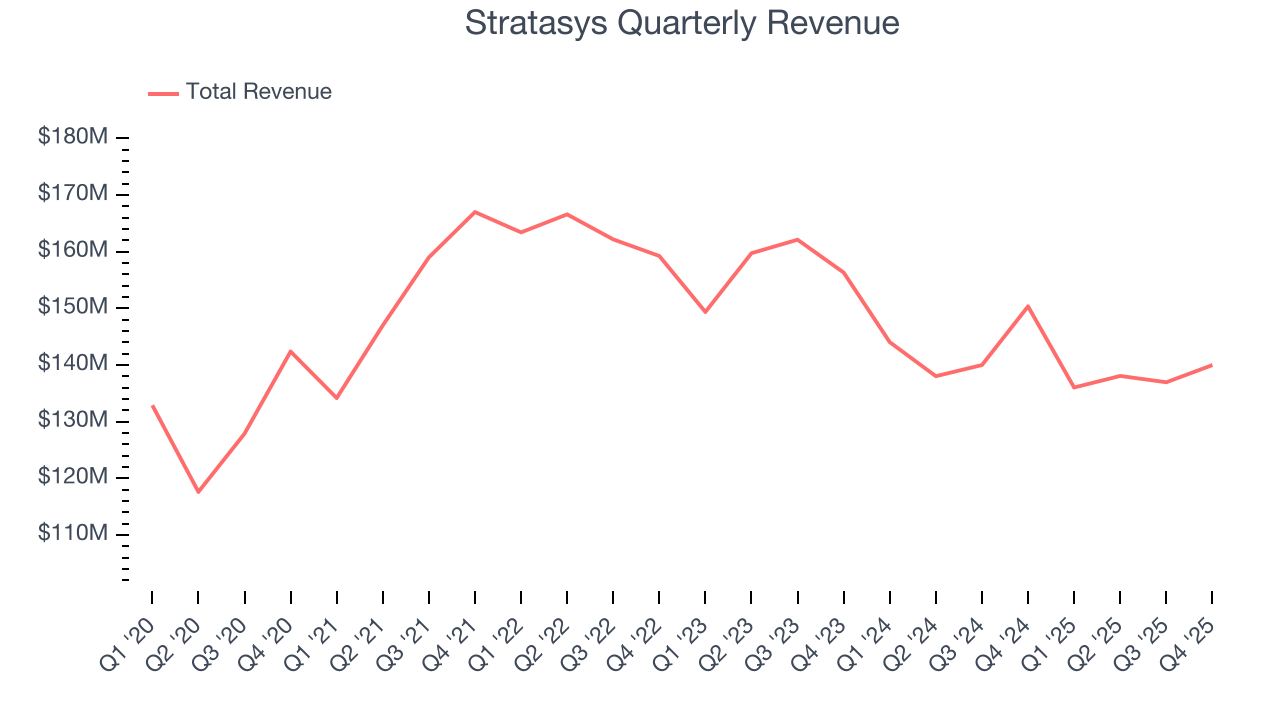
Long-term growth is the most important, but within industrials, a half-decade historical view may miss new industry trends or demand cycles. Stratasys’s performance shows it grew in the past but relinquished its gains over the last two years, as its revenue fell by 6.3% annually. 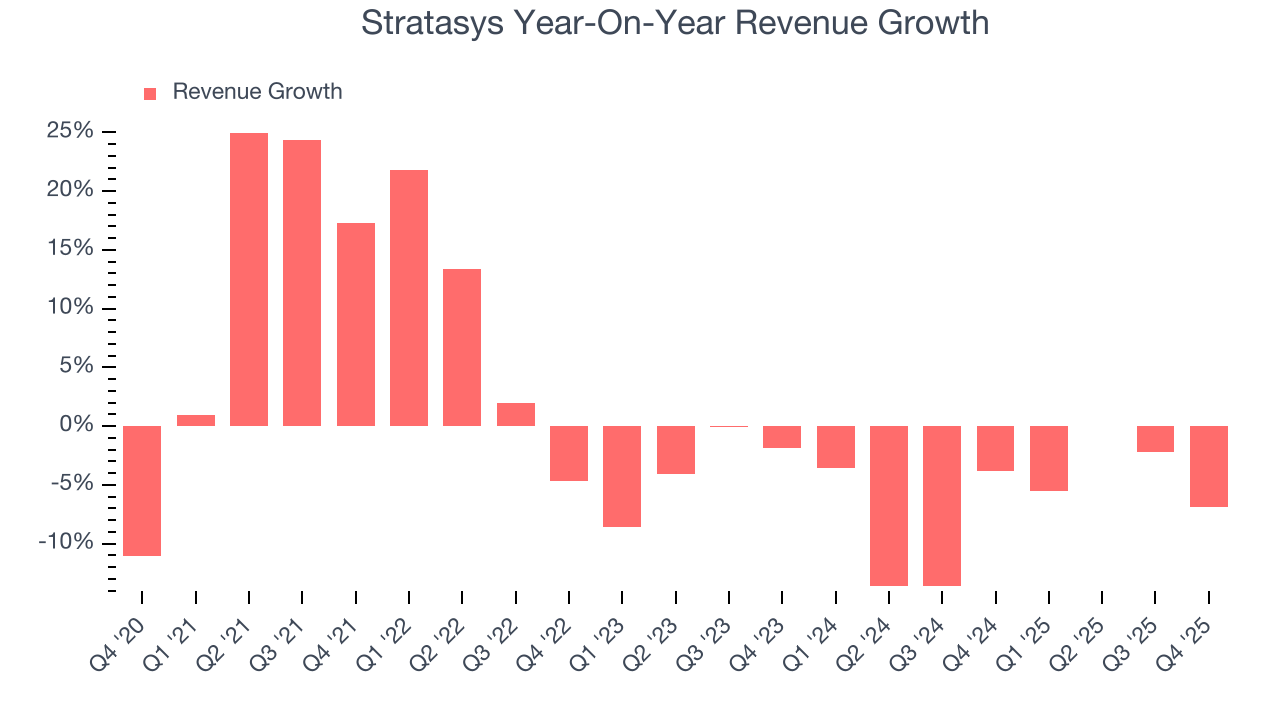
We can better understand the company’s revenue dynamics by analyzing its most important segments, Products and Services, which are 69.7% and 30.3% of revenue. Over the last two years, Stratasys’s Products revenue (hard goods like 3D printers) averaged 2.8% year-on-year declines while its Services revenue (service contracts, consulting) averaged 5.4% declines. 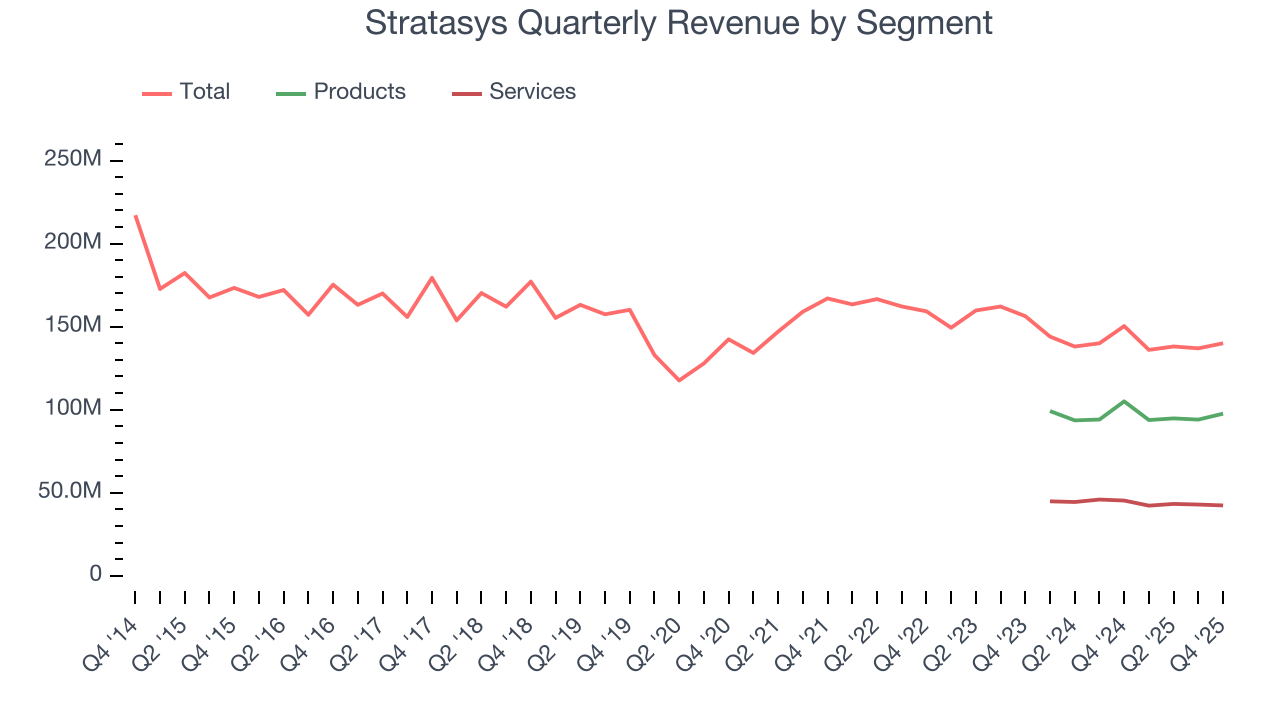
This quarter, Stratasys’s revenue fell by 6.9% year on year to $140 million but beat Wall Street’s estimates by 0.5%.
Looking ahead, sell-side analysts expect revenue to grow 2.8% over the next 12 months. While this projection implies its newer products and services will catalyze better top-line performance, it is still below average for the sector.
6. Gross Margin & Pricing Power
Stratasys has best-in-class unit economics for an industrials company, enabling it to invest in areas such as research and development. Its margin also signals it sells differentiated products, not commodities. As you can see below, it averaged an elite 43.2% gross margin over the last five years. That means Stratasys only paid its suppliers $56.85 for every $100 in revenue. 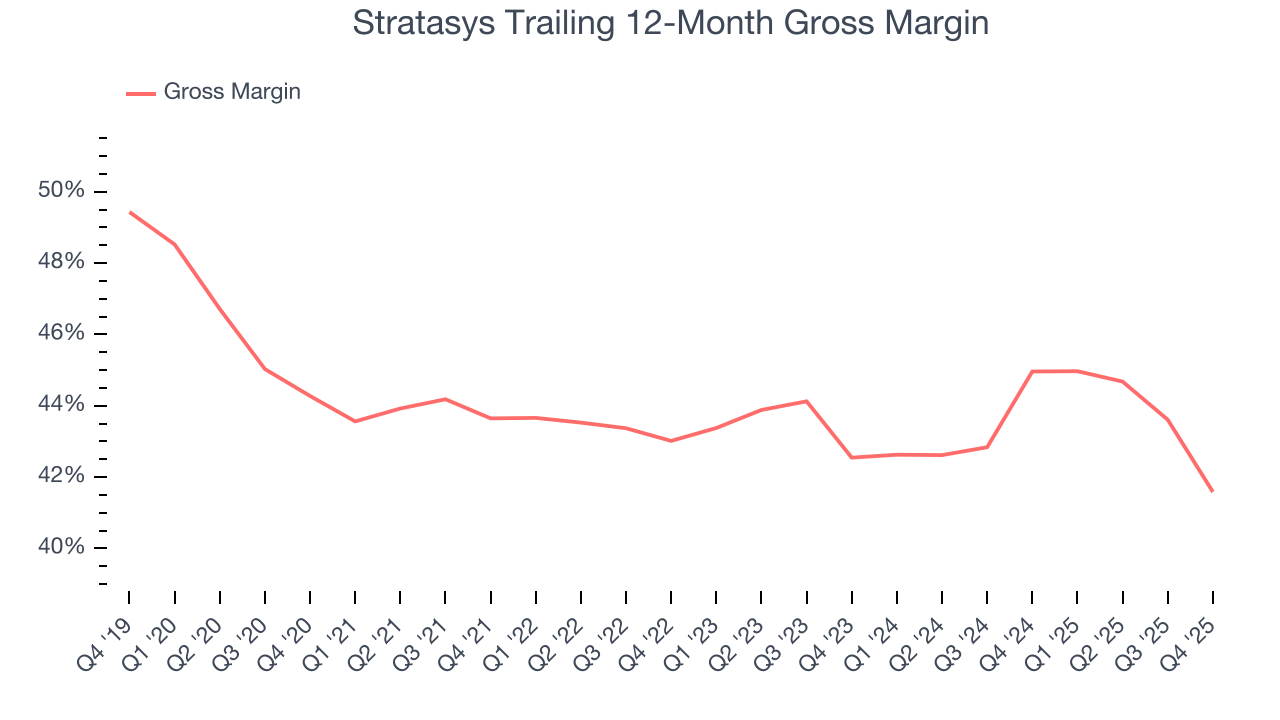
In Q4, Stratasys produced a 36.8% gross profit margin , marking a 7.9 percentage point decrease from 44.6% in the same quarter last year. Stratasys’s full-year margin has also been trending down over the past 12 months, decreasing by 3.4 percentage points. If this move continues, it could suggest a more competitive environment with some pressure to lower prices and higher input costs (such as raw materials and manufacturing expenses).
7. Operating Margin
Operating margin is an important measure of profitability as it shows the portion of revenue left after accounting for all core expenses – everything from the cost of goods sold to advertising and wages. It’s also useful for comparing profitability across companies with different levels of debt and tax rates because it excludes interest and taxes.
Stratasys’s operating margin has risen over the last 12 months, but it still averaged negative 12.7% over the last five years. This is due to its large expense base and inefficient cost structure.
Analyzing the trend in its profitability, Stratasys’s operating margin might fluctuated slightly but has generally stayed the same over the last five years. This raises questions about the company’s expense base because its revenue growth should have given it leverage on its fixed costs, resulting in better economies of scale and profitability.
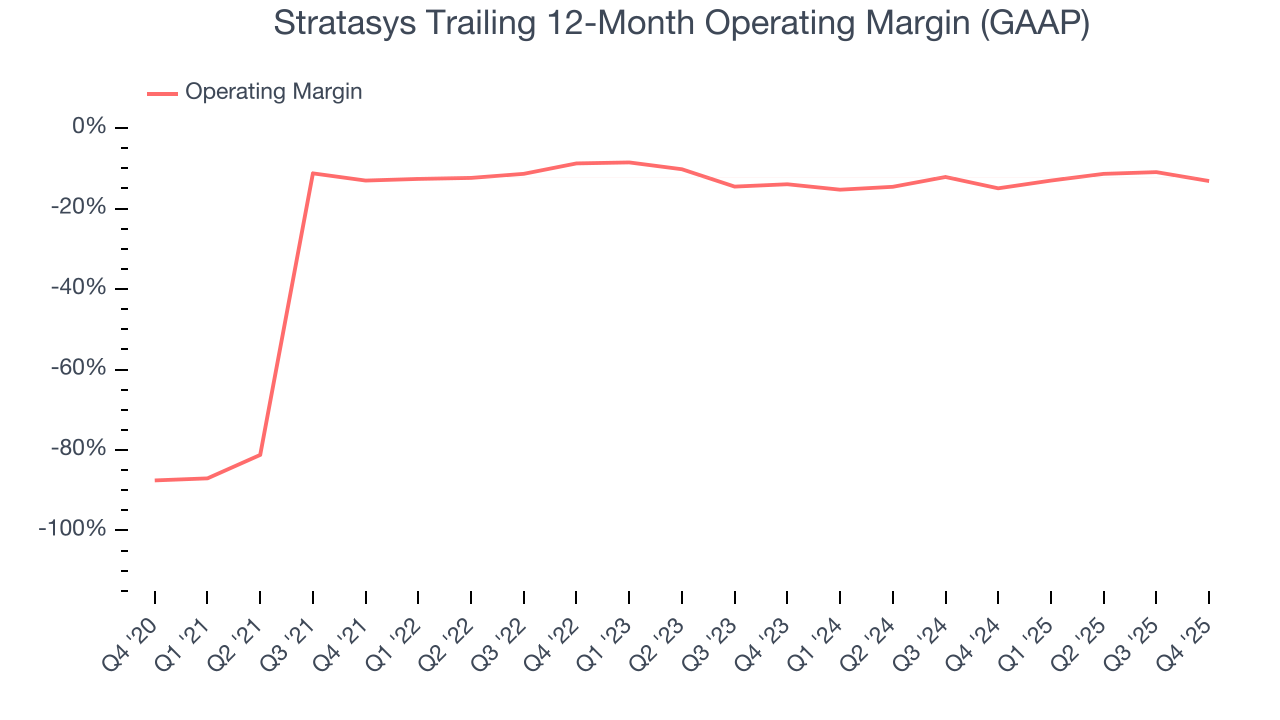
This quarter, Stratasys generated a negative 14.8% operating margin. The company's consistent lack of profits raise a flag.
8. Earnings Per Share
We track the long-term change in earnings per share (EPS) for the same reason as long-term revenue growth. Compared to revenue, however, EPS highlights whether a company’s growth is profitable.
Stratasys’s full-year EPS flipped from negative to positive over the last five years. This is encouraging and shows it’s at a critical moment in its life.
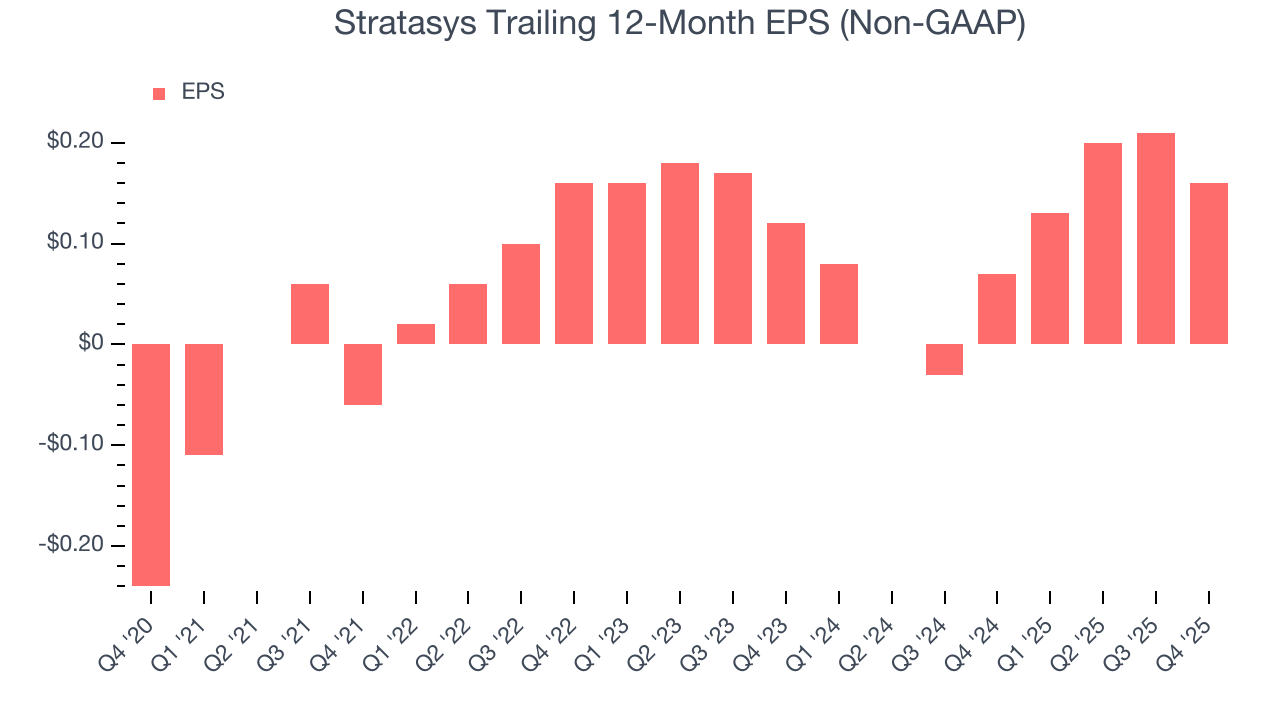
Like with revenue, we analyze EPS over a more recent period because it can provide insight into an emerging theme or development for the business.
Stratasys’s EPS grew at a spectacular 15.5% compounded annual growth rate over the last two years, higher than its 6.3% annualized revenue declines. This tells us management adapted its cost structure in response to a challenging demand environment.
In Q4, Stratasys reported adjusted EPS of $0.07, down from $0.12 in the same quarter last year. Despite falling year on year, this print easily cleared analysts’ estimates. Over the next 12 months, Wall Street expects Stratasys’s full-year EPS of $0.16 to grow 50%.
9. Cash Is King
Although earnings are undoubtedly valuable for assessing company performance, we believe cash is king because you can’t use accounting profits to pay the bills.
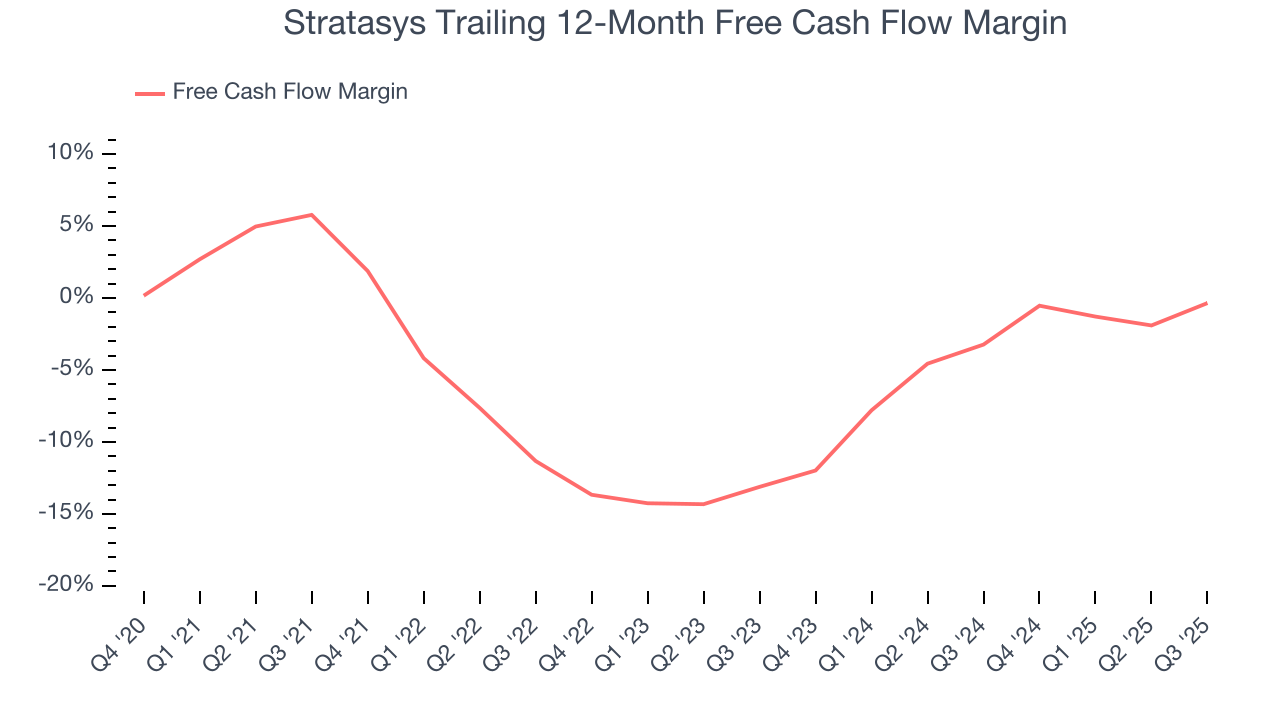
Stratasys’s demanding reinvestments have drained its resources over the last five years, putting it in a pinch and limiting its ability to return capital to investors. Its free cash flow margin averaged negative 5.6%, meaning it lit $5.61 of cash on fire for every $100 in revenue.
Taking a step back, we can see that Stratasys’s margin dropped by 5.1 percentage points during that time. Almost any movement in the wrong direction is undesirable because it is already burning cash. If the trend continues, it could signal it’s becoming a more capital-intensive business.
10. Return on Invested Capital (ROIC)
EPS and free cash flow tell us whether a company was profitable while growing its revenue. But was it capital-efficient? A company’s ROIC explains this by showing how much operating profit it makes compared to the money it has raised (debt and equity).
Stratasys’s five-year average ROIC was negative 10.3%, meaning management lost money while trying to expand the business. Its returns were among the worst in the industrials sector.
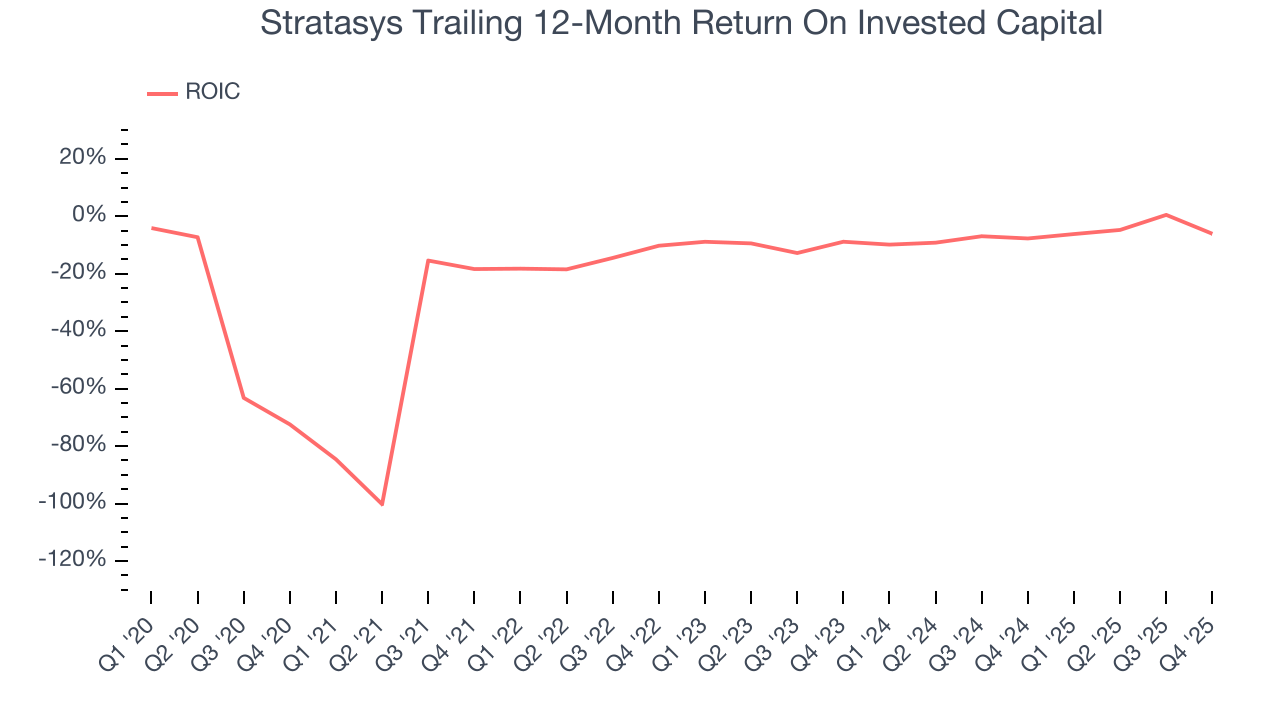
We like to invest in businesses with high returns, but the trend in a company’s ROIC is what often surprises the market and moves the stock price. Over the last few years, Stratasys’s ROIC has increased. This is a good sign, but we recognize its lack of profitable growth during the COVID era was the primary reason for the change.
11. Balance Sheet Assessment
One of the best ways to mitigate bankruptcy risk is to hold more cash than debt.
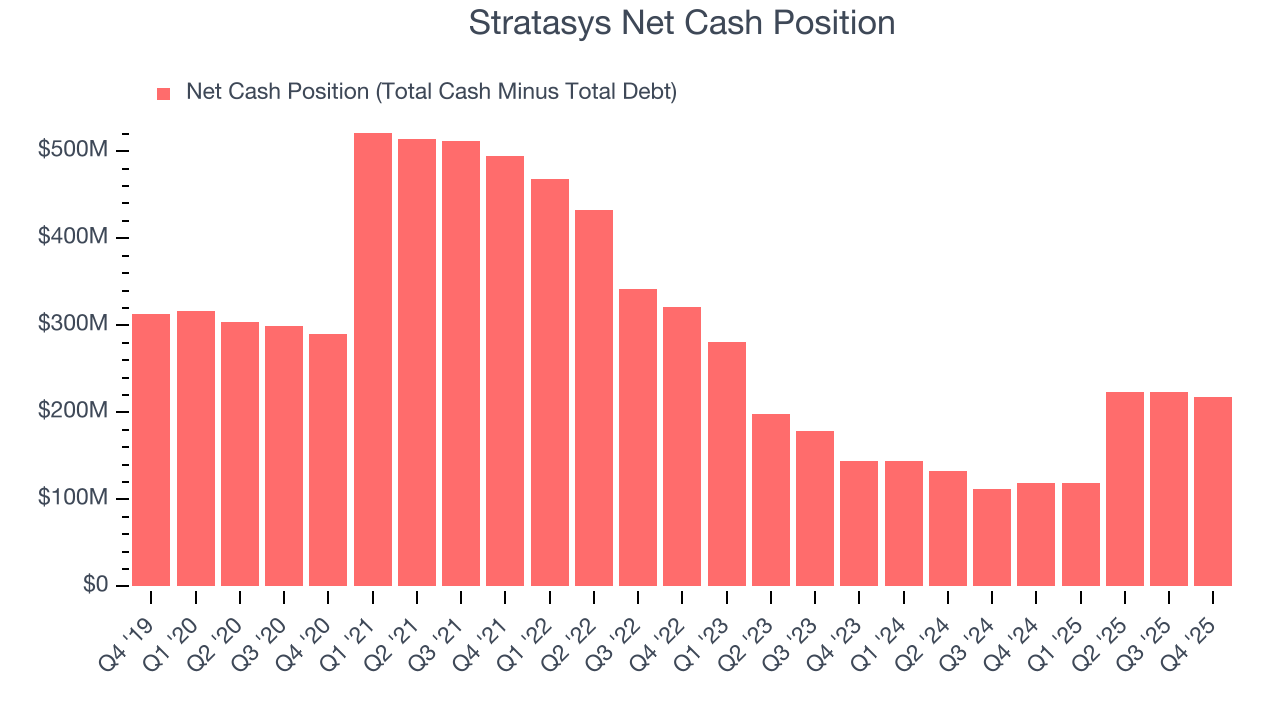
Stratasys is a well-capitalized company with $244.5 million of cash and $26.5 million of debt on its balance sheet. This $218 million net cash position is 28% of its market cap and gives it the freedom to borrow money, return capital to shareholders, or invest in growth initiatives. Leverage is not an issue here.
12. Key Takeaways from Stratasys’s Q4 Results
It was good to see Stratasys beat analysts’ EPS expectations this quarter. We were also glad its full-year revenue guidance slightly exceeded Wall Street’s estimates. On the other hand, its full-year EBITDA guidance missed and its EBITDA fell short of Wall Street’s estimates. Overall, this was a softer quarter. The stock traded down 3.9% to $9.42 immediately after reporting.
13. Is Now The Time To Buy Stratasys?
Updated: March 16, 2026 at 11:40 PM EDT
We think that the latest earnings result is only one piece of the bigger puzzle. If you’re deciding whether to own Stratasys, you should also grasp the company’s longer-term business quality and valuation.
We see the value of companies helping their customers, but in the case of Stratasys, we’re out. First off, its revenue growth was weak over the last five years. While its astounding EPS growth over the last five years shows its profits are trickling down to shareholders, the downside is its relatively low ROIC suggests management has struggled to find compelling investment opportunities. On top of that, its projected EPS for the next year is lacking.
Stratasys’s P/E ratio based on the next 12 months is 68.4x. At this valuation, there’s a lot of good news priced in - you can find more timely opportunities elsewhere.
Wall Street analysts have a consensus one-year price target of $12.33 on the company (compared to the current share price of $7.94).
Although the price target is bullish, readers should exercise caution because analysts tend to be overly optimistic. The firms they work for, often big banks, have relationships with companies that extend into fundraising, M&A advisory, and other rewarding business lines. As a result, they typically hesitate to say bad things for fear they will lose out. We at StockStory do not suffer from such conflicts of interest, so we’ll always tell it like it is.