
S&T Bancorp (STBA)
We aren’t fans of S&T Bancorp. Its sluggish sales growth shows demand is soft, a worrisome sign for investors in high-quality stocks.― StockStory Analyst Team
1. News


2. Summary
Why We Think S&T Bancorp Will Underperform
Tracing its roots back to 1902 in western Pennsylvania's industrial heartland, S&T Bancorp (NASDAQ:STBA) is a Pennsylvania-based bank holding company that provides retail and commercial banking services, cash management, trust services, and investment advisory solutions.
- Forecasted net interest income decline of 5.3% for the upcoming 12 months implies demand will fall off a cliff
- Sales trends were unexciting over the last five years as its 3.4% annual growth was below the typical banking company
- A silver lining is that its incremental sales significantly boosted profitability as its annual earnings per share growth of 42.8% over the last five years outstripped its revenue performance


S&T Bancorp doesn’t fulfill our quality requirements. Our attention is focused on better businesses.
Why There Are Better Opportunities Than S&T Bancorp


S&T Bancorp’s stock price of $40.18 implies a valuation ratio of 1x forward P/B. This multiple is cheaper than most banking peers, but we think this is justified.
Cheap stocks can look like a great deal at first glance, but they can be value traps. They often have less earnings power, meaning there is more reliance on a re-rating to generate good returns - an unlikely scenario for low-quality companies.
3. S&T Bancorp (STBA) Research Report: Q4 CY2025 Update
Regional banking company S&T Bancorp (NASDAQ:STBA) reported revenue ahead of Wall Streets expectations in Q4 CY2025, with sales up 10.8% year on year to $105.3 million. Its GAAP profit of $0.89 per share was 1.7% above analysts’ consensus estimates.
S&T Bancorp (STBA) Q4 CY2025 Highlights:
- Net Interest Income: $90.96 million vs analyst estimates of $89.97 million (9.3% year-on-year growth, 1.1% beat)
- Net Interest Margin: 4% vs analyst estimates of 3.9% (8.7 basis point beat)
- Revenue: $105.3 million vs analyst estimates of $103.8 million (10.8% year-on-year growth, 1.4% beat)
- Efficiency Ratio: 54% vs analyst estimates of 55.2% (117.7 basis point beat)
- EPS (GAAP): $0.89 vs analyst estimates of $0.88 (1.7% beat)
- Tangible Book Value per Share: $29.11 vs analyst estimates of $29.25 (10.9% year-on-year growth, in line)
- Market Capitalization: $1.60 billion
Company Overview
Tracing its roots back to 1902 in western Pennsylvania's industrial heartland, S&T Bancorp (NASDAQ:STBA) is a Pennsylvania-based bank holding company that provides retail and commercial banking services, cash management, trust services, and investment advisory solutions.
S&T Bancorp operates primarily through its main subsidiary, S&T Bank, offering a comprehensive range of financial services to individuals and businesses. The bank's commercial lending portfolio includes real estate, industrial, and construction loans, while its consumer offerings span mortgage products and personal loans. Customers can access traditional banking services through branch locations as well as digital banking platforms.
For businesses, S&T provides cash management solutions that help companies optimize their working capital and streamline payment processes. A manufacturing company in Pennsylvania, for instance, might use S&T's treasury management services to automate accounts payable and receivable while accessing commercial loans to finance equipment purchases or expansion projects.
Beyond traditional banking, S&T generates revenue through its wealth management arm, Stewart Capital Advisors, which manages investment portfolios for individuals and institutions. The company also offers insurance products through S&T Insurance Group and title insurance services through its partial ownership of S&T Settlement Services.
S&T's business model follows the traditional banking revenue structure—earning interest income from loans while paying interest on deposits, with the difference (net interest margin) forming a significant portion of earnings. Additional revenue comes from fees for services like wealth management, insurance products, and transaction processing.
As a regulated financial institution, S&T operates under the supervision of the Federal Reserve, the FDIC, and the Pennsylvania Department of Banking and Securities, with deposits insured by the FDIC up to applicable limits.
4. Regional Banks
Regional banks, financial institutions operating within specific geographic areas, serve as intermediaries between local depositors and borrowers. They benefit from rising interest rates that improve net interest margins (the difference between loan yields and deposit costs), digital transformation reducing operational expenses, and local economic growth driving loan demand. However, these banks face headwinds from fintech competition, deposit outflows to higher-yielding alternatives, credit deterioration (increasing loan defaults) during economic slowdowns, and regulatory compliance costs. Recent concerns about regional bank stability following high-profile failures and significant commercial real estate exposure present additional challenges.
S&T Bancorp competes with other regional banks operating in Pennsylvania and Ohio, including PNC Financial Services (NYSE:PNC), F.N.B. Corporation (NYSE:FNB), Northwest Bancshares (NASDAQ:NWBI), and First Commonwealth Financial (NYSE:FCF).
5. Sales Growth
Net interest income and and fee-based revenue are the two pillars supporting bank earnings. The former captures profit from the gap between lending rates and deposit costs, while the latter encompasses charges for banking services, credit products, wealth management, and trading activities. Regrettably, S&T Bancorp’s revenue grew at a sluggish 3.4% compounded annual growth rate over the last five years. This fell short of our benchmark for the banking sector and is a rough starting point for our analysis.
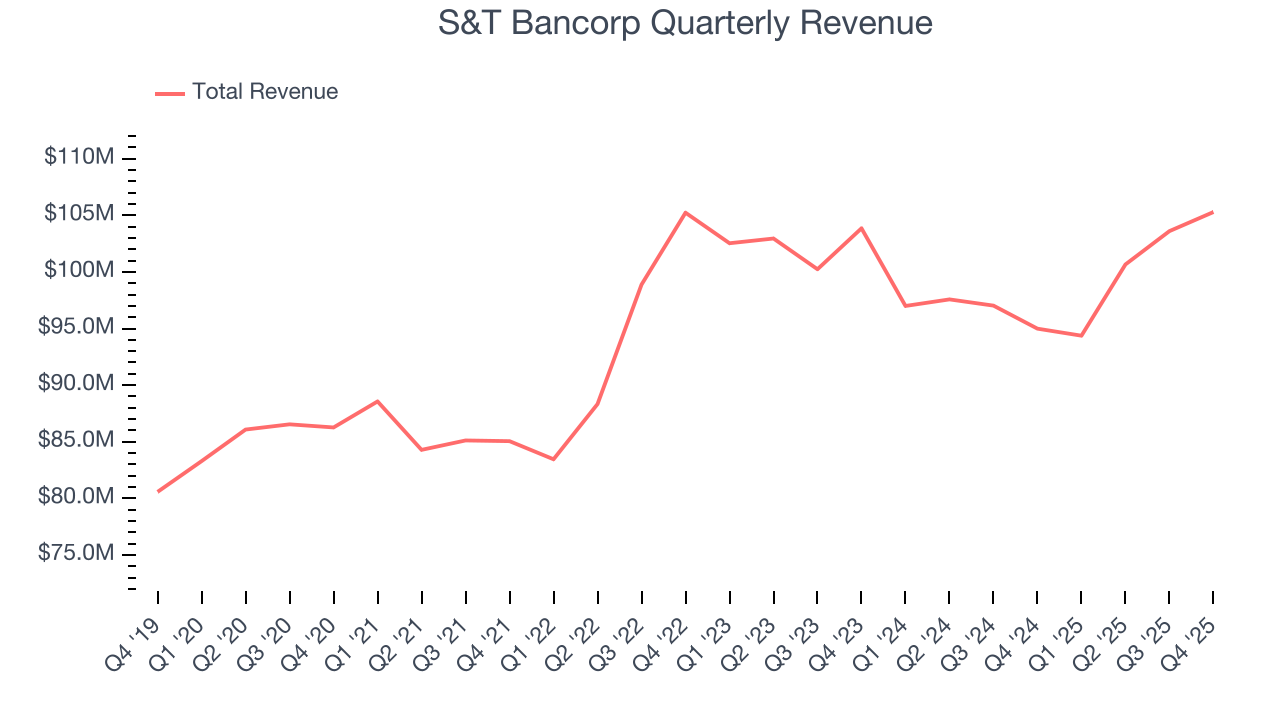
Long-term growth is the most important, but within financials, a half-decade historical view may miss recent interest rate changes and market returns. S&T Bancorp’s recent performance shows its demand has slowed as its revenue was flat over the last two years. 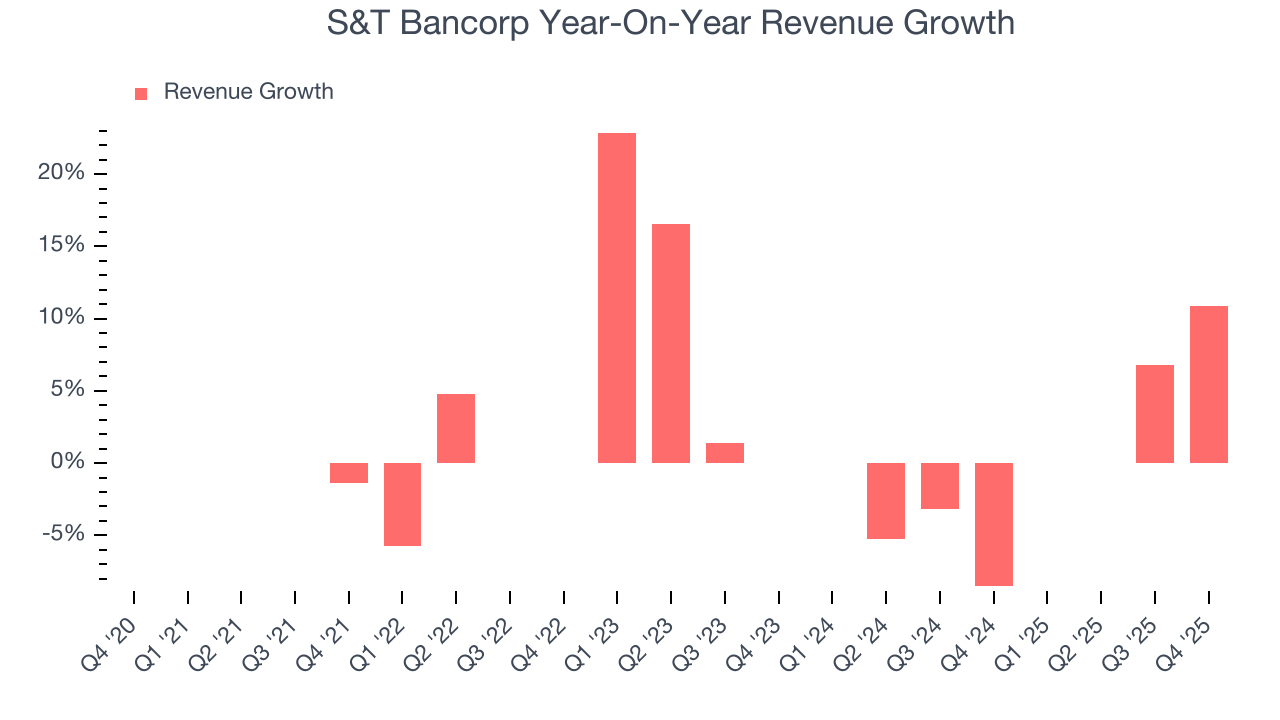 Note: Quarters not shown were determined to be outliers, impacted by outsized investment gains/losses that are not indicative of the recurring fundamentals of the business.
This quarter, S&T Bancorp reported year-on-year revenue growth of 10.8%, and its $105.3 million of revenue exceeded Wall Street’s estimates by 1.4%.
Net interest income made up 84.6% of the company’s total revenue during the last five years, meaning S&T Bancorp barely relies on non-interest income to drive its overall growth.
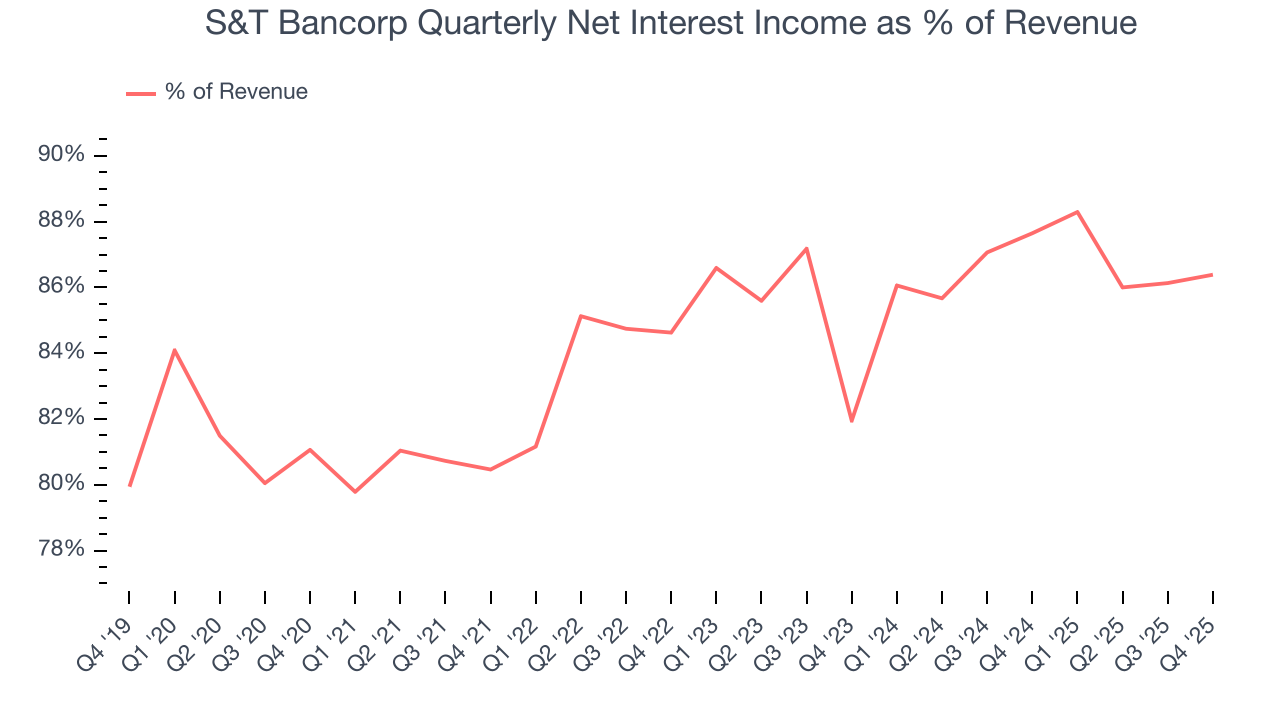
Markets consistently prioritize net interest income growth over fee-based revenue, recognizing its superior quality and recurring nature compared to the more unpredictable non-interest income streams.
6. Earnings Per Share
Revenue trends explain a company’s historical growth, but the long-term change in earnings per share (EPS) points to the profitability of that growth – for example, a company could inflate its sales through excessive spending on advertising and promotions.
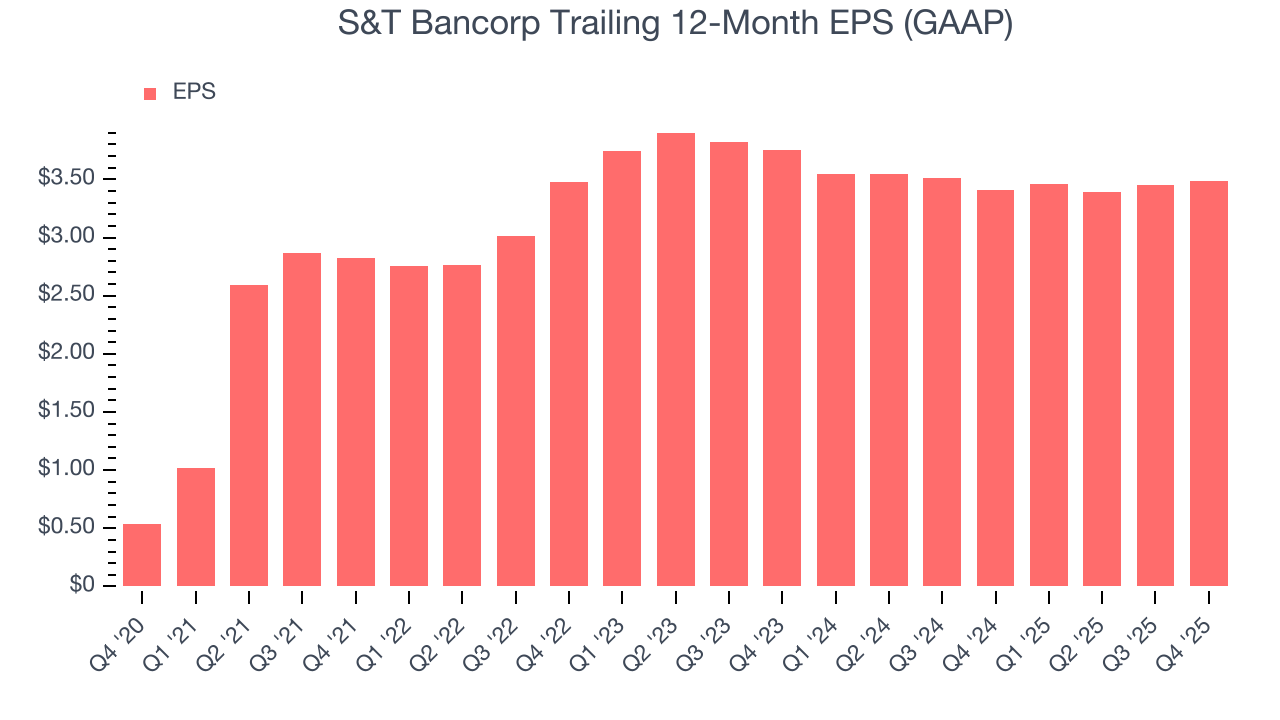
S&T Bancorp’s EPS grew at an astounding 45.4% compounded annual growth rate over the last five years, higher than its 3.4% annualized revenue growth. However, this alone doesn’t tell us much about its business quality because its efficiency ratio didn’t improve.
Like with revenue, we analyze EPS over a shorter period to see if we are missing a change in the business.
For S&T Bancorp, its two-year annual EPS declines of 3.6% mark a reversal from its (seemingly) healthy five-year trend. We hope S&T Bancorp can return to earnings growth in the future.
In Q4, S&T Bancorp reported EPS of $0.89, up from $0.86 in the same quarter last year. This print beat analysts’ estimates by 1.7%. Over the next 12 months, Wall Street expects S&T Bancorp’s full-year EPS of $3.49 to stay about the same.
7. Tangible Book Value Per Share (TBVPS)
The balance sheet drives banking profitability since earnings flow from the spread between borrowing and lending rates. As such, valuations for these companies concentrate on capital strength and sustainable equity accumulation potential.
This is why we consider tangible book value per share (TBVPS) the most important metric to track for banks. TBVPS represents the real, liquid net worth per share of a bank, excluding intangible assets that have debatable value upon liquidation. Other (and more commonly known) per-share metrics like EPS can sometimes be murky due to M&A or accounting rules allowing for loan losses to be spread out.
S&T Bancorp’s TBVPS grew at an excellent 8.2% annual clip over the last five years. TBVPS growth has also accelerated recently, growing by 10.8% annually over the last two years from $23.70 to $29.11 per share.
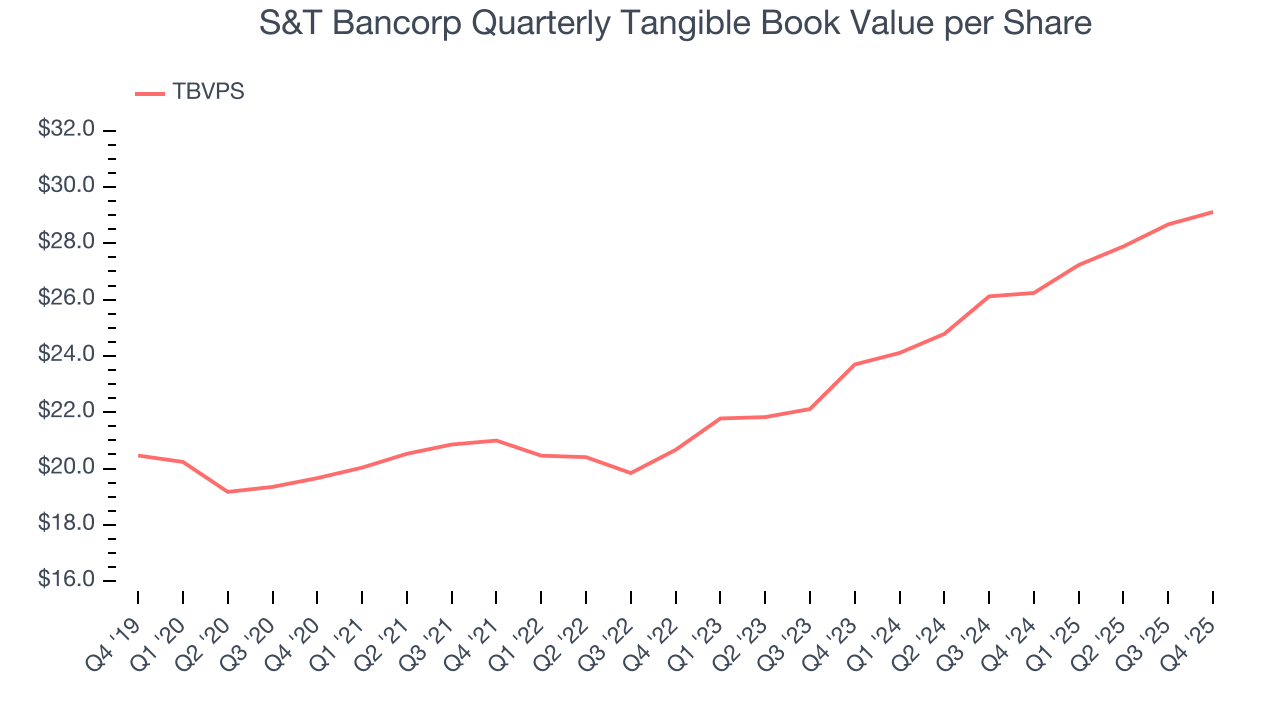
Over the next 12 months, Consensus estimates call for S&T Bancorp’s TBVPS to grow by 8.2% to $31.50, paltry growth rate.
8. Balance Sheet Assessment
Leverage is core to a financial firm’s business model (loans funded by deposits). To ensure economic stability and avoid a repeat of the 2008 GFC, regulators require certain levels of capital and liquidity, focusing on the Tier 1 capital ratio.
Tier 1 capital is the highest-quality capital that a firm holds, consisting primarily of common stock and retained earnings, but also physical gold. It serves as the primary cushion against losses and is the first line of defense in times of financial distress.
This capital is divided by risk-weighted assets to derive the Tier 1 capital ratio. Risk-weighted means that cash and US treasury securities are assigned little risk while unsecured consumer loans and equity investments get much higher risk weights, for example.
New regulation after the 2008 financial crisis requires that all firms must maintain a Tier 1 capital ratio greater than 4.5%. On top of this, there are additional buffers based on scale, risk profile, and other regulatory classifications, so that at the end of the day, firms generally must maintain a 7-10% ratio at minimum.
Over the last two years, S&T Bancorp has averaged a Tier 1 capital ratio of 14.3%, which is considered safe and well capitalized in the event that macro or market conditions suddenly deteriorate.
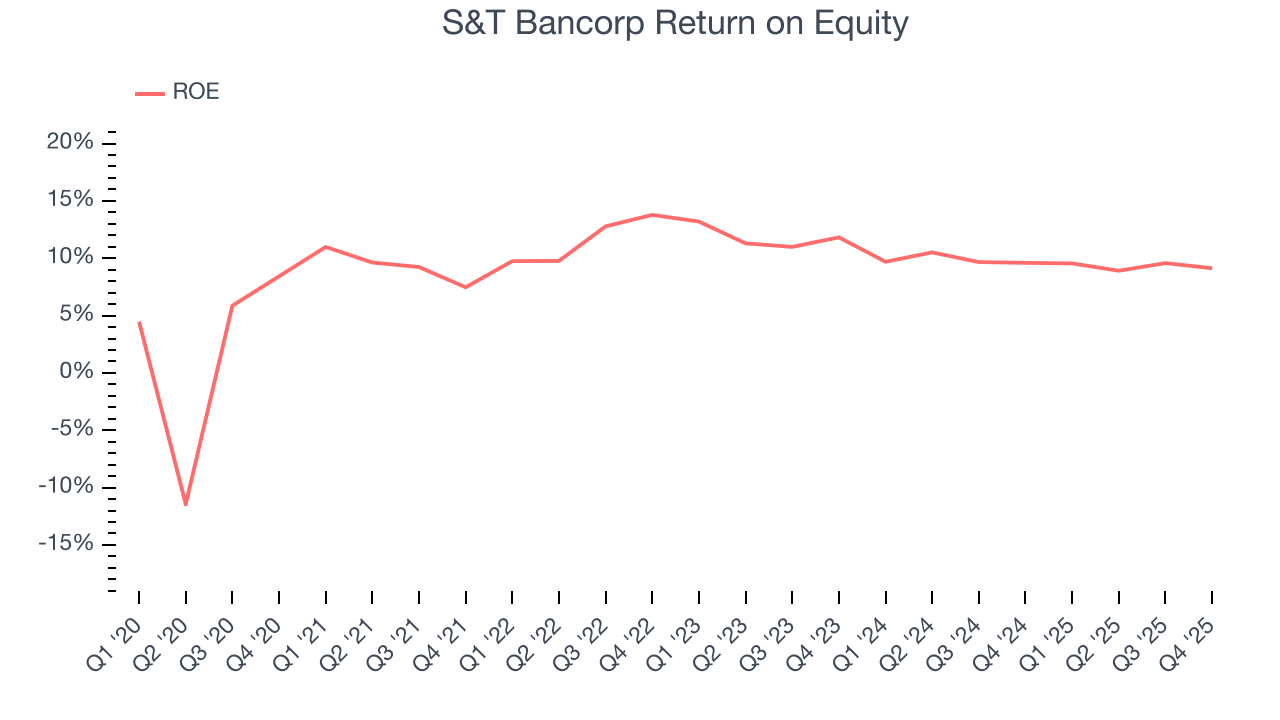
9. Return on Equity
Return on equity (ROE) reveals the profit generated per dollar of shareholder equity, which represents a key source of bank funding. Banks maintaining elevated ROE levels tend to accelerate wealth creation for shareholders via earnings retention, buybacks, and distributions.
Over the last five years, S&T Bancorp has averaged an ROE of 10.4%, respectable for a company operating in a sector where the average shakes out around 7.5% and those putting up 15%+ are greatly admired.
10. Key Takeaways from S&T Bancorp’s Q4 Results
It was good to see S&T Bancorp narrowly top analysts’ revenue expectations this quarter. We were also happy its net interest income narrowly outperformed Wall Street’s estimates, leading to a slight EPS beat. Zooming out, we think this was a solid quarter. The stock remained flat at $41.94 immediately following the results.
11. Is Now The Time To Buy S&T Bancorp?
Updated: March 17, 2026 at 12:57 AM EDT
Before making an investment decision, investors should account for S&T Bancorp’s business fundamentals and valuation in addition to what happened in the latest quarter.
S&T Bancorp isn’t a terrible business, but it isn’t one of our picks. First off, its revenue growth was weak over the last five years. While its astounding EPS growth over the last five years shows its profits are trickling down to shareholders, the downside is its estimated net interest income for the next 12 months are weak. On top of that, its declining net interest margin shows its loan book is becoming less profitable.
S&T Bancorp’s P/B ratio based on the next 12 months is 1x. While this valuation is fair, the upside isn’t great compared to the potential downside. We're fairly confident there are better investments elsewhere.
Wall Street analysts have a consensus one-year price target of $45 on the company (compared to the current share price of $40.18).